EXHIBIT (C)(8)
Published on August 1, 2022
Exhibit (c)(8)
Confidential Draft Project Gemini: Confidential Discussion Materials June 3, 2022
Confidential Draft Disclaimer This presentation has been prepared by Centerview Partners LLC (Centerview) for use solely by the Special Committee of the Board of Directors of Gemini in connection with its evaluation of a proposed share reclassification and for no other purpose. The information contained herein is based upon information supplied by or on behalf of Gemini and publicly available information, and portions of the information contained herein may be based upon statements, estimates and forecasts provided by Gemini. Centerview has relied upon the accuracy and completeness of the foregoing information, and has not assumed any responsibility for any independent verification of such information or for any independent evaluation or appraisal of any of the assets or liabilities (contingent or otherwise) of Gemini or any other entity, or concerning the solvency or fair value of Gemini or any other entity. With respect to financial forecasts, including with respect to estimates of potential synergies, Centerview has assumed that such forecasts have been reasonably prepared on bases reflecting the best currently available estimates and judgments of the managements of Gemini as to their respective future financial performances, and at your direction Centerview has relied upon such forecasts, as provided by Geminis management, with respect to both Gemini, including as to expected synergies. Centerview assumes no responsibility for and expresses no view as to such forecasts or the assumptions on which they are based. The information set forth herein is based upon economic, monetary, market and other conditions as in effect on, and the information made available to us as of, the date hereof, unless indicated otherwise and Centerview assumes no obligation to update or otherwise revise these materials. The financial analysis in this presentation is complex and is not necessarily susceptible to a partial analysis or summary description. In performingthis financial analysis, Centerview has considered the results of its analysis as a whole and did not necessarily attribute a particular weight to any particular portion of the analysis considered. Furthermore, selecting any portion of Centerviews analysis, without considering the analysis as a whole, wouldcreate an incomplete view of the process underlying its financial analysis. Centerview may have deemed various assumptions more or less probable than other assumptions, so the reference ranges resulting from any particular portion of the analysis described above should not be taken to be Centerviews view of the actual value of Gemini. These materials and the information contained herein are confidential, were not prepared with a view toward public disclosure, and may not be disclosed publicly or made available to third parties without the prior written consent of Centerview. These materials and any other advice, written or oral, rendered by Centerview are intended solely for the benefit and use of the Special Committee of the Board of Directors of Gemini (in its capacity as such) in its consideration of the proposed share reclassification, and are not for the benefit of, and do not convey any rights or remedies for any holder of securities of Gemini or any other person. Centerview will not be responsible for and has not provided any tax, accounting, actuarial, legal or other specialist advice. These materials are not intended to provide the sole basis for evaluating the proposed transaction, and this presentation does not represent a fairness opinion, recommendation, valuation or opinion of any kind, and is necessarily incomplete and should be viewed solely in conjunction with the oral presentation provided by Centerview. 1
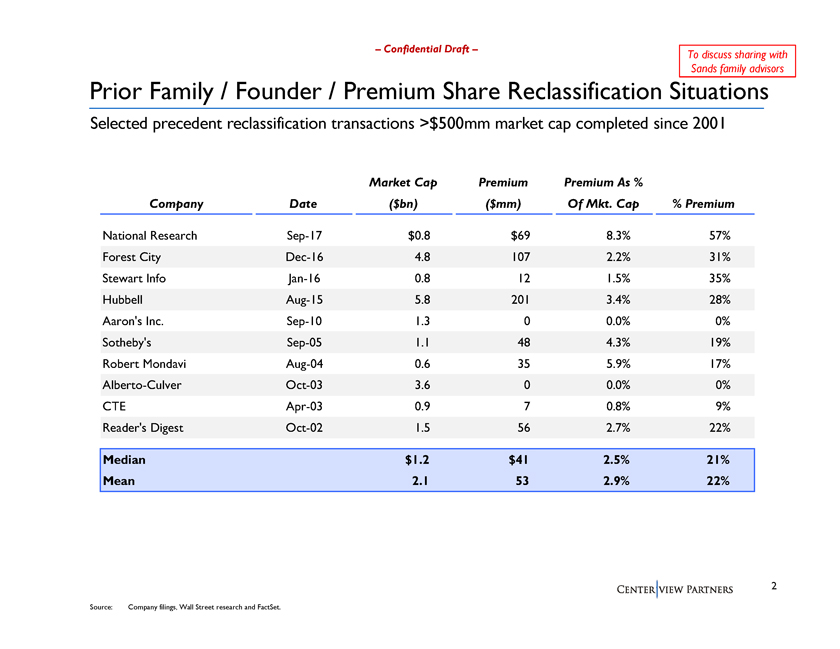
Confidential Draft To discuss sharing with Sands family advisors Prior Family / Founder / Premium Share Reclassification Situations Selected precedent reclassification transactions >$500mm market cap completed since 2001 Market Cap Premium Premium As % Company Date ($bn) ($mm) Of Mkt. Cap % Premium National Research Sep-17 $0.8 $69 8.3% 57% Forest City Dec-16 4.8 107 2.2% 31% Stewart Info Jan-16 0.8 12 1.5% 35% Hubbell Aug-15 5.8 201 3.4% 28% Aarons Inc. Sep-10 1.3 0 0.0% 0% Sothebys Sep-05 1.1 48 4.3% 19% Robert Mondavi Aug-04 0.6 35 5.9% 17% Alberto-Culver Oct-03 3.6 0 0.0% 0% CTE Apr-03 0.9 7 0.8% 9% Readers Digest Oct-02 1.5 56 2.7% 22% Median $1.2 $41 2.5% 21% Mean 2.1 53 2.9% 22% 2 Source: Company filings, Wall Street research and FactSet.
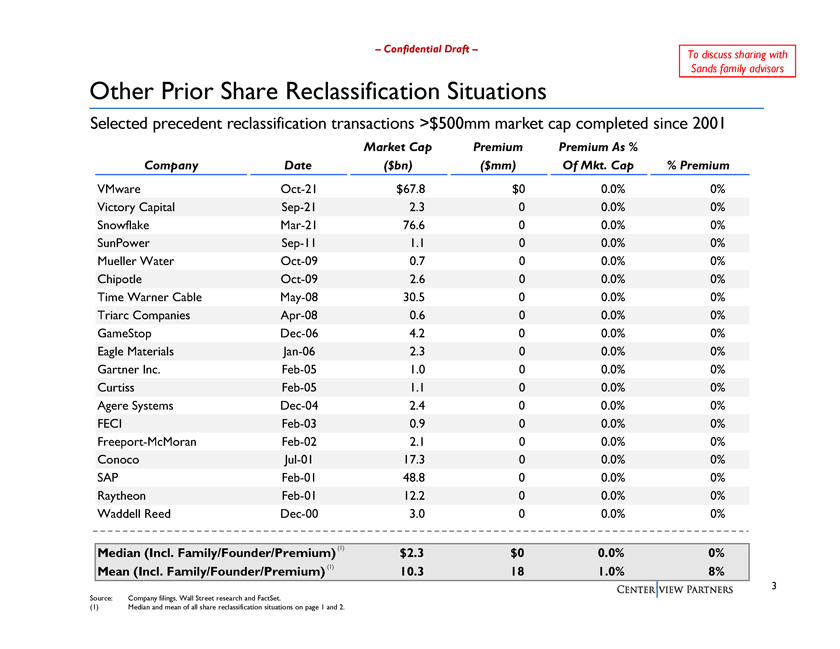
Confidential Draft To discuss sharing with Sands family advisors Other Prior Share Reclassification Situations Selected precedent reclassification transactions >$500mm market cap completed since 2001 Market Cap Premium Premium As % Company Date ($bn) ($mm) Of Mkt. Cap % Premium VMware Oct-21 $67.8 $0 0.0% 0% Victory Capital Sep-21 2.3 0 0.0% 0% Snowflake Mar-21 76.6 0 0.0% 0% SunPower Sep-11 1.1 0 0.0% 0% Mueller Water Oct-09 0.7 0 0.0% 0% Chipotle Oct-09 2.6 0 0.0% 0% Time Warner Cable May-08 30.5 0 0.0% 0% Triarc Companies Apr-08 0.6 0 0.0% 0% GameStop Dec-06 4.2 0 0.0% 0% Eagle Materials Jan-06 2.3 0 0.0% 0% Gartner Inc. Feb-05 1.0 0 0.0% 0% Curtiss Feb-05 1.1 0 0.0% 0% Agere Systems Dec-04 2.4 0 0.0% 0% FECI Feb-03 0.9 0 0.0% 0% Freeport-McMoran Feb-02 2.1 0 0.0% 0% Conoco Jul-01 17.3 0 0.0% 0% SAP Feb-01 48.8 0 0.0% 0% Raytheon Feb-01 12.2 0 0.0% 0% Waddell Reed Dec-00 3.0 0 0.0% 0% Median (Incl. Family/Founder/Premium)(1) $2.3 $0 0.0% 0% Mean (Incl. Family/Founder/Premium) (1) 10.3 18 1.0% 8% 3 Source: Company filings, Wall Street research and FactSet. (1) Median and mean of all share reclassification situations on page 1 and 2.
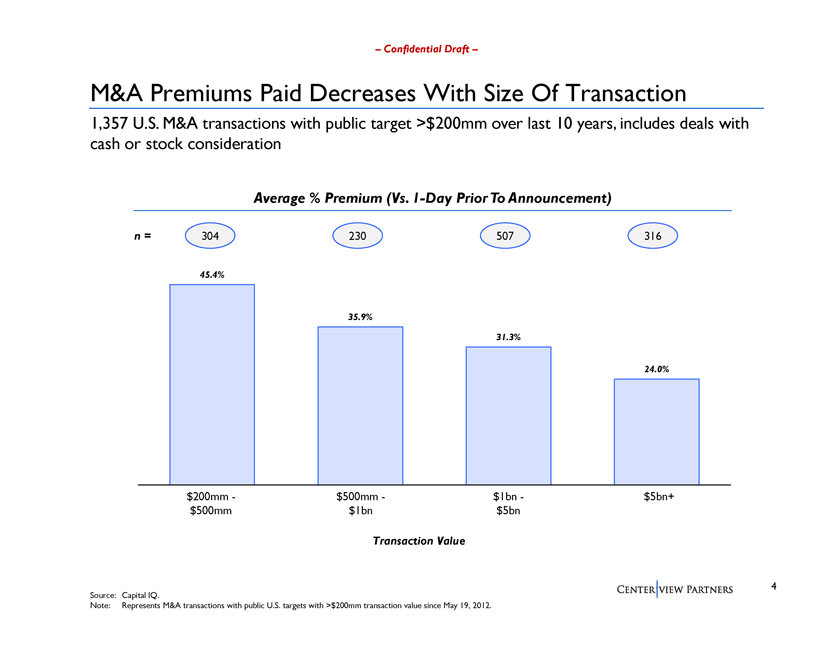
Confidential Draft M&A Premiums Paid Decreases With Size Of Transaction 1,357 U.S. M&A transactions with public target >$200mm over last 10 years, includes deals with cash or stock consideration Average % Premium (Vs. 1-Day Prior To Announcement) n = 304 230 507 316 45.4% 35.9% 31.3% 24.0% $200mm$500mm$1bn$5bn+ $500mm $1bn $5bn Transaction Value 4 Source: Capital IQ. Note: Represents M&A transactions with public U.S. targets with >$200mm transaction value since May 19, 2012.

Confidential Draft Gemini Class A Top 25 Institutional Shareholders L6M in Feedback Est. Average Estimated Rank Name Shares (mm) % Shares Value ($mm) Shares (mm) Received? Cost Basis Gain 1 Vanguard 12.0 6.4% $2,926 +0.1 $79.01 +209% 2 Capital World 9.2 4.9% 2,247 +2.4 207.57 +18% 3 State Street 7.1 3.8% 1,732 (0.0) 67.67 +261% 4 BlackRock Fund Advisors 6.6 3.5% 1,611 +0.1 71.00 +244% 5 Wellington 4.8 2.6% 1,182 (1.6) 177.67 +37% 6 Aristotle 3.7 2.0% 915 +3.7 227.30 +7% 7 J.P. Morgan 3.6 1.9% 874 +0.5 162.94 +50% 8 Harris 3.4 1.8% 818 (0.7) 171.77 +42% 9 AllianceBernstein 3.2 1.7% 784 +1.3 219.60 +11% 10 Geode 2.7 1.4% 648 +0.1 117.04 +109% 11 Janus Henderson 2.4 1.3% 579 +0.2 200.28 +22% 12 Morgan Stanley 1.9 1.0% 462 +0.3 170.88 +43% 13 American Century 1.8 1.0% 452 +0.1 130.92 +87% 14 Fidelity 1.7 0.9% 419 +0.9 212.27 +15% 15 T. Rowe Price 1.7 0.9% 403 +1.3 215.52 +13% 16 Voya 1.6 0.8% 380 (0.1) 181.65 +34% 17 Northern Trust 1.5 0.8% 376 (0.0) 51.36 +375% 18 Norges 1.5 0.8% 361 (0.4) 147.37 +66% 19 BlackRock Advisors 1.5 0.8% 357 +0.1 173.60 +41% 20 Neuberger Berman 1.4 0.8% 349 +1.2 225.77 +8% 21 Capital International 1.2 0.6% 286 +0.2 179.17 +36% 22 BlackRock Investment 1.1 0.6% 279 (0.1) 151.31 +61% 23 Amundi 1.0 0.5% 252 +0.3 222.59 +10% 24 Arrowstreet 1.0 0.5% 251 +0.2 225.24 +8% Current 25 RBC 1.0 0.5% 249 +0.1 215.96 +13% Share Price: Top 25 Institutional Class A Holders 78.6 41.8% $19,191 +10.2 $148.51(1) +64% $244.18 Top 25 Shareholders With Feedback (mm) 25.7 13.7% All Shareholders With Feedback (mm)(2) 28.0 14.9% Source: FactSet. 5 (1) Represents weighted average cost basis per share. (2) Includes shareholders below top 25 institutional shareholders that have provided feedback.

Confidential Draft Analysis At Various Potential Premiums Premium (%) Price 16.0% 17.0% 18.0% 19.0% 20.0% 21.0% 22.0% 23.0% 24.0% 25.0% 26.0% 27.0% 28.0% 29.0% 30.0% 32.0% 35.0% Share Price (6/1) $244.18 $283.25 $285.69 $288.13 $290.57 $293.02 $295.46 $297.90 $300.34 $302.78 $305.23 $307.67 $310.11 $312.55 $314.99 $317.43 $322.32 $329.64 Premium Per Share ($) 39.07 41.51 43.95 46.39 48.84 51.28 53.72 56.16 58.60 61.05 63.49 65.93 68.37 70.81 73.25 78.14 85.46 Current Share Price(1) $244.72 16.0% 17.0% 18.0% 19.0% 20.0% 21.0% 22.0% 22.9% 23.9% 24.9% 25.9% 26.9% 27.9% 28.9% 29.9% 31.9% 34.9% 10 Day VWAP(1) 240.91 16.2% 17.2% 18.2% 19.3% 20.3% 21.3% 22.3% 23.3% 24.3% 25.3% 26.4% 27.4% 28.4% 29.4% 30.4% 32.4% 35.5% 20 Day VWAP(1) 244.96 15.9% 16.9% 17.9% 18.9% 19.9% 20.9% 21.9% 22.9% 23.9% 24.9% 25.9% 26.9% 27.9% 28.9% 29.9% 31.9% 34.9% Unaffected Price(1) 233.71 16.7% 17.8% 18.8% 19.9% 20.9% 21.9% 23.0% 24.0% 25.1% 26.1% 27.2% 28.2% 29.3% 30.3% 31.3% 33.4% 36.6% Stated Premium ($mm) $907 $963 $1,020 $1,077 $1,133 $1,190 $1,247 $1,303 $1,360 $1,417 $1,473 $1,530 $1,587 $1,643 $1,700 $1,813 $1,983 Stated Prem % Mkt Cap 2.0% 2.1% 2.2% 2.3% 2.5% 2.6% 2.7% 2.8% 2.9% 3.1% 3.2% 3.3% 3.4% 3.6% 3.7% 3.9% 4.3% Net Of Comp Value(2) 1.4% 1.5% 1.6% 1.7% 1.9% 2.0% 2.1% 2.2% 2.3% 2.5% 2.6% 2.7% 2.8% 3.0% 3.1% 3.3% 3.7% Effective Premium ($mm) $797 $847 $896 $946 $996 $1,046 $1,096 $1,145 $1,195 $1,245 $1,295 $1,345 $1,394 $1,444 $1,494 $1,594 $1,743 Eff Prem % Mkt Cap 1.8% 1.9% 2.0% 2.1% 2.2% 2.3% 2.4% 2.5% 2.7% 2.8% 2.9% 3.0% 3.1% 3.2% 3.4% 3.6% 3.9% Net Of Comp Value(2) 1.2% 1.3% 1.4% 1.5% 1.6% 1.7% 1.8% 1.9% 2.1% 2.2% 2.3% 2.4% 2.5% 2.6% 2.7% 3.0% 3.3% P/E â^ To Breakeven(3) +0.3x +0.3x +0.3x +0.4x +0.4x +0.4x +0.4x +0.5x +0.5x +0.5x +0.6x +0.6x +0.6x +0.6x +0.7x +0.7x +0.8x Committee Proposals Sands Initial Sands Counterproposal Proposal Source: Company filings, Wall Street research, Bloomberg and FactSet. Note: U.S. Dollars in millions, except per share amounts. (1) Premiums calculated as cash premium indicated by current stock price divided by indicated VWAP. 6 (2) Based on illustrative compensation savings present value of $273mm, based on annual savings of $16.3mm tax affected at 20% and valued at Gemini current P/E multiple of 21.0x. (3) Based on illustrative 5% interest rate and 20% tax, assuming stated premium paid in cash financed by new debt. Includes illustrative annual compensation savings.