EXHIBIT (C)(4)
Published on August 1, 2022
Exhibit (c)(4)
Confidential Draft Project Gemini: Confidential Discussion Materials June 25, 2022
Confidential Draft Disclaimer This presentation has been prepared by Centerview Partners LLC (Centerview) for use solely by the Special Committee of the Board of Directors of Gemini in connection with its evaluation of a proposed share reclassification and for no other purpose. The information contained herein is based upon information supplied by or on behalf of Gemini and publicly available information, and portions of the information contained herein may be based upon statements, estimates and forecasts provided by Gemini. Centerview has relied upon the accuracy and completeness of the foregoing information, and has not assumed any responsibility for any independent verification of such information or for any independent evaluation or appraisal of any of the assets or liabilities (contingent or otherwise) of Gemini or any other entity, or concerning the solvency or fair value of Gemini or any other entity. With respect to financial forecasts, including with respect to estimates of potential synergies, Centerview has assumed that such forecasts have been reasonably prepared on bases reflecting the best currently available estimates and judgments of the managements of Gemini as to their respective future financial performances, and at your direction Centerview has relied upon such forecasts, as provided by Geminis management, with respect to both Gemini, including as to expected synergies. Centerview assumes no responsibility for and expresses no view as to such forecasts or the assumptions on which they are based. The information set forth herein is based upon economic, monetary, market and other conditions as in effect on, and the information made available to us as of, the date hereof, unless indicated otherwise and Centerview assumes no obligation to update or otherwise revise these materials. The financial analysis in this presentation is complex and is not necessarily susceptible to a partial analysis or summary description. In performingthis financial analysis, Centerview has considered the results of its analysis as a whole and did not necessarily attribute a particular weight to any particular portion of the analysis considered. Furthermore, selecting any portion of Centerviews analysis, without considering the analysis as a whole, wouldcreate an incomplete view of the process underlying its financial analysis. Centerview may have deemed various assumptions more or less probable than other assumptions, so the reference ranges resulting from any particular portion of the analysis described above should not be taken to be Centerviews view of the actual value of Gemini. These materials and the information contained herein are confidential, were not prepared with a view toward public disclosure, and may not be disclosed publicly or made available to third parties without the prior written consent of Centerview. These materials and any other advice, written or oral, rendered by Centerview are intended solely for the benefit and use of the Special Committee of the Board of Directors of Gemini (in its capacity as such) in its consideration of the proposed share reclassification, and are not for the benefit of, and do not convey any rights or remedies for any holder of securities of Gemini or any other person. Centerview will not be responsible for and has not provided any tax, accounting, actuarial, legal or other specialist advice. These materials are not intended to provide the sole basis for evaluating the proposed transaction, and this presentation does not represent a fairness opinion, recommendation, valuation or opinion of any kind, and is necessarily incomplete and should be viewed solely in conjunction with the oral presentation provided by Centerview. 1
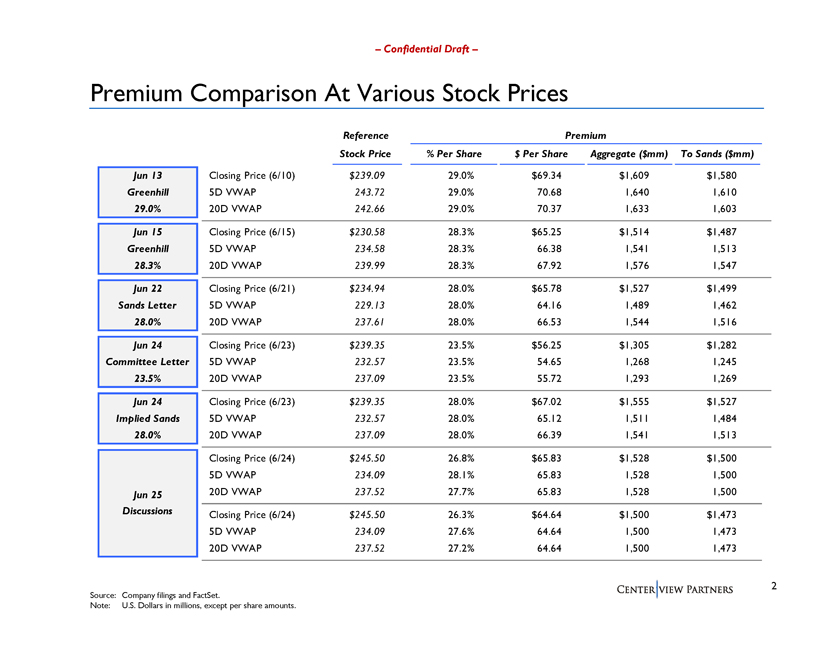
Confidential Draft Premium Comparison At Various Stock Prices Reference Premium Stock Price % Per Share $ Per Share Aggregate ($mm) To Sands ($mm) Jun 13 Closing Price (6/10) $239.09 29.0% $69.34 $1,609 $1,580 Greenhill 5D VWAP 243.72 29.0% 70.68 1,640 1,610 29.0% 20D VWAP 242.66 29.0% 70.37 1,633 1,603 Jun 15 Closing Price (6/15) $230.58 28.3% $65.25 $1,514 $1,487 Greenhill 5D VWAP 234.58 28.3% 66.38 1,541 1,513 28.3% 20D VWAP 239.99 28.3% 67.92 1,576 1,547 Jun 22 Closing Price (6/21) $234.94 28.0% $65.78 $1,527 $1,499 Sands Letter 5D VWAP 229.13 28.0% 64.16 1,489 1,462 28.0% 20D VWAP 237.61 28.0% 66.53 1,544 1,516 Jun 24 Closing Price (6/23) $239.35 23.5% $56.25 $1,305 $1,282 Committee Letter 5D VWAP 232.57 23.5% 54.65 1,268 1,245 23.5% 20D VWAP 237.09 23.5% 55.72 1,293 1,269 Jun 24 Closing Price (6/23) $239.35 28.0% $67.02 $1,555 $1,527 Implied Sands 5D VWAP 232.57 28.0% 65.12 1,511 1,484 28.0% 20D VWAP 237.09 28.0% 66.39 1,541 1,513 Closing Price (6/24) $245.50 26.8% $65.83 $1,528 $1,500 5D VWAP 234.09 28.1% 65.83 1,528 1,500 Jun 25 20D VWAP 237.52 27.7% 65.83 1,528 1,500 Discussions Closing Price (6/24) $245.50 26.3% $64.64 $1,500 $1,473 5D VWAP 234.09 27.6% 64.64 1,500 1,473 20D VWAP 237.52 27.2% 64.64 1,500 1,473 2 Source: Company filings and FactSet. Note: U.S. Dollars in millions, except per share amounts.
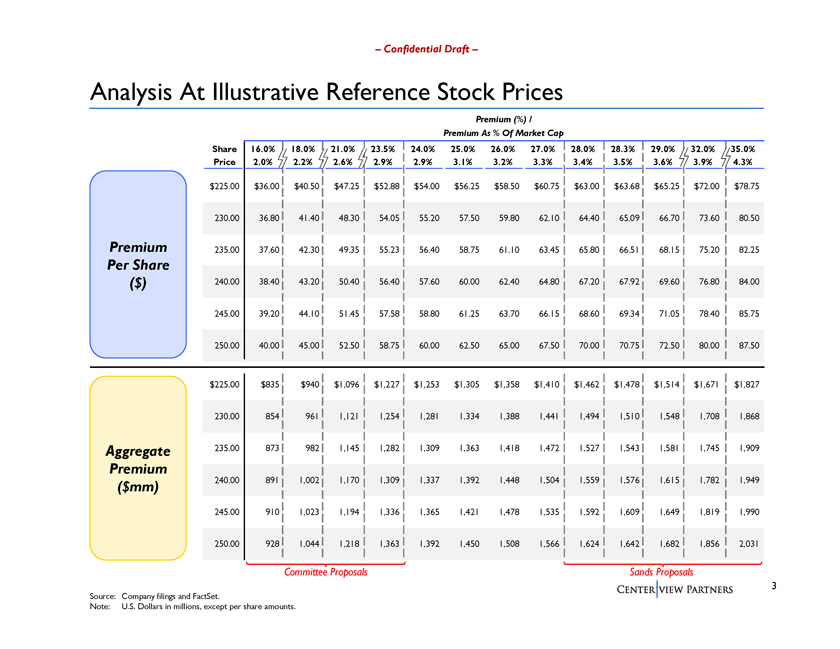
Confidential Draft Analysis At Illustrative Reference Stock Prices Premium (%) / Premium As % Of Market Cap Share 16.0% 18.0% 21.0% 23.5% 24.0% 25.0% 26.0% 27.0% 28.0% 28.3% 29.0% 32.0% 35.0% Price 2.0%2.2% 2.6%2.9%2.9% 3.1%3.2% 3.3%3.4%3.5% 3.6%3.9% 4.3% $225.00 $36.00 $40.50 $47.25 $52.88 $54.00 $56.25 $58.50 $60.75 $63.00 $63.68 $65.25 $72.00 $78.75 230.00 36.80 41.40 48.30 54.05 55.20 57.50 59.80 62.10 64.40 65.09 66.70 73.60 80.50 Premium 235.00 37.60 42.30 49.35 55.23 56.40 58.75 61.10 63.45 65.80 66.51 68.15 75.20 82.25 Per Share ($) 240.00 38.40 43.20 50.40 56.40 57.60 60.00 62.40 64.80 67.20 67.92 69.60 76.80 84.00 245.00 39.20 44.10 51.45 57.58 58.80 61.25 63.70 66.15 68.60 69.34 71.05 78.40 85.75 250.00 40.00 45.00 52.50 58.75 60.00 62.50 65.00 67.50 70.00 70.75 72.50 80.00 87.50 $225.00 $835 $940 $1,096 $1,227 $1,253 $1,305 $1,358 $1,410 $1,462 $1,478 $1,514 $1,671 $1,827 230.00 854 961 1,121 1,254 1,281 1,334 1,388 1,441 1,494 1,510 1,548 1,708 1,868 Aggregate 235.00 873 982 1,145 1,282 1,309 1,363 1,418 1,472 1,527 1,543 1,581 1,745 1,909 Premium ($mm) 240.00 891 1,002 1,170 1,309 1,337 1,392 1,448 1,504 1,559 1,576 1,615 1,782 1,949 245.00 910 1,023 1,194 1,336 1,365 1,421 1,478 1,535 1,592 1,609 1,649 1,819 1,990 250.00 928 1,044 1,218 1,363 1,392 1,450 1,508 1,566 1,624 1,642 1,682 1,856 2,031 Committee Proposals Sands Proposals 3 Source: Company filings and FactSet. Note: U.S. Dollars in millions, except per share amounts.