EXHIBIT (C)(6)
Published on August 1, 2022
Exhibit (c)(6)
Confidential Draft Project Gemini: Confidential Discussion Materials June 17, 2022
Confidential Draft Disclaimer This presentation has been prepared by Centerview Partners LLC (Centerview) for use solely by the Special Committee of the Board of Directors of Gemini in connection with its evaluation of a proposed share reclassification and for no other purpose. The information contained herein is based upon information supplied by or on behalf of Gemini and publicly available information, and portions of the information contained herein may be based upon statements, estimates and forecasts provided by Gemini. Centerview has relied upon the accuracy and completeness of the foregoing information, and has not assumed any responsibility for any independent verification of such information or for any independent evaluation or appraisal of any of the assets or liabilities (contingent or otherwise) of Gemini or any other entity, or concerning the solvency or fair value of Gemini or any other entity. With respect to financial forecasts, including with respect to estimates of potential synergies, Centerview has assumed that such forecasts have been reasonably prepared on bases reflecting the best currently available estimates and judgments of the managements of Gemini as to their respective future financial performances, and at your direction Centerview has relied upon such forecasts, as provided by Geminis management, with respect to both Gemini, including as to expected synergies. Centerview assumes no responsibility for and expresses no view as to such forecasts or the assumptions on which they are based. The information set forth herein is based upon economic, monetary, market and other conditions as in effect on, and the information made available to us as of, the date hereof, unless indicated otherwise and Centerview assumes no obligation to update or otherwise revise these materials. The financial analysis in this presentation is complex and is not necessarily susceptible to a partial analysis or summary description. In performingthis financial analysis, Centerview has considered the results of its analysis as a whole and did not necessarily attribute a particular weight to any particular portion of the analysis considered. Furthermore, selecting any portion of Centerviews analysis, without considering the analysis as a whole, wouldcreate an incomplete view of the process underlying its financial analysis. Centerview may have deemed various assumptions more or less probable than other assumptions, so the reference ranges resulting from any particular portion of the analysis described above should not be taken to be Centerviews view of the actual value of Gemini. These materials and the information contained herein are confidential, were not prepared with a view toward public disclosure, and may not be disclosed publicly or made available to third parties without the prior written consent of Centerview. These materials and any other advice, written or oral, rendered by Centerview are intended solely for the benefit and use of the Special Committee of the Board of Directors of Gemini (in its capacity as such) in its consideration of the proposed share reclassification, and are not for the benefit of, and do not convey any rights or remedies for any holder of securities of Gemini or any other person. Centerview will not be responsible for and has not provided any tax, accounting, actuarial, legal or other specialist advice. These materials are not intended to provide the sole basis for evaluating the proposed transaction, and this presentation does not represent a fairness opinion, recommendation, valuation or opinion of any kind, and is necessarily incomplete and should be viewed solely in conjunction with the oral presentation provided by Centerview. 1
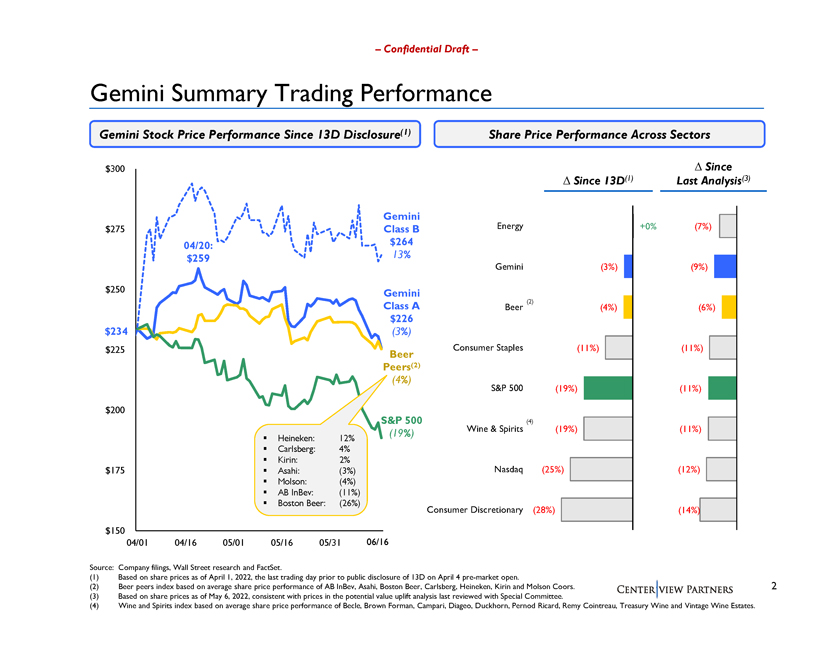
Confidential Draft Gemini Summary Trading Performance Gemini Stock Price Performance Since 13D Disclosure(1) Share Price Performance Across Sectors $300 Since Since 13D(1) Last Analysis(3) Gemini Energy $275 Class B +0% (7%) 04/20: $264 $259 13% Gemini (3%) (9%) $250 Gemini Class A (2) Beer (4%) (6%) $226 $234 (3%) $225 Consumer Staples (11%) (11%) Beer Peers(2) (4%) S&P 500 (19%) (11%) $200 S&P 500 (4) (19%) Wine & Spirits (19%) (11%) Heineken: 12% Carlsberg: 4% Kirin: 2% $175 Asahi: (3%) Nasdaq (25%) (12%) Molson: (4%) AB InBev: (11%) Boston Beer: (26%) Consumer Discretionary (28%) (14%) $150 04/01 04/16 05/01 05/16 05/31 06/16 Source: Company filings, Wall Street research and FactSet. (1) Based on share prices as of April 1, 2022, the last trading day prior to public disclosure of 13D on April 4 pre-market open. (2) Beer peers index based on average share price performance of AB InBev, Asahi, Boston Beer, Carlsberg, Heineken, Kirin and Molson Coors. 2 (3) Based on share prices as of May 6, 2022, consistent with prices in the potential value uplift analysis last reviewed with Special Committee. (4) Wine and Spirits index based on average share price performance of Becle, Brown Forman, Campari, Diageo, Duckhorn, Pernod Ricard, Remy Cointreau, Treasury Wine and Vintage Wine Estates.
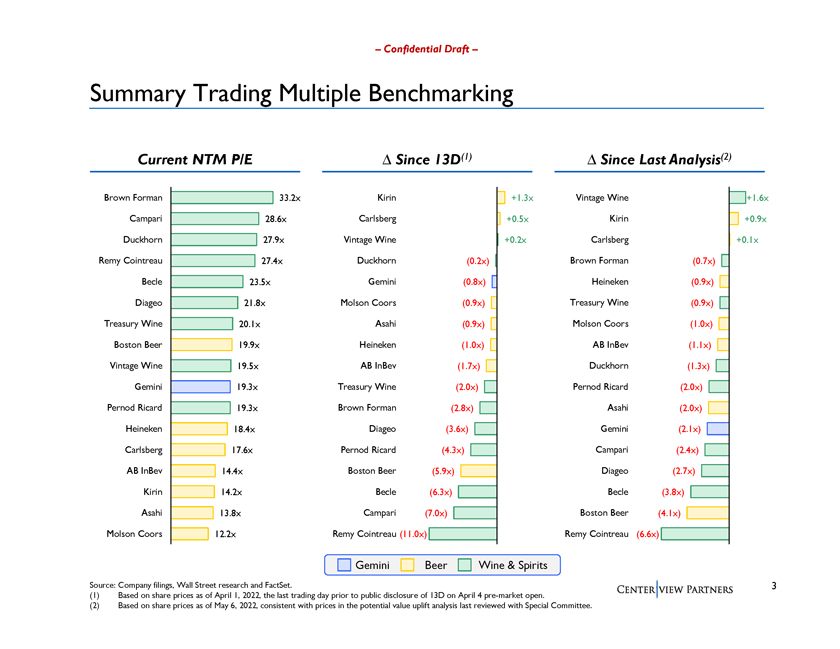
Confidential Draft Summary Trading Multiple Benchmarking Current NTM P/E â^ Since 13D(1) â^ Since Last Analysis(2) Brown Forman 33.2x Kirin +1.3x Vintage Wine +1.6x Campari 28.6x Carlsberg +0.5x Kirin +0.9x Duckhorn 27.9x Vintage Wine +0.2x Carlsberg +0.1x Remy Cointreau 27.4x Duckhorn (0.2x) Brown Forman (0.7x) Becle 23.5x Gemini (0.8x) Heineken (0.9x) Diageo 21.8x Molson Coors (0.9x) Treasury Wine (0.9x) Treasury Wine 20.1x Asahi (0.9x) Molson Coors (1.0x) Boston Beer 19.9x Heineken (1.0x) AB InBev (1.1x) Vintage Wine 19.5x AB InBev (1.7x) Duckhorn (1.3x) Gemini 19.3x Treasury Wine (2.0x) Pernod Ricard (2.0x) Pernod Ricard 19.3x Brown Forman (2.8x) Asahi (2.0x) Heineken 18.4x Diageo (3.6x) Gemini (2.1x) Carlsberg 17.6x Pernod Ricard (4.3x) Campari (2.4x) AB InBev 14.4x Boston Beer (5.9x) Diageo (2.7x) Kirin 14.2x Becle (6.3x) Becle (3.8x) Asahi 13.8x Campari (7.0x) Boston Beer (4.1x) Molson Coors 12.2x Remy Cointreau (11.0x) Remy Cointreau (6.6x) Gemini Beer Wine & Spirits Source: Company filings, Wall Street research and FactSet. 3 (1) Based on share prices as of April 1, 2022, the last trading day prior to public disclosure of 13D on April 4 pre-market open. (2) Based on share prices as of May 6, 2022, consistent with prices in the potential value uplift analysis last reviewed with Special Committee.
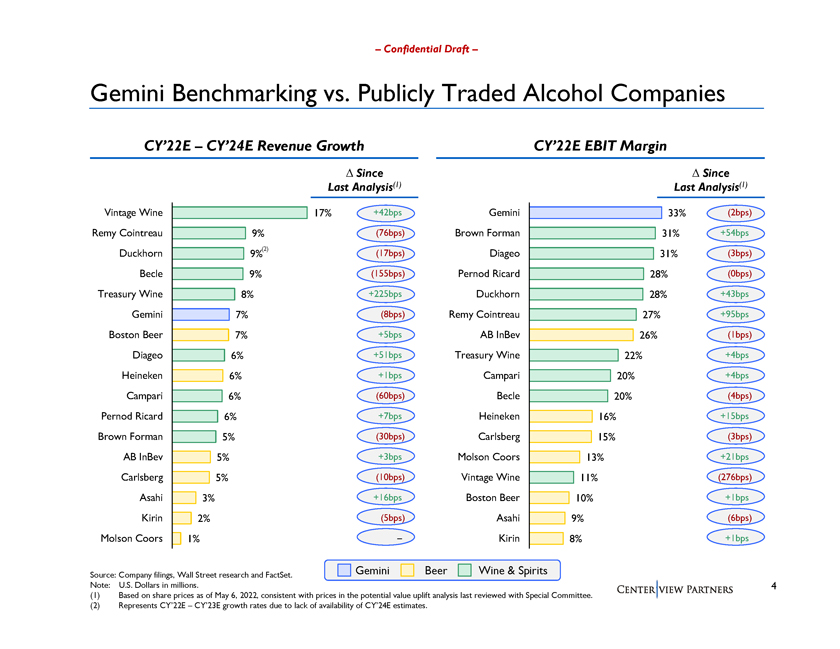
Confidential Draft Gemini Benchmarking vs. Publicly Traded Alcohol Companies CY22E CY24E Revenue Growth CY22E EBIT Margin Since Since Last Analysis(1) Last Analysis(1) Vintage Wine 17% +42bps Gemini 33% (2bps) Remy Cointreau 9% (76bps) Brown Forman 31% +54bps Duckhorn 9%(2) (17bps) Diageo 31% (3bps) Becle 9% (155bps) Pernod Ricard 28% (0bps) Treasury Wine 8% +225bps Duckhorn 28% +43bps Gemini 7% (8bps) Remy Cointreau 27% +95bps Boston Beer 7% +5bps AB InBev 26% (1bps) Diageo 6% +51bps Treasury Wine 22% +4bps Heineken 6% +1bps Campari 20% +4bps Campari 6% (60bps) Becle 20% (4bps) Pernod Ricard 6% +7bps Heineken 16% +15bps Brown Forman 5% (30bps) Carlsberg 15% (3bps) AB InBev 5% +3bps Molson Coors 13% +21bps Carlsberg 5% (10bps) Vintage Wine 11% (276bps) Asahi 3% +16bps Boston Beer 10% +1bps Kirin 2% (5bps) Asahi 9% (6bps) Molson Coors 1% Kirin 8% +1bps Source: Company filings, Wall Street research and FactSet. Gemini Beer Wine & Spirits Note: U.S. Dollars in millions. 4 (1) Based on share prices as of May 6, 2022, consistent with prices in the potential value uplift analysis last reviewed with Special Committee. (2) Represents CY22E CY23E growth rates due to lack of availability of CY24E estimates.
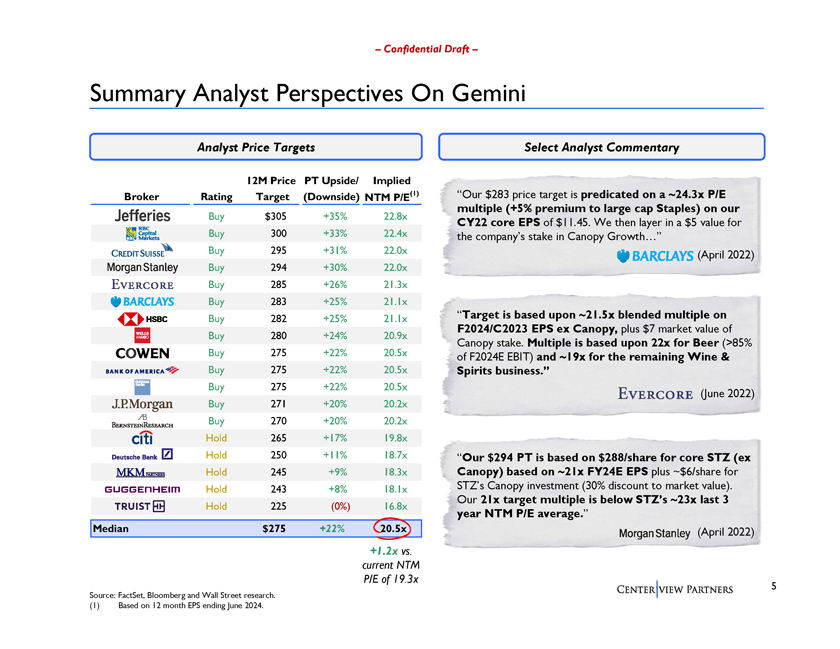
Confidential Draft Summary Analyst Perspectives On Gemini Analyst Price Targets Select Analyst Commentary 12M Price PT Upside/ Implied Broker Rating Target (Downside) NTM P/E(1) Our $283 price target is predicated on a ~24.3x P/E multiple (+5% premium to large cap Staples) on our Buy $305 +35% 22.8x CY22 core EPS of $11.45. We then layer in a $5 value for Buy 300 +33% 22.4x the companys stake in Canopy Growth Buy 295 +31% 22.0x (April 2022) Buy 294 +30% 22.0x Buy 285 +26% 21.3x Buy 283 +25% 21.1x Buy 282 +25% 21.1x Target is based upon ~21.5x blended multiple on F2024/C2023 EPS ex Canopy, plus $7 market value of Buy 280 +24% 20.9x Buy 275 +22% 20.5x Canopy stake. Multiple is based upon 22x for Beer (>85% of F2024E EBIT) and ~19x for the remaining Wine & Buy 275 +22% 20.5x Spirits business. Buy 275 +22% 20.5x (June 2022) Buy 271 +20% 20.2x Buy 270 +20% 20.2x Hold 265 +17% 19.8x Hold 250 +11% 18.7x Our $294 PT is based on $288/share for core STZ (ex Hold 245 +9% 18.3x Canopy) based on ~21x FY24E EPS plus ~$6/share for Hold 243 +8% 18.1x STZs Canopy investment (30% discount to market value). Our 21x target multiple is below STZs ~23x last 3 Hold 225 (0%) 16.8x year NTM P/E average. Median $275 +22% 20.5x (April 2022) +1.2x vs. current NTM P/E of 19.3x 5 Source: FactSet, Bloomberg and Wall Street research. (1) Based on 12 month EPS ending June 2024.
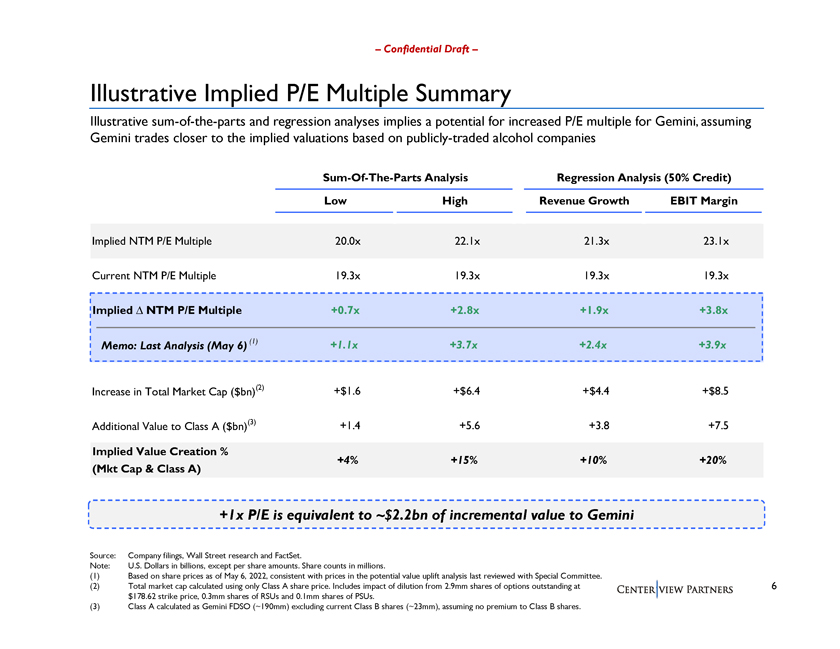
Confidential Draft Illustrative Implied P/E Multiple Summary Illustrative sum-of-the-parts and regression analyses implies a potential for increased P/E multiple for Gemini, assuming Gemini trades closer to the implied valuations based on publicly-traded alcohol companies Sum-Of-The-Parts Analysis Regression Analysis (50% Credit) Low High Revenue Growth EBIT Margin Implied NTM P/E Multiple 20.0x 22.1x 21.3x 23.1x Current NTM P/E Multiple 19.3x 19.3x 19.3x 19.3x Implied NTM P/E Multiple +0.7x +2.8x +1.9x +3.8x Memo: Last Analysis (May 6) (1) +1.1x +3.7x +2.4x +3.9x Increase in Total Market Cap ($bn)(2) +$1.6 +$6.4 +$4.4 +$8.5 Additional Value to Class A ($bn)(3) +1.4 +5.6 +3.8 +7.5 Implied Value Creation % +4% +15% +10% +20% (Mkt Cap & Class A) +1x P/E is equivalent to ~$2.2bn of incremental value to Gemini Source: Company filings, Wall Street research and FactSet. Note: U.S. Dollars in billions, except per share amounts. Share counts in millions. (1) Based on share prices as of May 6, 2022, consistent with prices in the potential value uplift analysis last reviewed with Special Committee. (2) Total market cap calculated using only Class A share price. Includes impact of dilution from 2.9mm shares of options outstanding at 6 $178.62 strike price, 0.3mm shares of RSUs and 0.1mm shares of PSUs. (3) Class A calculated as Gemini FDSO (~190mm) excluding current Class B shares (~23mm), assuming no premium to Class B shares.
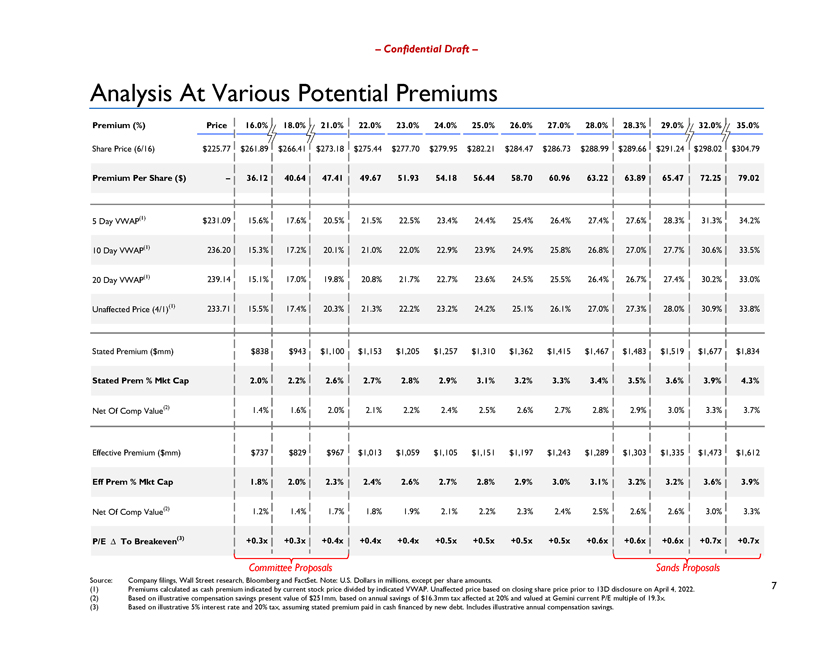
Confidential Draft Analysis At Various Potential Premiums Premium (%) Price 16.0% 18.0% 21.0% 22.0% 23.0% 24.0% 25.0% 26.0% 27.0% 28.0% 28.3% 29.0% 32.0% 35.0% Share Price (6/16) $225.77 $261.89 $266.41 $273.18 $275.44 $277.70 $279.95 $282.21 $284.47 $286.73 $288.99 $289.66 $291.24 $298.02 $304.79 Premium Per Share ($) 36.12 40.64 47.41 49.67 51.93 54.18 56.44 58.70 60.96 63.22 63.89 65.47 72.25 79.02 5 Day VWAP(1) $231.09 15.6% 17.6% 20.5% 21.5% 22.5% 23.4% 24.4% 25.4% 26.4% 27.4% 27.6% 28.3% 31.3% 34.2% 10 Day VWAP(1) 236.20 15.3% 17.2% 20.1% 21.0% 22.0% 22.9% 23.9% 24.9% 25.8% 26.8% 27.0% 27.7% 30.6% 33.5% 20 Day VWAP(1) 239.14 15.1% 17.0% 19.8% 20.8% 21.7% 22.7% 23.6% 24.5% 25.5% 26.4% 26.7% 27.4% 30.2% 33.0% Unaffected Price (4/1)(1) 233.71 15.5% 17.4% 20.3% 21.3% 22.2% 23.2% 24.2% 25.1% 26.1% 27.0% 27.3% 28.0% 30.9% 33.8% Stated Premium ($mm) $838 $943 $1,100 $1,153 $1,205 $1,257 $1,310 $1,362 $1,415 $1,467 $1,483 $1,519 $1,677 $1,834 Stated Prem % Mkt Cap 2.0% 2.2% 2.6% 2.7% 2.8% 2.9% 3.1% 3.2% 3.3% 3.4% 3.5% 3.6% 3.9% 4.3% Net Of Comp Value(2) 1.4% 1.6% 2.0% 2.1% 2.2% 2.4% 2.5% 2.6% 2.7% 2.8% 2.9% 3.0% 3.3% 3.7% Effective Premium ($mm) $737 $829 $967 $1,013 $1,059 $1,105 $1,151 $1,197 $1,243 $1,289 $1,303 $1,335 $1,473 $1,612 Eff Prem % Mkt Cap 1.8% 2.0% 2.3% 2.4% 2.6% 2.7% 2.8% 2.9% 3.0% 3.1% 3.2% 3.2% 3.6% 3.9% Net Of Comp Value(2) 1.2% 1.4% 1.7% 1.8% 1.9% 2.1% 2.2% 2.3% 2.4% 2.5% 2.6% 2.6% 3.0% 3.3% P/E To Breakeven(3) +0.3x +0.3x +0.4x +0.4x +0.4x +0.5x +0.5x +0.5x +0.5x +0.6x +0.6x +0.6x +0.7x +0.7x Committee Proposals Sands Proposals Source: Company filings, Wall Street research, Bloomberg and FactSet. Note: U.S. Dollars in millions, except per share amounts. (1) Premiums calculated as cash premium indicated by current stock price divided by indicated VWAP. Unaffected price based on closing share price prior to 13D disclosure on April 4, 2022. 7 (2) Based on illustrative compensation savings present value of $251mm, based on annual savings of $16.3mm tax affected at 20% and valued at Gemini current P/E multiple of 19.3x. (3) Based on illustrative 5% interest rate and 20% tax, assuming stated premium paid in cash financed by new debt. Includes illustrative annual compensation savings.
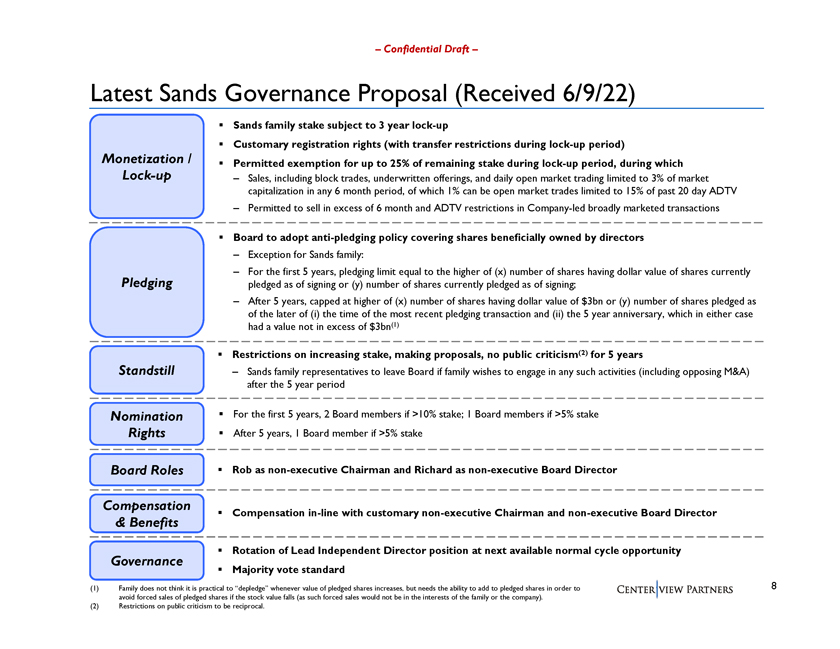
Confidential Draft Latest Sands Governance Proposal (Received 6/9/22) ï,§ Sands family stake subject to 3 year lock-up Customary registration rights (with transfer restrictions during lock-up period) Monetization / Permitted exemption for up to 25% of remaining stake during lock-up period, during which Lock-up Sales, including block trades, underwritten offerings, and daily open market trading limited to 3% of market capitalization in any 6 month period, of which 1% can be open market trades limited to 15% of past 20 day ADTV Permitted to sell in excess of 6 month and ADTV restrictions in Company-led broadly marketed transactions Board to adopt anti-pledging policy covering shares beneficially owned by directors Exception for Sands family: For the first 5 years, pledging limit equal to the higher of (x) number of shares having dollar value of shares currently Pledging pledged as of signing or (y) number of shares currently pledged as of signing; After 5 years, capped at higher of (x) number of shares having dollar value of $3bn or (y) number of shares pledged as of the later of (i) the time of the most recent pledging transaction and (ii) the 5 year anniversary, which in either case had a value not in excess of $3bn(1) Restrictions on increasing stake, making proposals, no public criticism(2) for 5 years Standstill Sands family representatives to leave Board if family wishes to engage in any such activities (including opposing M&A) after the 5 year period Nomination ï,§ For the first 5 years, 2 Board members if >10% stake; 1 Board members if >5% stake Rightsï,§ After 5 years, 1 Board member if >5% stake Board Rolesï,§ Rob as non-executive Chairman and Richard as non-executive Board Director Compensation Compensation in-line with customary non-executive Chairman and non-executive Board Director & Benefits Rotation of Lead Independent Director position at next available normal cycle opportunity Governance ï,§ Majority vote standard (1) Family does not think it is practical to depledge whenever value of pledged shares increases, but needs the ability to add to pledged shares in order to 8 avoid forced sales of pledged shares if the stock value falls (as such forced sales would not be in the interests of the family or the company). (2) Restrictions on public criticism to be reciprocal.
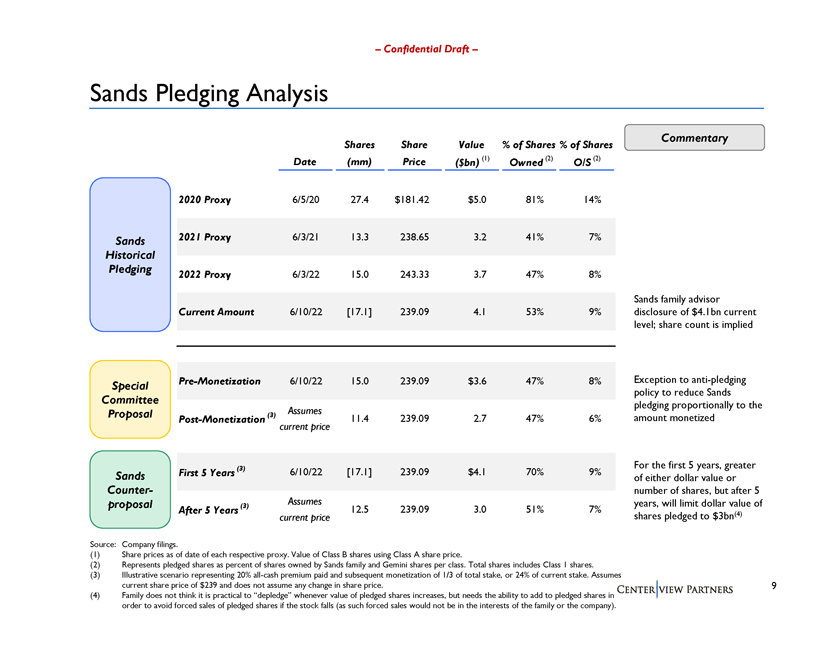
Confidential Draft Sands Pledging Analysis Commentary Shares Share Value % of Shares % of Shares Date (mm) Price ($bn) (1) Owned (2) O/S (2) 2020 Proxy 6/5/20 27.4 $181.42 $5.0 81% 14% Sands 2021 Proxy 6/3/21 13.3 238.65 3.2 41% 7% Historical Pledging 2022 Proxy 6/3/22 15.0 243.33 3.7 47% 8% Sands family advisor Current Amount 6/10/22 [17.1] 239.09 4.1 53% 9% disclosure of $4.1bn current level; share count is implied Pre-Monetization 6/10/22 15.0 239.09 $3.6 47% 8% Exception to anti-pledging Special policy to reduce Sands Committee pledging proportionally to the Assumes Proposal Post-Monetization (3) 11.4 239.09 2.7 47% 6% amount monetized current price (3) For the first 5 years, greater Sands First 5 Years 6/10/22 [17.1] 239.09 $4.1 70% 9% of either dollar value or Counter- number of shares, but after 5 proposal Assumes years, will limit dollar value of After 5 Years (3) 12.5 239.09 3.0 51% 7% current price shares pledged to $3bn(4) Source: Company filings. (1) Share prices as of date of each respective proxy. Value of Class B shares using Class A share price. (2) Represents pledged shares as percent of shares owned by Sands family and Gemini shares per class. Total shares includes Class 1 shares. (3) Illustrative scenario representing 20% all-cash premium paid and subsequent monetization of 1/3 of total stake, or 24% of current stake. Assumes current share price of $239 and does not assume any change in share price. 9 (4) Family does not think it is practical to depledge whenever value of pledged shares increases, but needs the ability to add to pledged shares in order to avoid forced sales of pledged shares if the stock falls (as such forced sales would not be in the interests of the family or the company).
Appendix
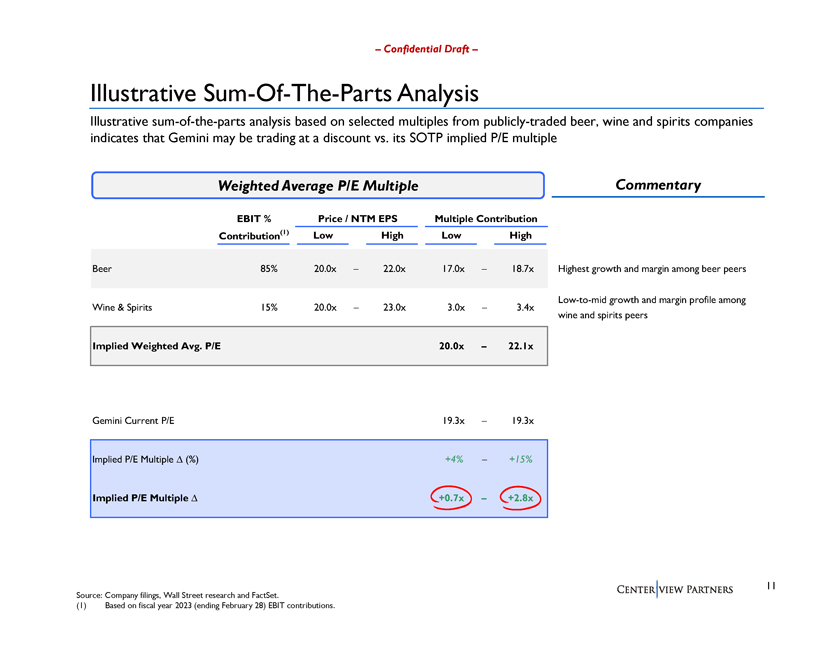
Confidential Draft Illustrative Sum-Of-The-Parts Analysis Illustrative sum-of-the-parts analysis based on selected multiples from publicly-traded beer, wine and spirits companies indicates that Gemini may be trading at a discount vs. its SOTP implied P/E multiple Weighted Average P/E Multiple Commentary EBIT % Price / NTM EPS Multiple Contribution Contribution(1) Low High Low High Beer 85% 20.0x 22.0x 17.0x 18.7x Highest growth and margin among beer peers Low-to-mid growth and margin profile among Wine & Spirits 15% 20.0x 23.0x 3.0x 3.4x wine and spirits peers Implied Weighted Avg. P/E 20.0x 22.1x Gemini Current P/E 19.3x 19.3x Implied P/E Multiple â^ (%) +4% +15% Implied P/E Multiple â^ +0.7x +2.8x 11 Source: Company filings, Wall Street research and FactSet. (1) Based on fiscal year 2023 (ending February 28) EBIT contributions.
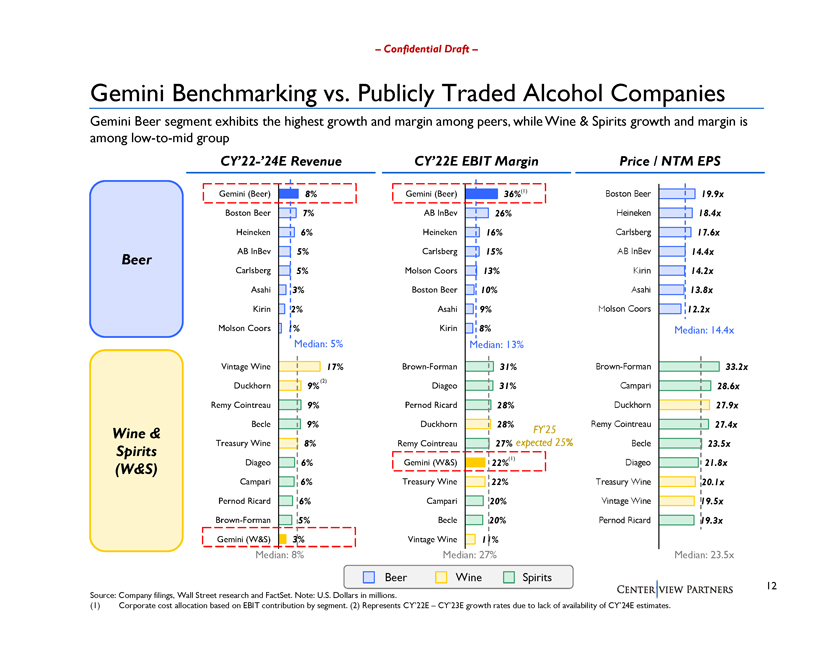
Confidential Draft Gemini Benchmarking vs. Publicly Traded Alcohol Companies Gemini Beer segment exhibits the highest growth and margin among peers, while Wine & Spirits growth and margin is among low-to-mid group CY22-24E Revenue CY22E EBIT Margin Price / NTM EPS Gemini (Beer) 8% Gemini (Beer) 36%(1) Boston Beer 19.9x Boston Beer 7% AB InBev 26% Heineken 18.4x Heineken 6% Heineken 16% Carlsberg 17.6x AB InBev 5% Carlsberg 15% AB InBev 14.4x Beer Carlsberg 5% Molson Coors 13% Kirin 14.2x Asahi 3% Boston Beer 10% Asahi 13.8x Kirin 2% Asahi 9% Molson Coors 12.2x Molson Coors 1% Kirin 8% Median: 14.4x Median: 5% Median: 13% Vintage Wine 17% Brown-Forman 31% Brown-Forman 33.2x (2) Duckhorn 9% Diageo 31% Campari 28.6x Remy Cointreau 9% Pernod Ricard 28% Duckhorn 27.9x Becle 9% Duckhorn 28% Remy Cointreau 27.4x Wine & FY25 Treasury Wine 8% Remy Cointreau 27% expected 25% Becle 23.5x Spirits (W&S) Diageo 6% Gemini (W&S) 22%(1) Diageo 21.8x Campari 6% Treasury Wine 22% Treasury Wine 20.1x Pernod Ricard 6% Campari 20% Vintage Wine 19.5x Brown-Forman 5% Becle 20% Pernod Ricard 19.3x Gemini (W&S) 3% Vintage Wine 11% Median: 8% Median: 27% Median: 23.5x Beer Wine Spirits 12 Source: Company filings, Wall Street research and FactSet. Note: U.S. Dollars in millions. (1) Corporate cost allocation based on EBIT contribution by segment. (2) Represents CY22E CY23E growth rates due to lack of availability of CY24E estimates.
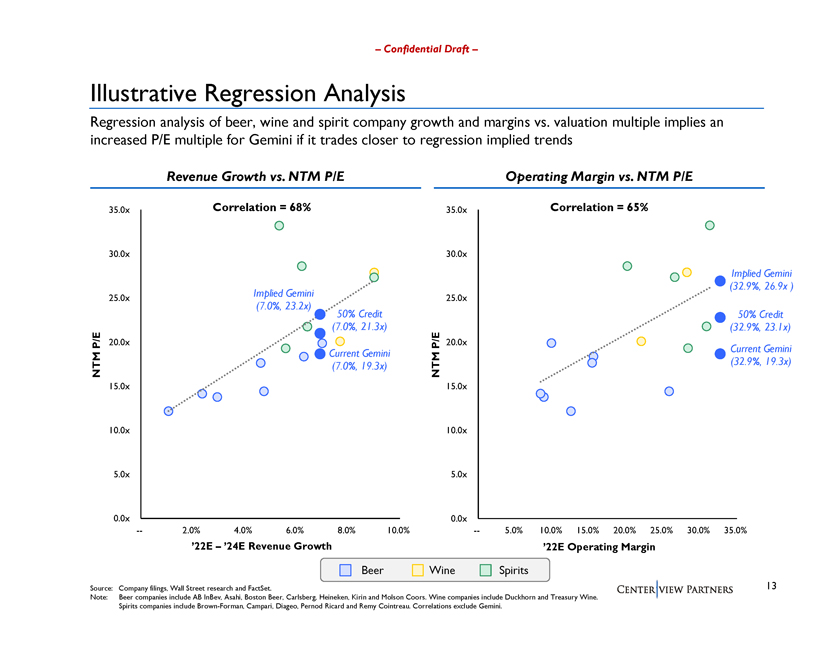
Confidential Draft Illustrative Regression Analysis Regression analysis of beer, wine and spirit company growth and margins vs. valuation multiple implies an increased P/E multiple for Gemini if it trades closer to regression implied trends Revenue Growth vs. NTM P/E Operating Margin vs. NTM P/E 35.0x Correlation = 68% 35.0x Correlation = 65% 30.0x 30.0x Implied Gemini (32.9%, 26.9x ) 25.0x Implied Gemini 25.0x (7.0%, 23.2x) 50% Credit 50% Credit (7.0%, 21.3x) (32.9%, 23.1x) P/E 20.0x P/E 20.0x Current Gemini Current Gemini NTM (7.0%, 19.3x) NTM (32.9%, 19.3x) 15.0x 15.0x 10.0x 10.0x 5.0x 5.0x 0.0x 0.0x 2.0% 4.0% 6.0% 8.0% 10.0% 5.0% 10.0% 15.0% 20.0% 25.0% 30.0% 35.0% 22E 24E Revenue Growth 22E Operating Margin Beer Wine Spirits Source: Company filings, Wall Street research and FactSet. 13 Note: Beer companies include AB InBev, Asahi, Boston Beer, Carlsberg, Heineken, Kirin and Molson Coors. Wine companies include Duckhorn and Treasury Wine. Spirits companies include Brown-Forman, Campari, Diageo, Pernod Ricard and Remy Cointreau. Correlations exclude Gemini.
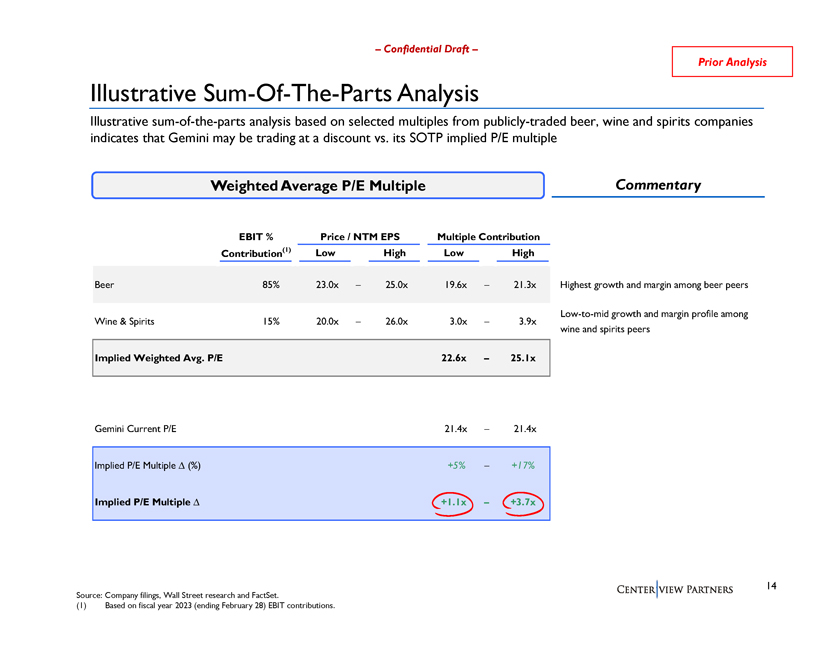
Confidential Draft Prior Analysis Illustrative Sum-Of-The-Parts Analysis Illustrative sum-of-the-parts analysis based on selected multiples from publicly-traded beer, wine and spirits companies indicates that Gemini may be trading at a discount vs. its SOTP implied P/E multiple Weighted Average P/E Multiple Commentary EBIT % Price / NTM EPS Multiple Contribution Contribution(1) Low High Low High Beer 85% 23.0x 25.0x 19.6x 21.3x Highest growth and margin among beer peers Low-to-mid growth and margin profile among Wine & Spirits 15% 20.0x 26.0x 3.0x 3.9x wine and spirits peers Implied Weighted Avg. P/E 22.6x 25.1x Gemini Current P/E 21.4x 21.4x Implied P/E Multiple â^ (%) +5% +17% Implied P/E Multiple +1.1x +3.7x 14 Source: Company filings, Wall Street research and FactSet. (1) Based on fiscal year 2023 (ending February 28) EBIT contributions.
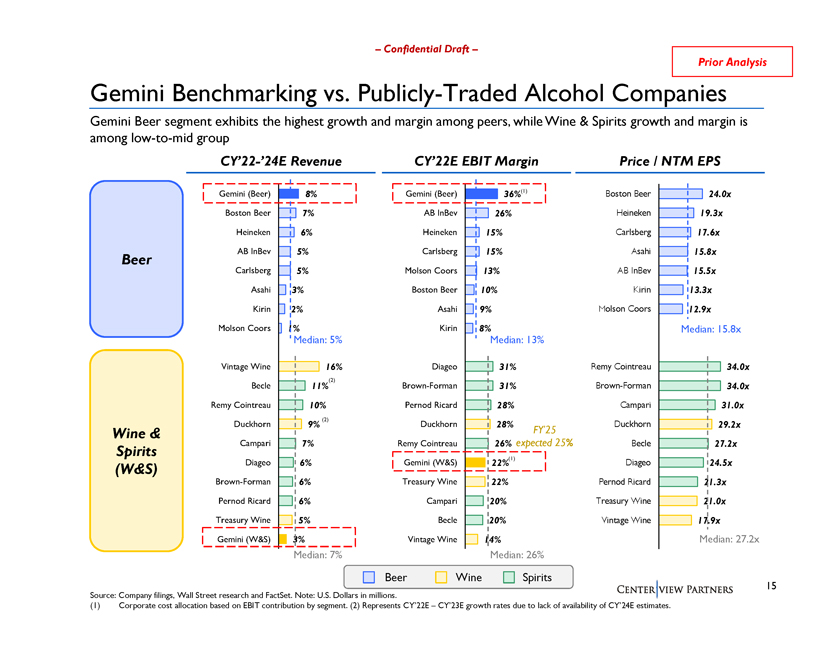
Confidential Draft Prior Analysis Gemini Benchmarking vs. Publicly-Traded Alcohol Companies Gemini Beer segment exhibits the highest growth and margin among peers, while Wine & Spirits growth and margin is among low-to-mid group CY22-24E Revenue CY22E EBIT Margin Price / NTM EPS Gemini (Beer) 8% Gemini (Beer) 36%(1) Boston Beer 24.0x Boston Beer 7% AB InBev 26% Heineken 19.3x Heineken 6% Heineken 15% Carlsberg 17.6x AB InBev 5% Carlsberg 15% Asahi 15.8x Beer Carlsberg 5% Molson Coors 13% AB InBev 15.5x Asahi 3% Boston Beer 10% Kirin 13.3x Kirin 2% Asahi 9% Molson Coors 12.9x Molson Coors 1% Kirin 8% Median: 15.8x Median: 5% Median: 13% Vintage Wine 16% Diageo 31% Remy Cointreau 34.0x (2) Becle 11% Brown-Forman 31% Brown-Forman 34.0x Remy Cointreau 10% Pernod Ricard 28% Campari 31.0x Duckhorn 9% (2) Duckhorn 28% Duckhorn 29.2x Wine & FY25 Campari 7% Remy Cointreau 26% expected 25% Becle 27.2x Spirits (W&S) Diageo 6% Gemini (W&S) 22%(1) Diageo 24.5x Brown-Forman 6% Treasury Wine 22% Pernod Ricard 21.3x Pernod Ricard 6% Campari 20% Treasury Wine 21.0x Treasury Wine 5% Becle 20% Vintage Wine 17.9x Gemini (W&S) 3% Vintage Wine 14% Median: 27.2x Median: 7% Median: 26% Beer Wine Spirits 15 Source: Company filings, Wall Street research and FactSet. Note: U.S. Dollars in millions. (1) Corporate cost allocation based on EBIT contribution by segment. (2) Represents CY22E CY23E growth rates due to lack of availability of CY24E estimates.
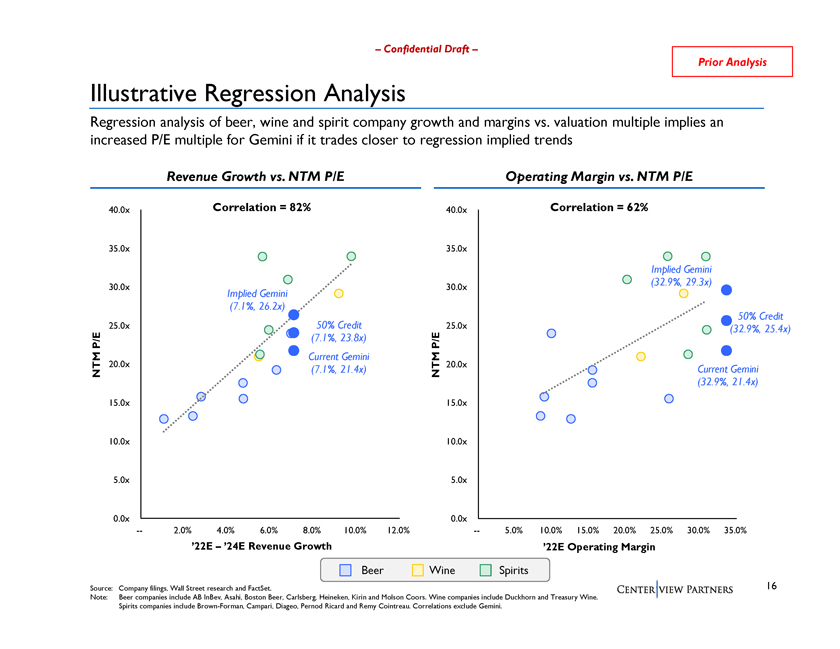
Confidential Draft Prior Analysis Illustrative Regression Analysis Regression analysis of beer, wine and spirit company growth and margins vs. valuation multiple implies an increased P/E multiple for Gemini if it trades closer to regression implied trends Revenue Growth vs. NTM P/E Operating Margin vs. NTM P/E 40.0x Correlation = 82% 40.0x Correlation = 62% 35.0x 35.0x Implied Gemini (32.9%, 29.3x) 30.0x 30.0x Implied Gemini (7.1%, 26.2x) 50% Credit 25.0x 50% Credit 25.0x (32.9%, 25.4x) P/E (7.1%, 23.8x) P/E Current Gemini 20.0x 20.0x Current Gemini NTM (7.1%, 21.4x) NTM (32.9%, 21.4x) 15.0x 15.0x 10.0x 10.0x 5.0x 5.0x 0.0x 0.0x 2.0% 4.0% 6.0% 8.0% 10.0% 12.0% 5.0% 10.0% 15.0% 20.0% 25.0% 30.0% 35.0% 22E 24E Revenue Growth 22E Operating Margin Beer Wine Spirits Source: Company filings, Wall Street research and FactSet. 16 Note: Beer companies include AB InBev, Asahi, Boston Beer, Carlsberg, Heineken, Kirin and Molson Coors. Wine companies include Duckhorn and Treasury Wine. Spirits companies include Brown-Forman, Campari, Diageo, Pernod Ricard and Remy Cointreau. Correlations exclude Gemini.