EXHIBIT (C)(15)
Published on August 1, 2022
Exhibit (c)(15)
Confidential Draft Project Gemini: Confidential Discussion Materials For The Special Committee April 22, 2022
Confidential Draft Disclaimer This presentation has been prepared by Centerview Partners LLC (Centerview) for use solely by the Special Committee of the Board of Directors of Gemini in connection with its evaluation of a proposed share reclassification and for no other purpose. The information contained herein is based upon information supplied by or on behalf of Gemini and publicly available information, and portions of the information contained herein may be based upon statements, estimates and forecasts provided by Gemini. Centerview has relied upon the accuracy and completeness of the foregoing information, and has not assumed any responsibility for any independent verification of such information or for any independent evaluation or appraisal of any of the assets or liabilities (contingent or otherwise) of Gemini or any other entity, or concerning the solvency or fair value of Gemini or any other entity. With respect to financial forecasts, including with respect to estimates of potential synergies, Centerview has assumed that such forecasts have been reasonably prepared on bases reflecting the best currently available estimates and judgments of the managements of Gemini as to their respective future financial performances, and at your direction Centerview has relied upon such forecasts, as provided by Geminis management, with respect to both Gemini, including as to expected synergies. Centerview assumes no responsibility for and expresses no view as to such forecasts or the assumptions on which they are based. The information set forth herein is based upon economic, monetary, market and other conditions as in effect on, and the information made available to us as of, the date hereof, unless indicated otherwise and Centerview assumes no obligation to update or otherwise revise these materials. The financial analysis in this presentation is complex and is not necessarily susceptible to a partial analysis or summary description. In performingthis financial analysis, Centerview has considered the results of its analysis as a whole and did not necessarily attribute a particular weight to any particular portion of the analysis considered. Furthermore, selecting any portion of Centerviews analysis, without considering the analysis as a whole, wouldcreate an incomplete view of the process underlying its financial analysis. Centerview may have deemed various assumptions more or less probable than other assumptions, so the reference ranges resulting from any particular portion of the analysis described above should not be taken to be Centerviews view of the actual value of Gemini. These materials and the information contained herein are confidential, were not prepared with a view toward public disclosure, and may not be disclosed publicly or made available to third parties without the prior written consent of Centerview. These materials and any other advice, written or oral, rendered by Centerview are intended solely for the benefit and use of the Special Committee of the Board of Directors of Gemini (in its capacity as such) in its consideration of the proposed share reclassification, and are not for the benefit of, and do not convey any rights or remedies for any holder of securities of Gemini or any other person. Centerview will not be responsible for and has not provided any tax, accounting, actuarial, legal or other specialist advice. These materials are not intended to provide the sole basis for evaluating the proposed transaction, and this presentation does not represent a fairness opinion, recommendation, valuation or opinion of any kind, and is necessarily incomplete and should be viewed solely in conjunction with the oral presentation provided by Centerview.
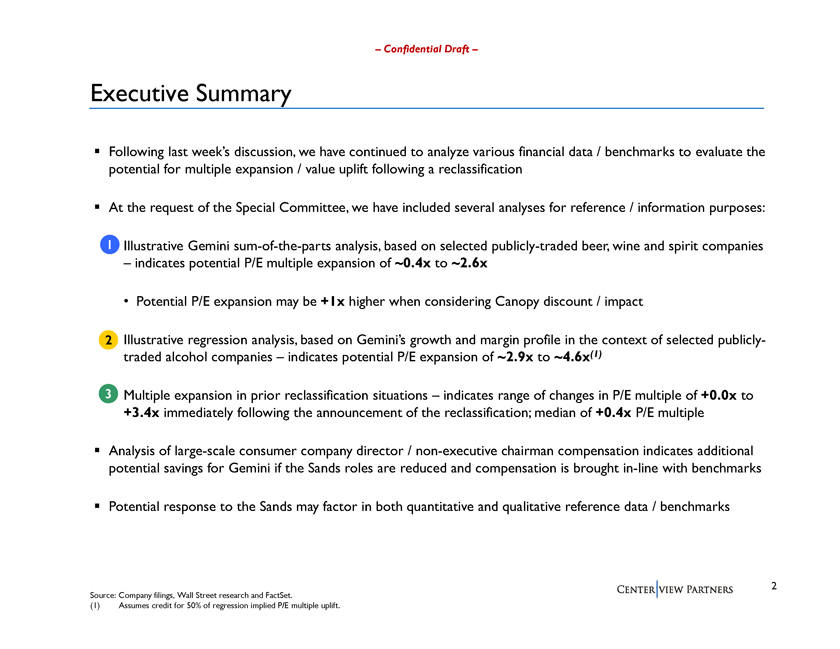
Confidential Draft Executive Summary ◾ Following last weeks discussion, we have continued to analyze various financial data / benchmarks to evaluate the potential for multiple expansion / value uplift following a reclassification ◾ At the request of the Special Committee, we have included several analyses for reference / information purposes: 1 Illustrative Gemini sum-of-the-parts analysis, based on selected publicly-traded beer, wine and spirit companies indicates potential P/E multiple expansion of ~0.4x to ~2.6x Potential P/E expansion may be +1x higher when considering Canopy discount / impact 2 Illustrative regression analysis, based on Geminis growth and margin profile in the context of selected publicly-traded alcohol companies indicates potential P/E expansion of ~2.9x to ~4.6x(1) 3 Multiple expansion in prior reclassification situations indicates range of changes in P/E multiple of +0.0x to +3.4x immediately following the announcement of the reclassification; median of +0.4x P/E multiple Analysis of large-scale consumer company director / non-executive chairman compensation indicates additional potential savings for Gemini if the Sands roles are reduced and compensation is brought in-line with benchmarks Potential response to the Sands may factor in both quantitative and qualitative reference data / benchmarks 2 Source: Company filings, Wall Street research and FactSet. (1) Assumes credit for 50% of regression implied P/E multiple uplift.
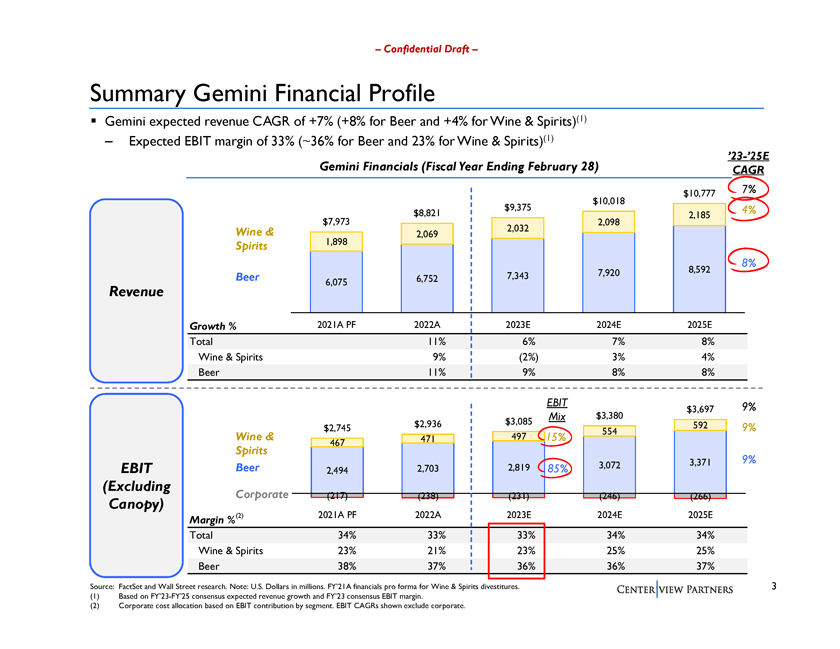
Confidential Draft Summary Gemini Financial Profile Gemini expected revenue CAGR of +7% (+8% for Beer and +4% for Wine & Spirits)(1) Expected EBIT margin of 33% (~36% for Beer and 23% for Wine & Spirits)(1) 23-25E Gemini Financials (Fiscal Year Ending February 28) CAGR Revenue EBIT (Excluding Canopy) Source: FactSet and Wall Street research. Note: U.S. Dollars in millions. FY21A financials pro forma for Wine & Spirits divestitures. (1) Based on FY23-FY25 consensus expected revenue growth and FY23 consensus EBIT margin. (2) Corporate cost allocation based on EBIT contribution by segment. EBIT CAGRs shown exclude corporate.
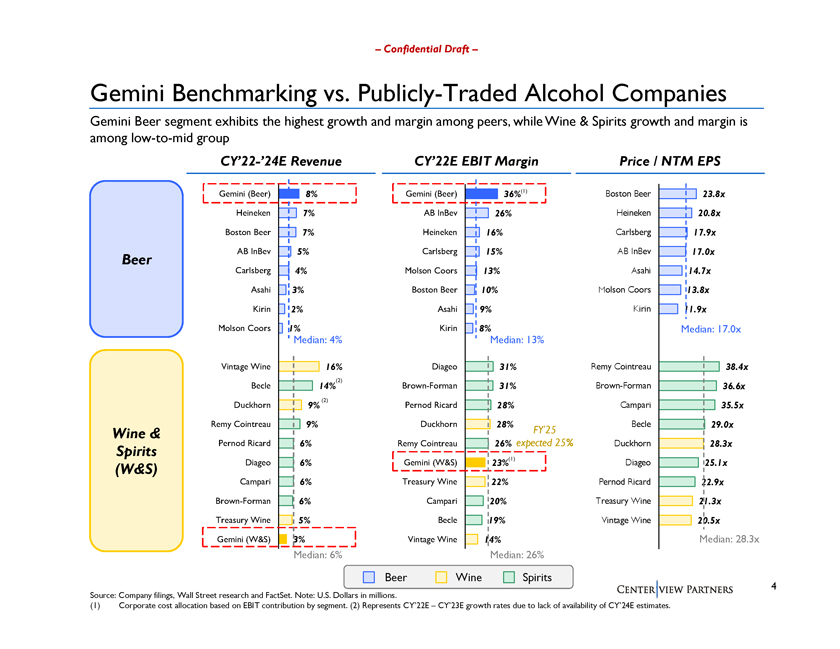
Confidential Draft Gemini Benchmarking vs. Publicly-Traded Alcohol Companies Gemini Beer segment exhibits the highest growth and margin among peers, while Wine & Spirits growth and margin is among low-to-mid group CY22-24E Revenue CY22E EBIT Margin Price / NTM EPS Beer Wine & Spirits (W&S) Source: Company filings, Wall Street research and FactSet. Note: U.S. Dollars in millions. (1) Corporate cost allocation based on EBIT contribution by segment. (2) Represents CY22E CY23E growth rates due to lack of availability of CY24E estimates.
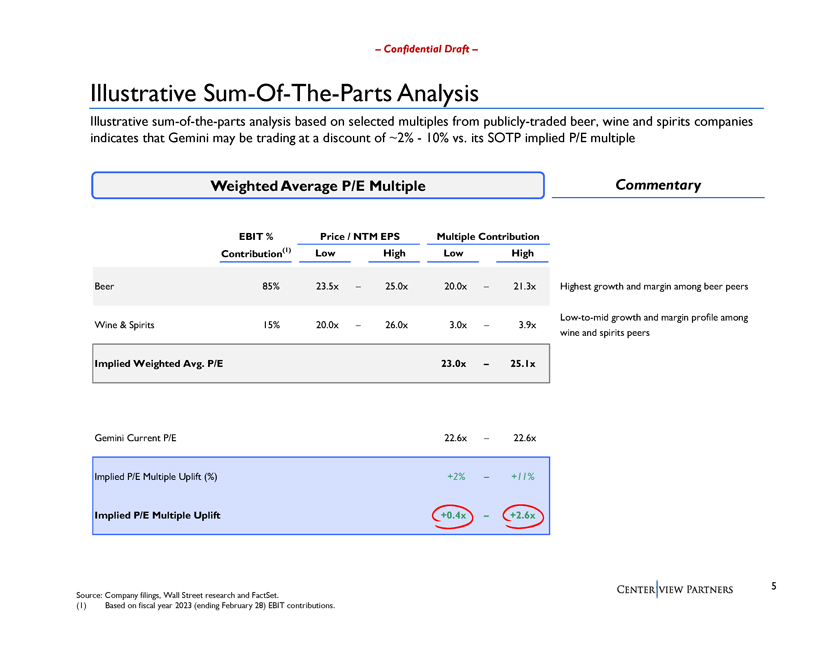
Confidential Draft Illustrative Sum-Of-The-Parts Analysis Illustrative sum-of-the-parts analysis based on selected multiples from publicly-traded beer, wine and spirits companies indicates that Gemini may be trading at a discount of ~2%10% vs. its SOTP implied P/E multiple Weighted Average P/E Multiple Commentary EBIT % Price / NTM EPS Multiple Contribution Contribution(1) Low High Low High Beer 85% 23.5x 25.0x 20.0x 21.3x Highest growth and margin among beer peers Low-to-mid growth and margin profile among Wine & Spirits 15% 20.0x 26.0x 3.0x 3.9x wine and spirits peers Implied Weighted Avg. P/E 23.0x 25.1x Gemini Current P/E 22.6x 22.6x Implied P/E Multiple Uplift (%) +2% +11% Implied P/E Multiple Uplift +0.4x +2.6x Source: Company filings, Wall Street research and FactSet. (1) Based on fiscal year 2023 (ending February 28) EBIT contributions.
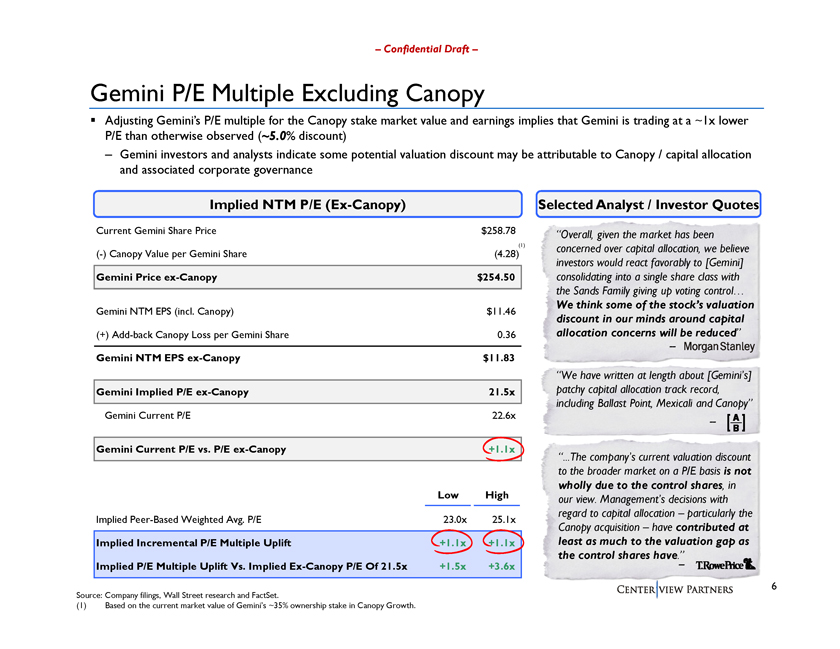
Confidential Draft Gemini P/E Multiple Excluding Canopy Adjusting Geminis P/E multiple for the Canopy stake market value and earnings implies that Gemini is trading at a ~1x lower P/E than otherwise observed (~5.0% discount) Gemini investors and analysts indicate some potential valuation discount may be attributable to Canopy / capital allocation and associated corporate governance Implied NTM P/E (Ex-Canopy) Current Gemini Share Price $258.78 (1) (-) Canopy Value per Gemini Share (4.28) Gemini Price ex-Canopy $254.50 Gemini NTM EPS (incl. Canopy) $11.46 (+) Add-back Canopy Loss per Gemini Share 0.36 Gemini NTM EPS ex-Canopy $11.83 Gemini Implied P/E ex-Canopy 21.5x Gemini Current P/E 22.6x Gemini Current P/E vs. P/E ex-Canopy +1.1x Low High Implied Peer-Based Weighted Avg. P/E 23.0x 25.1x Implied Incremental P/E Multiple Uplift +1.1x +1.1x Implied P/E Multiple Uplift Vs. Implied Ex-Canopy P/E Of 21.5x +1.5x +3.6x Source: Company filings, Wall Street research and FactSet. (1) Based on the current market value of Geminis ~35% ownership stake in Canopy Growth. Selected Analyst / Investor Quotes Overall, given the market has been concerned over capital allocation, we believe investors would react favorably to [Gemini] consolidating into a single share class with the Sands Family giving up voting control We think some of the stocks valuation discount in our minds around capital allocation concerns will be reduced We have written at length about [Geminis] patchy capital allocation track record, including Ballast Point, Mexicali and Canopy ...The companys current valuation discount to the broader market on a P/E basis is not wholly due to the control shares, in our view. Managements decisions with regard to capital allocation particularly the Canopy acquisition have contributed at least as much to the valuation gap as the control shares have.
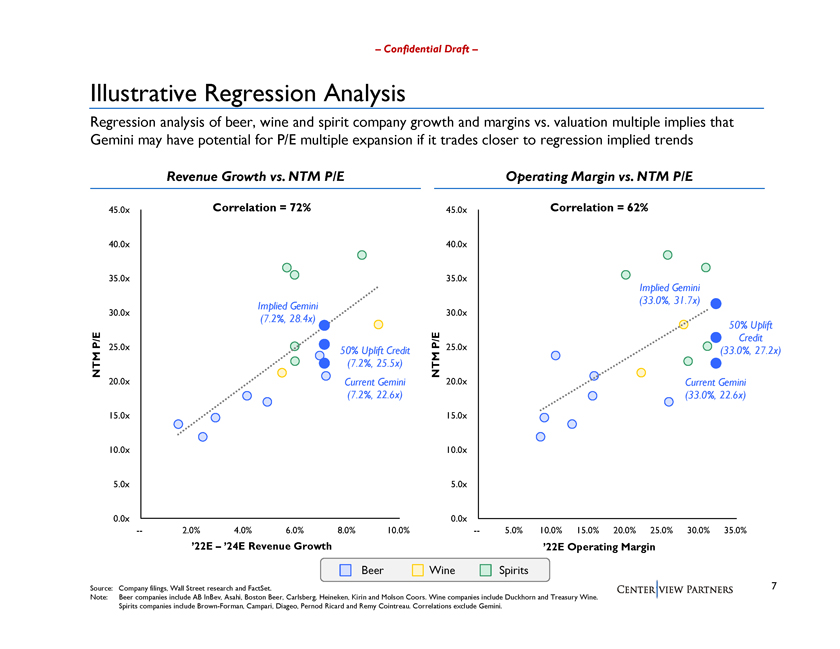
Confidential Draft Illustrative Regression Analysis Regression analysis of beer, wine and spirit company growth and margins vs. valuation multiple implies that Gemini may have potential for P/E multiple expansion if it trades closer to regression implied trends Revenue Growth vs. NTM P/E Operating Margin vs. NTM P/E Source: Company filings, Wall Street research and FactSet. Note: Beer companies include AB InBev, Asahi, Boston Beer, Carlsberg, Heineken, Kirin and Molson Coors. Wine companies include Duckhorn and Treasury Wine. Spirits companies include Brown-Forman, Campari, Diageo, Pernod Ricard and Remy Cointreau. Correlations exclude Gemini.
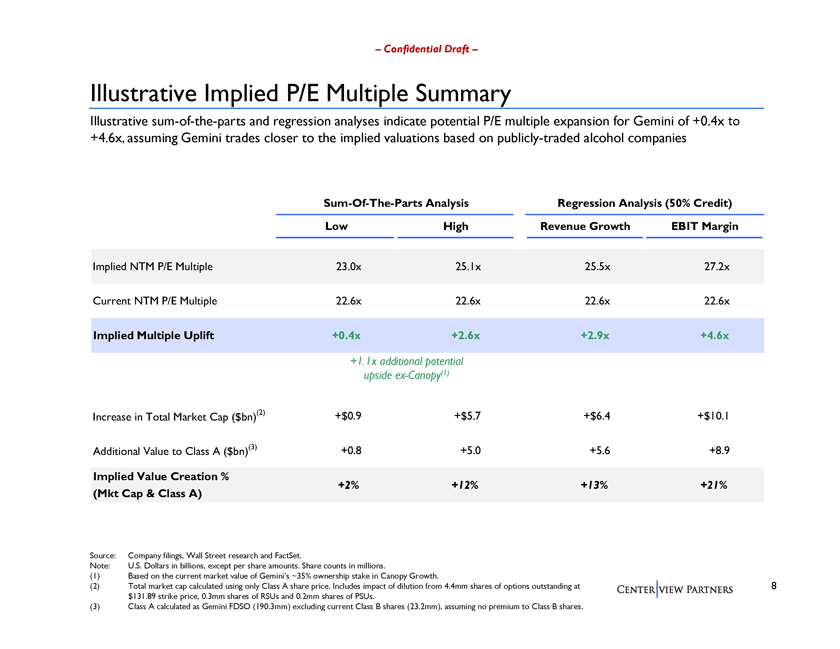
Confidential Draft Illustrative Implied P/E Multiple Summary Illustrative sum-of-the-parts and regression analyses indicate potential P/E multiple expansion for Gemini of +0.4x to +4.6x, assuming Gemini trades closer to the implied valuations based on publicly-traded alcohol companies Sum-Of-The-Parts Analysis Regression Analysis (50% Credit) Low High Revenue Growth EBIT Margin Implied NTM P/E Multiple 23.0x 25.1x 25.5x 27.2x Current NTM P/E Multiple 22.6x 22.6x 22.6x 22.6x Implied Multiple Uplift +0.4x +2.6x +2.9x +4.6x +1.1x additional potential upside ex-Canopy(1) Increase in Total Market Cap ($bn)(2) +$0.9 +$5.7 +$6.4 +$10.1 Additional Value to Class A ($bn)(3) +0.8 +5.0 +5.6 +8.9 Implied Value Creation % +2% +12% +13% +21% (Mkt Cap & Class A) Source: Company filings, Wall Street research and FactSet. Note: U.S. Dollars in billions, except per share amounts. Share counts in millions. (1) Based on the current market value of Geminis ~35% ownership stake in Canopy Growth. (2) Total market cap calculated using only Class A share price. Includes impact of dilution from 4.4mm shares of options outstanding at $131.89 strike price, 0.3mm shares of RSUs and 0.2mm shares of PSUs. (3) Class A calculated as Gemini FDSO (190.3mm) excluding current Class B shares (23.2mm), assuming no premium to Class B shares.
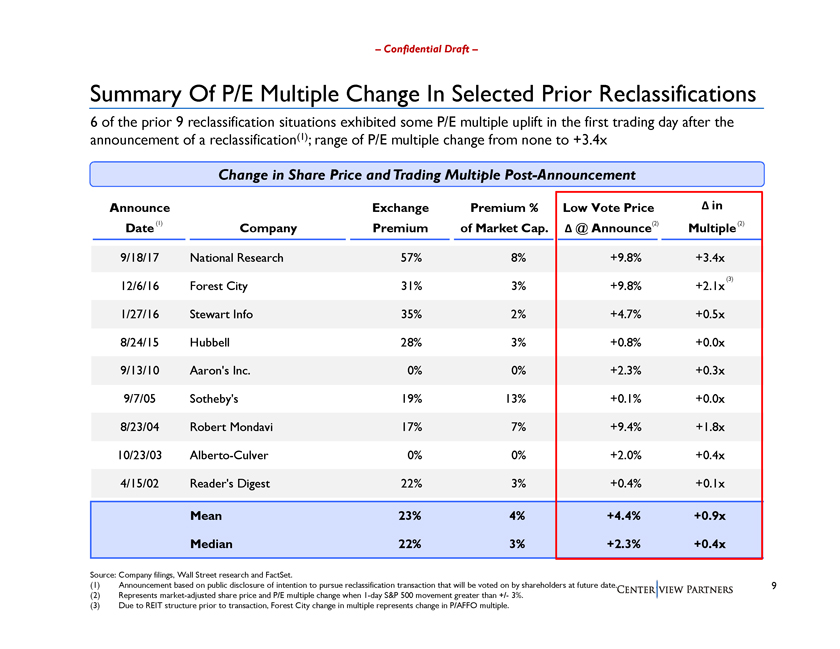
Confidential Draft Summary Of P/E Multiple Change In Selected Prior Reclassifications 6 of the prior 9 reclassification situations exhibited some P/E multiple uplift in the first trading day after the announcement of a reclassification(1); range of P/E multiple change from none to +3.4x Change in Share Price and Trading Multiple Post-Announcement Announce Exchange Premium % Low Vote Price in Date(1) Company Premium of Market Cap. @ Announce(2) Multiple(2) 9/18/17 National Research 57% 8% +9.8% +3.4x (3) 12/6/16 Forest City 31% 3% +9.8% +2.1x 1/27/16 Stewart Info 35% 2% +4.7% +0.5x 8/24/15 Hubbell 28% 3% +0.8% +0.0x 9/13/10 Aarons Inc. 0% 0% +2.3% +0.3x 9/7/05 Sothebys 19% 13% +0.1% +0.0x 8/23/04 Robert Mondavi 17% 7% +9.4% +1.8x 10/23/03 Alberto-Culver 0% 0% +2.0% +0.4x 4/15/02 Readers Digest 22% 3% +0.4% +0.1x Mean 23% 4% +4.4% +0.9x Median 22% 3% +2.3% +0.4x Source: Company filings, Wall Street research and FactSet. (1) Announcement based on public disclosure of intention to pursue reclassification transaction that will be voted on by shareholders at future date. (2) Represents market-adjusted share price and P/E multiple change when 1-day S&P 500 movement greater than +/- 3%. (3) Due to REIT structure prior to transaction, Forest City change in multiple represents change in P/AFFO multiple.
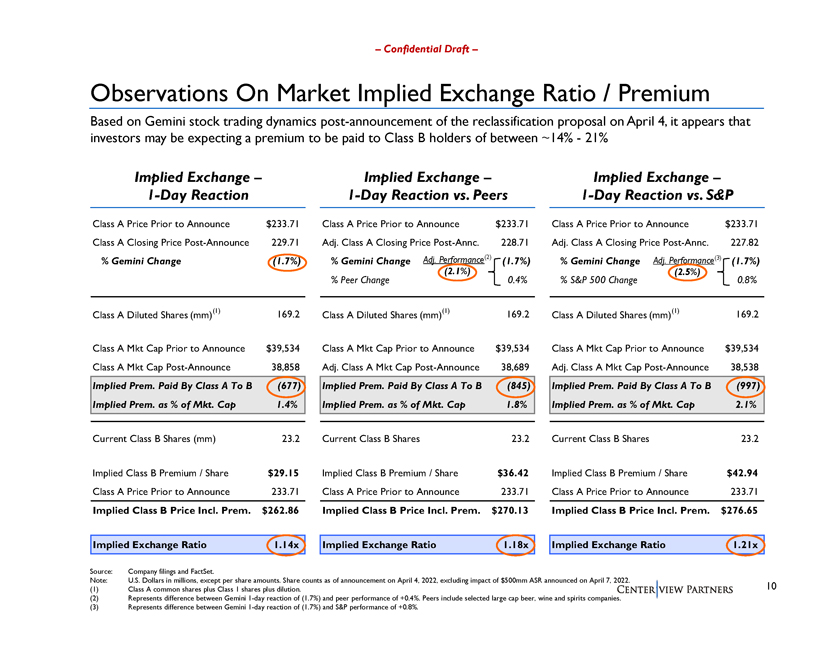
Confidential Draft Observations On Market Implied Exchange Ratio / Premium Based on Gemini stock trading dynamics post-announcement of the reclassification proposal on April 4, it appears that investors may be expecting a premium to be paid to Class B holders of between ~14%21% Implied Exchange 1-Day Reaction Class A Price Prior to Announce $233.71 Class A Closing Price Post-Announce 229.71 % Gemini Change (1.7%) Class A Diluted Shares (mm)(1) 169.2 Class A Mkt Cap Prior to Announce $39,534 Class A Mkt Cap Post-Announce 38,858 Implied Prem. Paid By Class A To B (677) Implied Prem. as % of Mkt. Cap 1.4% Current Class B Shares (mm) 23.2 Implied Class B Premium / Share $29.15 Class A Price Prior to Announce 233.71 Implied Class B Price Incl. Prem. $262.86 Implied Exchange Ratio 1.14x Implied Exchange 1-Day Reaction vs. Peers Class A Price Prior to Announce $233.71 Adj. Class A Closing Price Post-Annc. 228.71 % Gemini Change Adj. Performance(2) (1.7%) (2.1%) % Peer Change 0.4% Class A Diluted Shares (mm)(1) 169.2 Class A Mkt Cap Prior to Announce $39,534 Adj. Class A Mkt Cap Post-Announce 38,689 Implied Prem. Paid By Class A To B (845) Implied Prem. as % of Mkt. Cap 1.8% Current Class B Shares 23.2 Implied Class B Premium / Share $36.42 Class A Price Prior to Announce 233.71 Implied Class B Price Incl. Prem. $270.13 Implied Exchange Ratio 1.18x Implied Exchange 1-Day Reaction vs. S&P Class A Price Prior to Announce $233.71 Adj. Class A Closing Price Post-Annc. 227.82 % Gemini Change Adj. Performance(3) (1.7%) (2.5%) % S&P 500 Change 0.8% Class A Diluted Shares (mm)(1) 169.2 Class A Mkt Cap Prior to Announce $39,534 Adj. Class A Mkt Cap Post-Announce 38,538 Implied Prem. Paid By Class A To B (997) Implied Prem. as % of Mkt. Cap 2.1% Current Class B Shares 23.2 Implied Class B Premium / Share $42.94 Class A Price Prior to Announce 233.71 Implied Class B Price Incl. Prem. $276.65 Implied Exchange Ratio 1.21x Source: Company filings and FactSet. Note: U.S. Dollars in millions, except per share amounts. Share counts as of announcement on April 4, 2022, excluding impact of $500mm ASR announced on April 7, 2022. (1) Class A common shares plus Class 1 shares plus dilution. (2) Represents difference between Gemini 1-day reaction of (1.7%) and peer performance of +0.4%. Peers include selected large cap beer, wine and spirits companies. (3) Represents difference between Gemini 1-day reaction of (1.7%) and S&P performance of +0.8%.
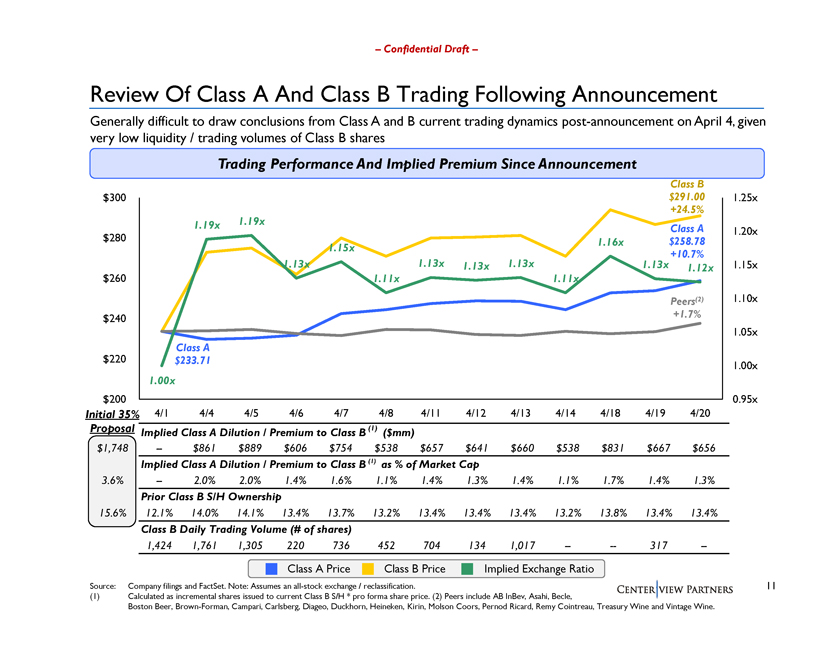
Confidential Draft Review Of Class A And Class B Trading Following Announcement Generally difficult to draw conclusions from Class A and B current trading dynamics post-announcement on April 4, given very low liquidity / trading volumes of Class B shares Trading Performance And Implied Premium Since Announcement Source: Company filings and FactSet. Note: Assumes an all-stock exchange / reclassification. (1) Calculated as incremental shares issued to current Class B S/H * pro forma share price. (2) Peers include AB InBev, Asahi, Becle, Boston Beer, Brown-Forman, Campari, Carlsberg, Diageo, Duckhorn, Heineken, Kirin, Molson Coors, Pernod Ricard, Remy Cointreau, Treasury Wine and Vintage Wine.
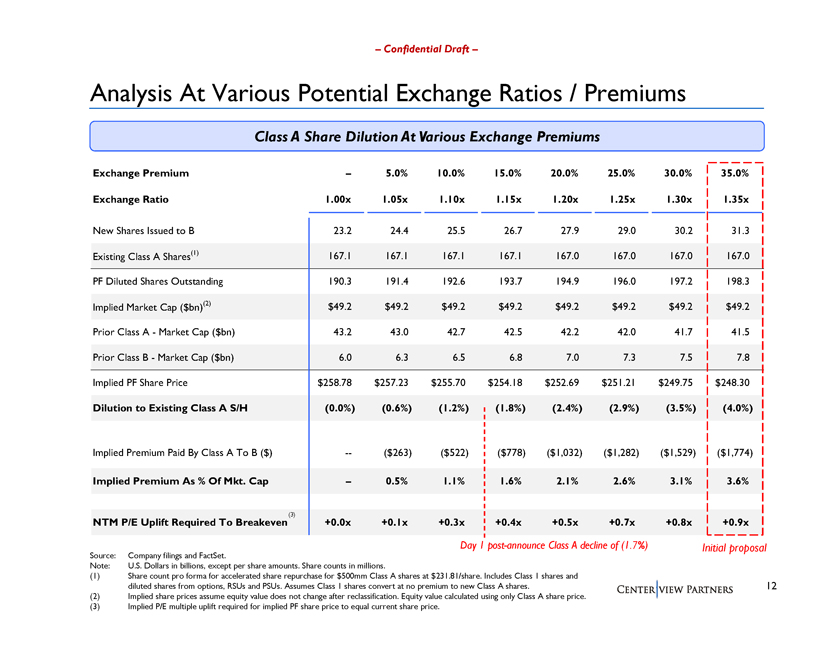
Confidential Draft Analysis At Various Potential Exchange Ratios / Premiums Class A Share Dilution At Various Exchange Premiums Exchange Premium Exchange Ratio New Shares Issued to B Existing Class A Shares(1) PF Diluted Shares Outstanding Implied Market Cap ($bn)(2) Prior Class AMarket Cap ($bn) Prior Class BMarket Cap ($bn) Implied PF Share Price Dilution to Existing Class A S/H Implied Premium Paid By Class A To B ($) Implied Premium As % Of Mkt. Cap (3) NTM P/E Uplift Required To Breakeven Source: Company filings and FactSet. Note: U.S. Dollars in billions, except per share amounts. Share counts in millions. (1) Share count pro forma for accelerated share repurchase for $500mm Class A shares at $231.81/share. Includes Class 1 shares and diluted shares from options, RSUs and PSUs. Assumes Class 1 shares convert at no premium to new Class A shares. (2) Implied share prices assume equity value does not change after reclassification. Equity value calculated using only Class A share price. (3) Implied P/E multiple uplift required for implied PF share price to equal current share price.
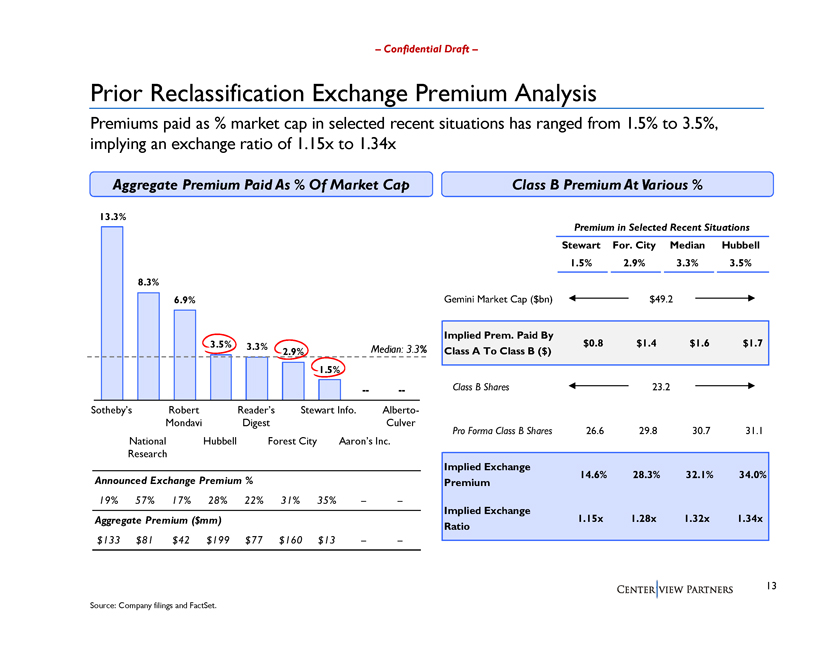
Confidential Draft Prior Reclassification Exchange Premium Analysis Premiums paid as % market cap in selected recent situations has ranged from 1.5% to 3.5%, implying an exchange ratio of 1.15x to 1.34x Aggregate Premium Paid As % Of Market Cap Sothebys 12 Robert 34 Readers 567 Stewart Info. 89 Alberto-Mondavi Digest Culver National Hubbell Forest City Aarons Inc. Research Announced Exchange Premium % Aggregate Premium ($mm) Class B Premium At Various % Premium in Selected Recent Situations Stewart For. City Median Hubbell Gemini Market Cap ($bn) Implied Prem. Paid By Class A To Class B ($) Class B Shares Pro Forma Class B Shares Implied Exchange Premium Implied Exchange Ratio Source: Company filings and FactSet.
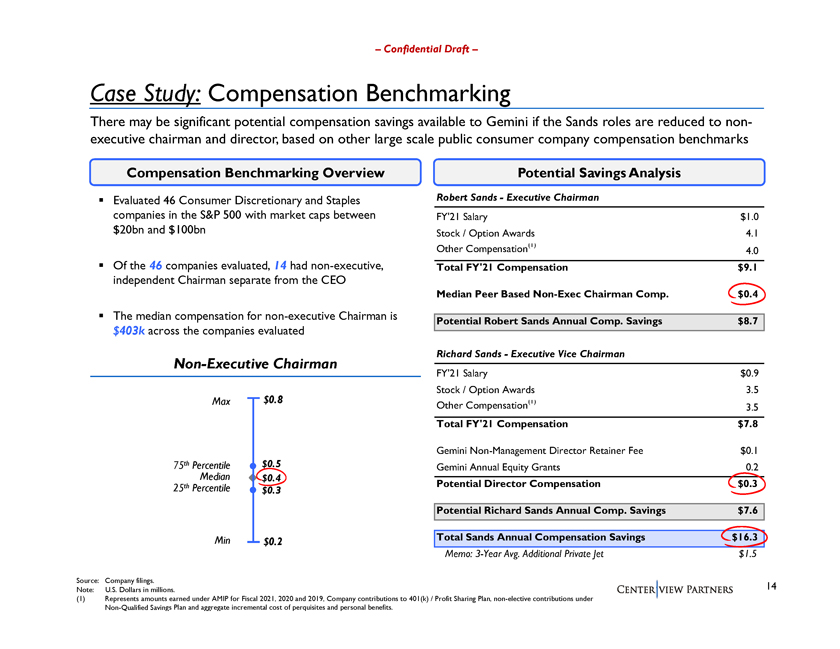
Confidential Draft Case Study: Compensation Benchmarking There may be significant potential compensation savings available to Gemini if the Sands roles are reduced to non-executive chairman and director, based on other large scale public consumer company compensation benchmarks Compensation Benchmarking Overview Evaluated 46 Consumer Discretionary and Staples companies in the S&P 500 with market caps between $20bn and $100bn Of the 46 companies evaluated, 14 had non-executive, independent Chairman separate from the CEO The median compensation for non-executive Chairman is $403k across the companies evaluated Non-Executive Chairman Potential Savings Analysis Robert SandsExecutive Chairman FY21 Salary $1.0 Stock / Option Awards 4.1 Other Compensation(1) 4.0 Total FY21 Compensation $9.1 Median Peer Based Non-Exec Chairman Comp. $0.4 Potential Robert Sands Annual Comp. Savings $8.7 Richard SandsExecutive Vice Chairman FY21 Salary $0.9 Stock / Option Awards 3.5 Other Compensation(1) 3.5 Total FY21 Compensation $7.8 Gemini Non-Management Director Retainer Fee $0.1 Gemini Annual Equity Grants 0.2 Potential Director Compensation $0.3 Potential Richard Sands Annual Comp. Savings $7.6 Total Sands Annual Compensation Savings $16.3 Memo: 3-Year Avg. Additional Private Jet $1.5 Source: Company filings. Note: U.S. Dollars in millions. (1) Represents amounts earned under AMIP for Fiscal 2021, 2020 and 2019, Company contributions to 401(k) / Profit Sharing Plan, non-elective contributions under Non-Qualified Savings Plan and aggregate incremental cost of perquisites and personal benefits.
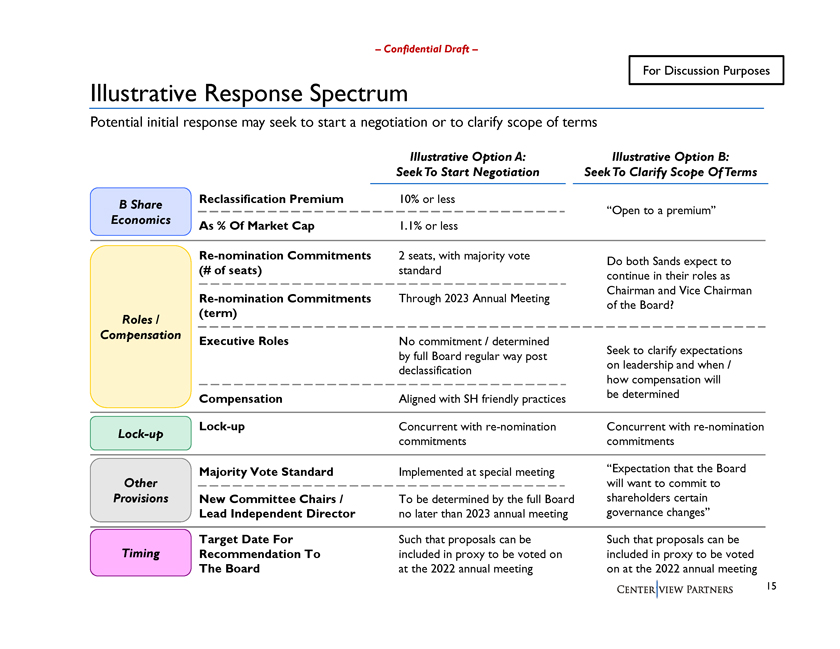
Confidential Draft For Discussion Purposes Illustrative Response Spectrum Potential initial response may seek to start a negotiation or to clarify scope of terms B Share Economics Roles / Compensation Lock-up Other Provisions Timing Reclassification Premium As % Of Market Cap Re-nomination Commitments (# of seats) Re-nomination Commitments (term) Executive Roles Compensation Lock-up Majority Vote Standard New Committee Chairs / Lead Independent Director Target Date For Recommendation To The Board Illustrative Option A: Seek To Start Negotiation 10% or less 1.1% or less 2 seats, with majority vote standard Through 2023 Annual Meeting No commitment / determined by full Board regular way post declassification Aligned with SH friendly practices Concurrent with re-nomination commitments Implemented at special meeting To be determined by the full Board no later than 2023 annual meeting Such that proposals can be included in proxy to be voted on at the 2022 annual meeting Illustrative Option B: Seek To Clarify Scope Of Terms Open to a premium Do both Sands expect to continue in their roles as Chairman and Vice Chairman of the Board? Seek to clarify expectations on leadership and when / how compensation will be determined Concurrent with re-nomination commitments Expectation that the Board will want to commit to shareholders certain governance changes Such that proposals can be included in proxy to be voted on at the 2022 annual meeting
Appendix
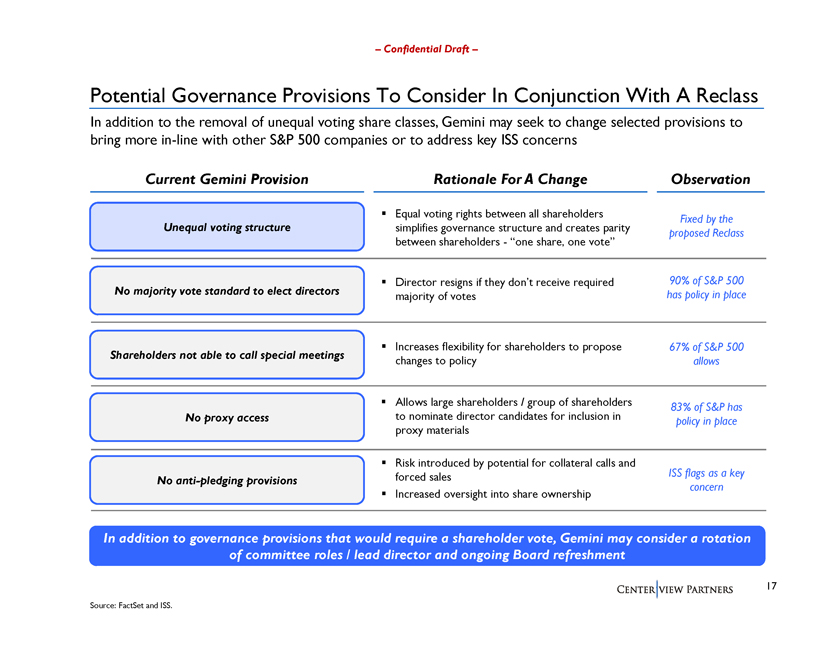
Confidential Draft Potential Governance Provisions To Consider In Conjunction With A Reclass In addition to the removal of unequal voting share classes, Gemini may seek to change selected provisions to bring more in-line with other S&P 500 companies or to address key ISS concerns Current Gemini Provision Unequal voting structure No majority vote standard to elect directors Shareholders not able to call special meetings No proxy access No anti-pledging provisions Rationale For A Change Equal voting rights between all shareholders simplifies governance structure and creates parity between shareholdersone share, one vote Director resigns if they dont receive required majority of votes Increases flexibility for shareholders to propose changes to policy Allows large shareholders / group of shareholders to nominate director candidates for inclusion in proxy materials Risk introduced by potential for collateral calls and forced sales Increased oversight into share ownership Observation Fixed by the proposed Reclass 90% of S&P 500 has policy in place 67% of S&P 500 allows 83% of S&P has policy in place ISS flags as a key concern In addition to governance provisions that would require a shareholder vote, Gemini may consider a rotation of committee roles / lead director and ongoing Board refreshment Source: FactSet and ISS.
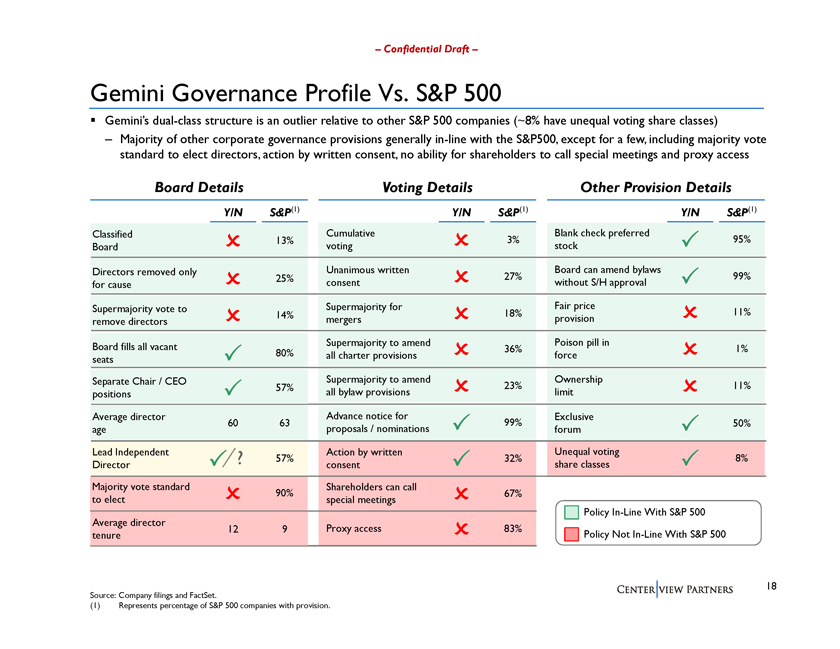
Confidential Draft Gemini Governance Profile Vs. S&P 500 Geminis dual-class structure is an outlier relative to other S&P 500 companies (~8% have unequal voting share classes) Majority of other corporate governance provisions generally in-line with the S&P500, except for a few, including majority vote standard to elect directors, action by written consent, no ability for shareholders to call special meetings and proxy access Board Details Y/N S&P(1) Classified 13% Board Directors removed only 25% for cause Supermajority vote to 14% remove directors Board fills all vacant 80% seats Separate Chair / CEO 57% positions Average director 60 63 age Lead Independent ? 57% Director Majority vote standard 90% to elect Average director 12 9 tenure Voting Details Y/N S&P(1) Cumulative 3% voting Unanimous written 27% consent Supermajority for 18% mergers Supermajority to amend 36% all charter provisions Supermajority to amend 23% all bylaw provisions Advance notice for 99% proposals / nominations Action by written 32% consent Shareholders can call 67% special meetings Proxy access 83% Other Provision Details Y/N S&P(1) Blank check preferred 95% stock Board can amend bylaws 99% without S/H approval Fair price 11% provision Poison pill in 1% force Ownership 11% limit Exclusive 50% forum Unequal voting 8% share classes Policy In-Line With S&P 500 Policy Not In-Line With S&P 500 Source: Company filings and FactSet. (1) Represents percentage of S&P 500 companies with provision.
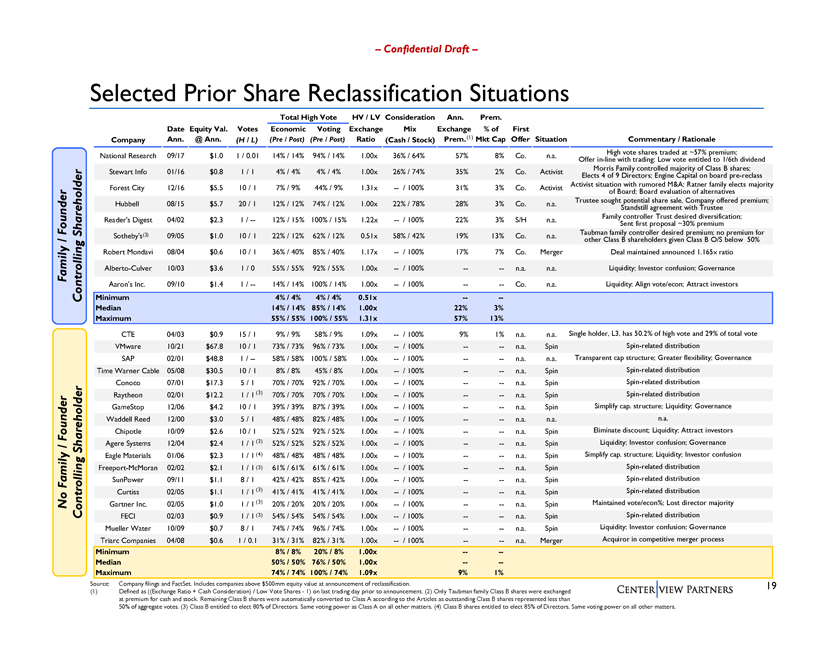
Confidential Draft Selected Prior Share Reclassification Situations No Family / Founder Family / Founder Controlling Shareholder Controlling Shareholder Total High Vote HV / LV Consideration Ann. Prem. Date Equity Val. Votes Economic Voting Exchange Mix Exchange % of First Company Ann. @ Ann. (H / L) (Pre / Post) (Pre / Post) Ratio (Cash / Stock) Prem.(1) Mkt Cap Offer Situation Commentary / Rationale National Research 09/17 $1.0 1 / 0.01 14% / 14% 94% / 14% 1.00x 36% / 64% 57% 8% Co. n.a. Offer in-line High with vote trading; shares Low traded vote at entitled ~57% premium; to 1/6th dividend Stewart Info 01/16 $0.8 1 / 1 4% / 4% 4% / 4% 1.00x 26% / 74% 35% 2% Co. Activist Elects Morris 4 of 9 Family Directors; controlled Engine majority Capital of on Class board B pre shares; -reclass Activist situation with rumored M&A; Ratner family elects majority Forest City 12/16 $5.5 10 / 1 7% / 9% 44% / 9% 1.31x / 100% 31% 3% Co. Activist of Board; Board evaluation of alternatives Trustee sought potential share sale, Company offered premium; Hubbell 08/15 $5.7 20 / 1 12% / 12% 74% / 12% 1.00x 22% / 78% 28% 3% Co. n.a. Standstill agreement with Trustee Family controller Trust desired diversification; Readers Digest 04/02 $2.3 1 / 12% / 15% 100% / 15% 1.22x / 100% 22% 3% S/H n.a. Sent first proposal ~30% premium (2) Taubman family controller desired premium; no premium for Sothebys 09/05 $1.0 10 / 1 22% / 12% 62% / 12% 0.51x 58% / 42% 19% 13% Co. n.a. other Class B shareholders given Class B O/S below 50% Robert Mondavi 08/04 $0.6 10 / 1 36% / 40% 85% / 40% 1.17x / 100% 17% 7% Co. Merger Deal maintained announced 1.165x ratio Alberto-Culver 10/03 $3.6 1 / 0 55% / 55% 92% / 55% 1.00x / 100% -- n.a. n.a. Liquidity; Investor confusion; Governance Aarons Inc. 09/10 $1.4 1 / 14% / 14% 100% / 14% 1.00x / 100% -- Co. n.a. Liquidity; Align vote/econ; Attract investors Minimum 4% / 4% 4% / 4% 0.51x --Median 14% / 14% 85% / 14% 1.00x 22% 3% Maximum 55% / 55% 100% / 55% 1.31x 57% 13% CTE 04/03 $0.9 15 / 1 9% / 9% 58% / 9% 1.09x / 100% 9% 1% n.a. n.a. Single holder, L3, has 50.2% of high vote and 29% of total vote VMware 10/21 $67.8 10 / 1 73% / 73% 96% / 73% 1.00x / 100% -- n.a. Spin Spin-related distribution SAP 02/01 $48.8 1 / 58% / 58% 100% / 58% 1.00x / 100% -- n.a. n.a. Transparent cap structure; Greater flexibility; Governance Time Warner Cable 05/08 $30.5 10 / 1 8% / 8% 45% / 8% 1.00x / 100% -- n.a. Spin Spin-related distribution Conoco 07/01 $17.3 5 / 1 70% / 70% 92% / 70% 1.00x / 100% -- n.a. Spin Spin-related distribution Raytheon 02/01 $12.2 1 / 1 (3) 70% / 70% 70% / 70% 1.00x / 100% -- n.a. Spin Spin-related distribution GameStop 12/06 $4.2 10 / 1 39% / 39% 87% / 39% 1.00x / 100% -- n.a. Spin Simplify cap. structure; Liquidity; Governance Waddell Reed 12/00 $3.0 5 / 1 48% / 48% 82% / 48% 1.00x / 100% -- n.a. n.a. n.a. Chipotle 10/09 $2.6 10 / 1 52% / 52% 92% / 52% 1.00x / 100% -- n.a. Spin Eliminate discount; Liquidity; Attract investors Agere Systems 12/04 $2.4 1 / 1 (3) 52% / 52% 52% / 52% 1.00x / 100% -- n.a. Spin Liquidity; Investor confusion; Governance Eagle Materials 01/06 $2.3 1 / 1 (4) 48% / 48% 48% / 48% 1.00x / 100% -- n.a. Spin Simplify cap. structure; Liquidity; Investor confusion Freeport-McMoran 02/02 $2.1 1 / 1 (3) 61% / 61% 61% / 61% 1.00x / 100% -- n.a. Spin Spin-related distribution SunPower 09/11 $1.1 8 / 1 42% / 42% 85% / 42% 1.00x / 100% -- n.a. Spin Spin-related distribution Curtiss 02/05 $1.1 1 / 1 (3) 41% / 41% 41% / 41% 1.00x / 100% -- n.a. Spin Spin-related distribution Gartner Inc. 02/05 $1.0 1 / 1 (3) 20% / 20% 20% / 20% 1.00x / 100% -- n.a. Spin Maintained vote/econ%; Lost director majority FECI 02/03 $0.9 1 / 1 (3) 54% / 54% 54% / 54% 1.00x / 100% -- n.a. Spin Spin-related distribution Mueller Water 10/09 $0.7 8 / 1 74% / 74% 96% / 74% 1.00x / 100% n.a. Spin Liquidity; Investor confusion; Governance Triarc Companies 04/08 $0.6 1 / 0.1 31% / 31% 82% / 31% 1.00x / 100% n.a. Merger Acquiror in competitive merger process Minimum 8% / 8% 20% / 8% 1.00x Median 50% / 50% 76% / 50% 1.00x Maximum 74% / 74% 100% / 74% 1.09x 9% 1% Source: Company filings and FactSet. Includes companies above $500mm equity value at announcement of reclassification. 19 (1) Defined as ((Exchange Ratio + Cash Consideration) / Low Vote Shares1) on last trading day prior to announcement. (2) Only Taubman family Class B shares were exchanged at premium for cash and stock. Remaining Class B shares were automatically converted to Class A according to the Articles as outstanding Class B shares represented less than 50% of aggregate votes. (3) Class B entitled to elect 80% of Directors. Same voting power as Class A on all other matters. (4) Class B shares entitled to elect 85% of Directors. Same voting power on all other matters.