EXHIBIT (C)(24)
Published on August 1, 2022
Exhibit (c)(24)
Preliminary Controlled Company Trading Analyses AUGUST 10, 2021 STRICTLY PRIVATE & CONFIDENTIAL
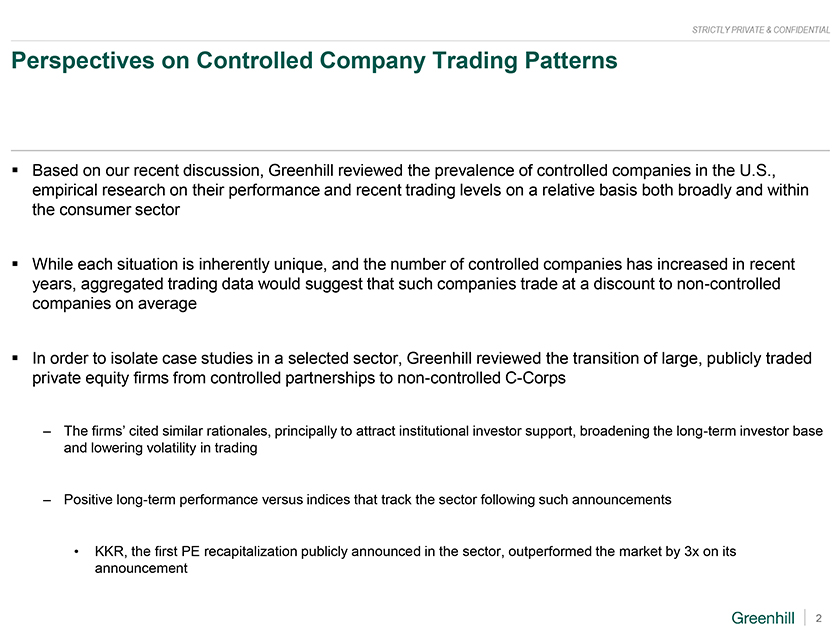
STRICTLY PRIVATE & CONFIDENTIAL Perspectives on Controlled Company Trading Patterns Based on our recent discussion, Greenhill reviewed the prevalence of controlled companies in the U.S., empirical research on their performance and recent trading levels on a relative basis both broadly and within the consumer sector While each situation is inherently unique, and the number of controlled companies has increased in recent years, aggregated trading data would suggest that such companies trade at a discount to non-controlled companies on average In order to isolate case studies in a selected sector, Greenhill reviewed the transition of large, publicly traded private equity firms from controlled partnerships to non-controlled C-Corps The firms cited similar rationales, principally to attract institutional investor support, broadening the long-term investor base and lowering volatility in trading Positive long-term performance versus indices that track the sector following such announcements KKR, the first PE recapitalization publicly announced in the sector, outperformed the market by 3x on its announcement 2
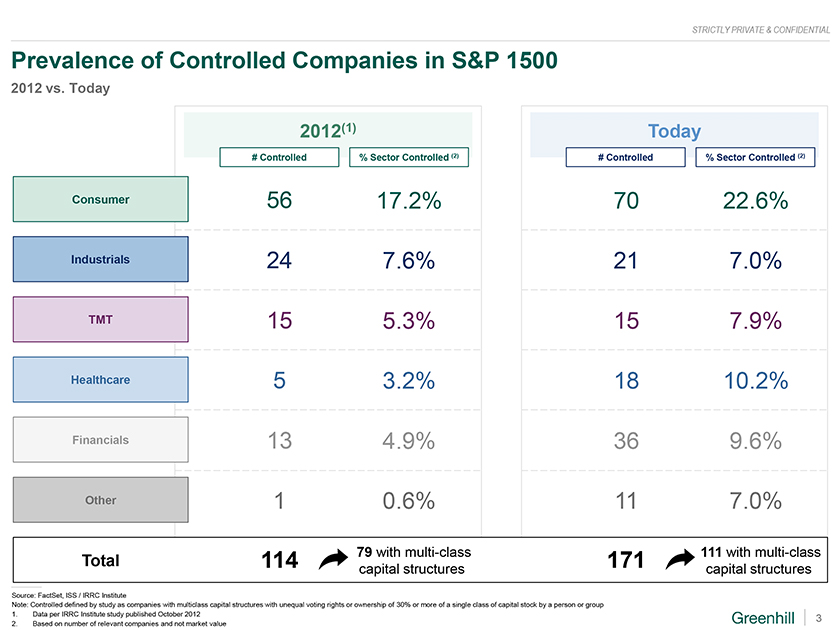
STRICTLY PRIVATE & CONFIDENTIAL Prevalence of Controlled Companies in S&P 1500 2012 vs. Today 2012(1) Today # Controlled % Sector Controlled (2) # Controlled % Sector Controlled (2) Consumer 56 17.2% 70 22.6% Industrials 24 7.6% 21 7.0% TMT 15 5.3% 15 7.9% Healthcare 5 3.2% 18 10.2% Financials 13 4.9% 36 9.6% Other 1 0.6% 11 7.0% 79 with multi-class 111 with multi-class Total 114 171 capital structures capital structures Source: FactSet, ISS / IRRC Institute Note: Controlled defined by study as companies with multiclass capital structures with unequal voting rights or ownership of 30% or more of a single class of capital stock by a person or group 1. Data per IRRC Institute study published October 2012 3 2. Based on number of relevant companies and not market value
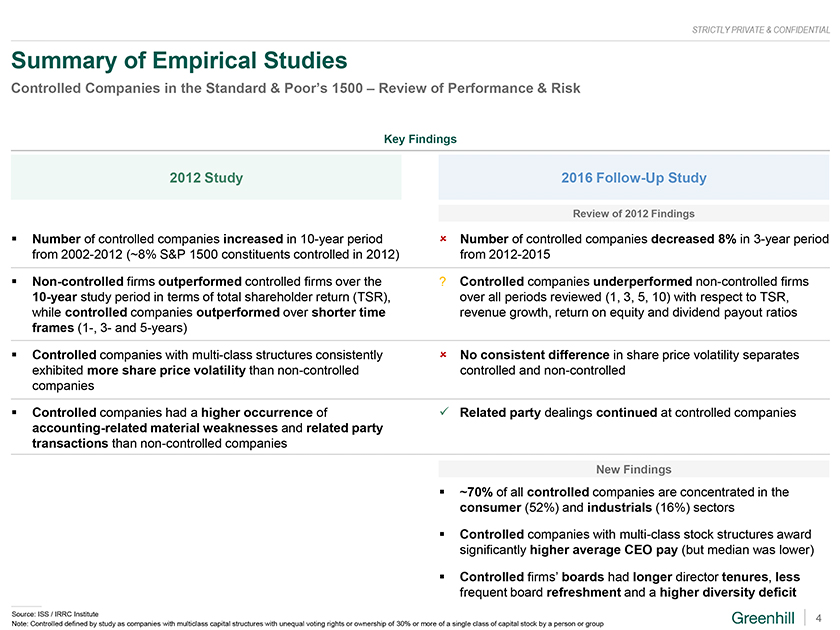
STRICTLY PRIVATE & CONFIDENTIAL Summary of Empirical Studies Controlled Companies in the Standard & Poors 1500 Review of Performance & Risk Key Findings 2012 Study 2016 Follow-Up Study Review of 2012 Findings Number of controlled companies increased in 10-year period Number of controlled companies decreased 8% in 3-year period from 2002-2012 (~8% S&P 1500 constituents controlled in 2012) from 2012-2015 Non-controlled firms outperformed controlled firms over the ? Controlled companies underperformed non-controlled firms 10-year study period in terms of total shareholder return (TSR), over all periods reviewed (1, 3, 5, 10) with respect to TSR, while controlled companies outperformed over shorter time revenue growth, return on equity and dividend payout ratios frames (1-, 3- and 5-years) Controlled companies with multi-class structures consistently ï» No consistent difference in share price volatility separates exhibited more share price volatility than non-controlled controlled and non-controlled companies Controlled companies had a higher occurrence of ✓ Related party dealings continued at controlled companies accounting-related material weaknesses and related party transactions than non-controlled companies New Findings ~70% of all controlled companies are concentrated in the consumer (52%) and industrials (16%) sectors Controlled companies with multi-class stock structures award significantly higher average CEO pay (but median was lower) Controlled firms boards had longer director tenures, less frequent board refreshment and a higher diversity deficit Source: ISS / IRRC Institute 4 Note: Controlled defined by study as companies with multiclass capital structures with unequal voting rights or ownership of 30% or more of a single class of capital stock by a person or group
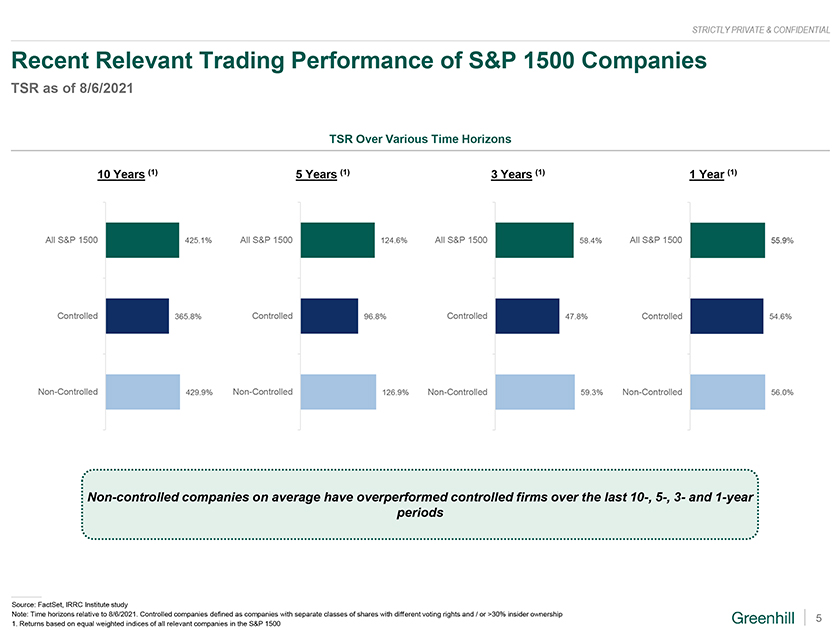
STRICTLY PRIVATE & CONFIDENTIAL Recent Relevant Trading Performance of S&P 1500 Companies TSR as of 8/6/2021 TSR Over Various Time Horizons 10 Years (1) 5 Years (1) 3 Years (1) 1 Year (1) All S&P 1500 425.1% All S&P 1500 124.6% All S&P 1500 58.4% All S&P 1500 55.9% Controlled 365.8% Controlled 96.8% Controlled 47.8% Controlled 54.6% Non-Controlled 429.9% Non-Controlled 126.9% Non-Controlled 59.3% Non-Controlled 56.0% Non-controlled companies on average have overperformed controlled firms over the last 10-, 5-, 3- and 1-year periods Source: FactSet, IRRC Institute study Note: Time horizons relative to 8/6/2021. Controlled companies defined as companies with separate classes of shares with different voting rights and / or >30% insider ownership 5 1. Returns based on equal weighted indices of all relevant companies in the S&P 1500
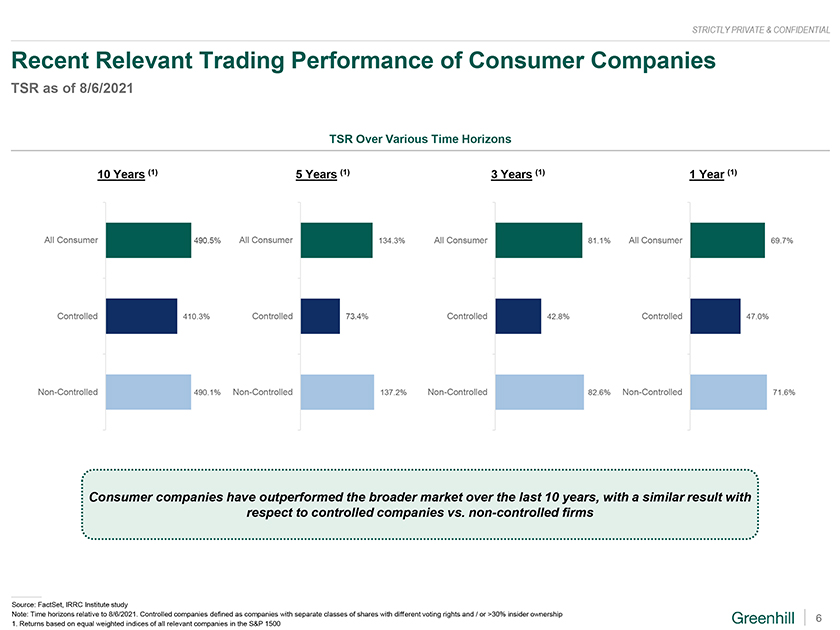
STRICTLY PRIVATE & CONFIDENTIAL Recent Relevant Trading Performance of Consumer Companies TSR as of 8/6/2021 TSR Over Various Time Horizons 10 Years (1) 5 Years (1) 3 Years (1) 1 Year (1) All Consumer 490.5% All Consumer 134.3% All Consumer 81.1% All Consumer 69.7% Controlled 410.3% Controlled 73.4% Controlled 42.8% Controlled 47.0% Non-Controlled 490.1% Non-Controlled 137.2% Non-Controlled 82.6% Non-Controlled 71.6% Consumer companies have outperformed the broader market over the last 10 years, with a similar result with respect to controlled companies vs. non-controlled firms Source: FactSet, IRRC Institute study Note: Time horizons relative to 8/6/2021. Controlled companies defined as companies with separate classes of shares with different voting rights and / or >30% insider ownership 6 1. Returns based on equal weighted indices of all relevant companies in the S&P 1500
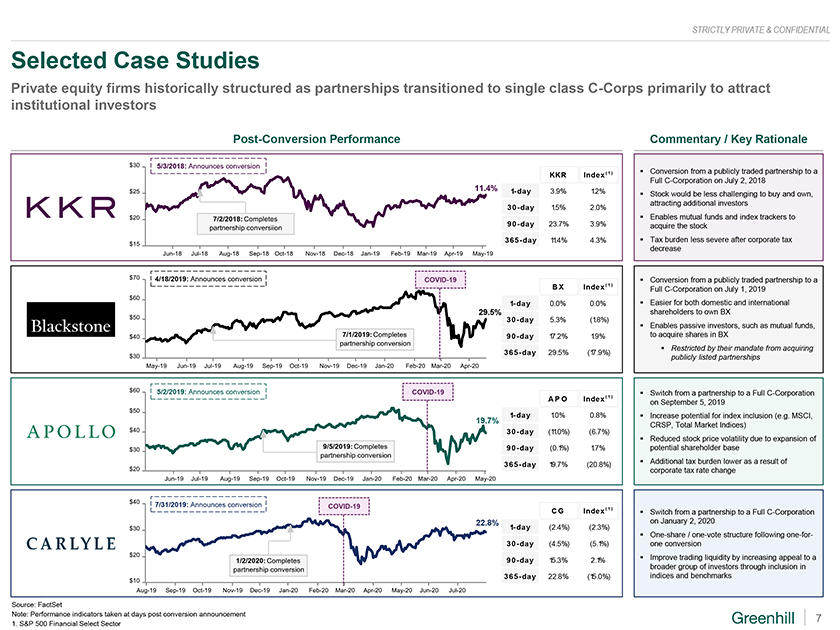
STRICTLY PRIVATE & CONFIDENTIAL Selected Case Studies Private equity firms historically structured as partnerships transitioned to single class C-Corps primarily to attract institutional investors Post-Conversion Performance Commentary / Key Rationale 5/3/2018: Announces conversion ( 1 ) Conversion from a publicly traded partnership to a KKR Index Full C-Corporation on July 2, 2018 11.4% 1-day 3.9% 1 .2% Stock would be less challenging to buy and own, attracting additional investors 30-day 1 .5% 2.0% Enables mutual funds and index trackers to 90-day 23.7% 3.9% acquire the stock 365-day 11 .4% 4.3% Tax burden less severe after corporate tax decrease 4/18/2019: Announces conversion COVID-19 Conversion from a publicly traded partnership to a BX Index( 1 ) Full C-Corporation on July 1, 2019 1-day 0.0% 0.0% Easier for both domestic and international 29.5% shareholders to own BX 30-day 5.3% (1 .8%) Enables passive investors, such as mutual funds, 90-day 17.2% 1 .9% to acquire shares in BX Restricted by their mandate from acquiring 365-day 29.5% (17.9%) publicly listed partnerships 5/2/2019: Announces conversion COVID-19 ( 1 ) Switch from a partnership to a Full C-Corporation A P O Index on September 5, 2019 1-day 1 .0% 0.8% Increase potential for index inclusion (e.g. MSCI, 19.7% 30-day (11 .0%) (6.7%) CRSP, Total Market Indices) Reduced stock price volatility due to expansion of 90-day (0.1%) 1 .7% potential shareholder base 365-day 19.7% (20.8%) Additional tax burden lower as a result of corporate tax rate change 7/31/2019: Announces conversion COVID-19 CG Index( 1 ) Switch from a partnership to a Full C-Corporation 22.8% 1-day (2.4%) (2.3%) on January 2, 2020 One-share / one-vote structure following one-for- 30-day (4.5%) (5.1%) one conversion 90-day 15.3% 2.1% Improve trading liquidity by increasing appeal to a broader group of investors through inclusion in 365-day 22.8% (15.0%) indices and benchmarks Source: FactSet Note: Performance indicators taken at days post conversion announcement 7 1. S&P 500 Financial Select Sector
STRICTLY PRIVATE & CONFIDENTIAL Disclaimer This document has been prepared by Greenhill & Co., LLC (Greenhill) exclusively for the benefit and internal use of the Recipient solely for its use in engaging in discussions with Greenhill and, or, evaluating one or more potential transactions and may not be used for any other purpose or copied, distributed, reproduced, disclosed or otherwise made available to any other person without Greenhills prior written consent. This document may only be relied upon by the Recipient and no other person. Greenhill is not and will not be responsible to any other person (legal or otherwise) in relation to the ideas, analysis, services or transactions referred to in this document. By providing this document Greenhill is not acting as the Recipients agent, fiduciary or investment adviser. This document is private and confidential; by accepting this document, you are deemed to agree to treat it and its contents confidentially. This document does not constitute an opinion, and is not intended to be and does not constitute a recommendation to the Recipient as to whether to take any action, approve or undertake any other action in respect of any ideas, analysis or transactions contemplated in this document. The commercial merits or suitability or expected profitability or benefit of any transactions should be independently determined by the Recipient based on its own assessment of the legal, tax, accounting, regulatory, financial, credit and other related aspects of the transaction, relying on such information and advice from the Recipients own professional advisors and such other experts as it deems relevant. Greenhill does not provide accounting, tax, legal or regulatory advice. In preparing this document, Greenhill has relied on publicly available information and other information, including, if applicable, financial estimates, projections and forecasts provided to it by the Recipient, the relevant counterparty and their respective representatives and/or advisers and has assumed, without independent verification, the accuracy and completeness of all such information. None of Greenhill nor any member of its group or their respective partners, directors or employees accept any responsibility or liability (express or implied) whatsoever for any loss arising, directly or indirectly, from use of or reliance on, this document or any other written or oral communications with or information provided to the Recipient in connection with its subject matter. Greenhill has not conducted any evaluation or appraisal of any assets or liabilities of the company or companies mentioned herein or of any other person referred to in this document. Although all information has been obtained from and is based on sources believed to be reliable, no undertaking, representation or warranty, express or implied, is made by Greenhill in relation to the accuracy or completeness of the information presented herein or any other written or oral communications with or information provided, or its suitability for any particular purpose. Certain information included herein, such as financial analysis, estimates, projections and forecasts, may contain forward-looking statements which involve risk and uncertainty, such as business, economic and regulatory changes, which could cause actual results to differ materially from such estimates, projections and forecasts. No representation or warranty is given as to the achievement or reasonableness of any forward-looking statements discussed in this document. 8