EX-99.1
Published on December 5, 2022

Exhibit 99.1 2022 MORGAN STANLEY GLOBAL CONSUMER & RETAIL CONFERENCE DECEMBER 6, 2022
FORWARD-LOOKING STATEMENTS This presentation contains forward-looking statements that are based on certain assumptions, estimates, expectations, plans, analyses, and opinions made by management in light of their experience and perception of historical trends, current conditions, and expected future developments, as well as other factors management believes are appropriate in the circumstances. These forward-looking statements are subject to various risks and uncertainties, many of which are beyond our or Canopy’s control, and which could cause actual results to differ materially from those set forth in, or implied by, such forward-looking statements. When used in this presentation, words such as “anticipate,” “intend,” “expect,” “plan,” “continue,” ”estimate,” “exceed,” “may,” “will,” “project,” “predict,” “propose,” “potential,” “targeting,” “exploring,” “scheduled,” “implementing,” “could,” “might,” “should,” “believe,” and similar words or expressions are intended to identify forward-looking statements, although not all forward-looking statements contain such identifying words. Although we believe that the estimates, expectations, plans, and timetables reflected in the forward-looking statements are reasonable, they may vary from management’s current estimates, expectations, plans, and timetables, and we can give no assurance that such estimates, expectations, plans, and timetables will prove to be correct, as actual results and future events and timetables could differ materially from those anticipated in such statements. Information provided in this presentation is necessarily summarized and may not contain all available material information. All statements other than statements of historical fact in this presentation may be forward-looking statements, including without limitation statements regarding or applicable to our business strategy, future operations, innovation and DBA strategies, new products, future financial position and liquidity, future net sales, expected volume, inventory, and depletion trends, future marketing spend, long-term financial model, future effective tax rates and anticipated tax liabilities, access to capital markets, and prospects, plans, and objectives of management; anticipated inflationary pressures and our responses thereto as well as other unfavorable global and regional economic conditions, geopolitical events, and military conflicts, such as repercussions from the conflict in Ukraine; our ESG strategy, corporate social responsibility and sustainability initiatives, environmental stewardship targets, and human capital and diversity, equity, and inclusion objectives, goals, and priorities; the potential impact to supply, production levels, and costs due to global supply chain constraints, transportation, wildfires, and severe weather events; the impact of the Reclassification on the market price of our common stock, associated non-recurring costs and expenses related thereto, and reclassification-related financing costs and expenses; the COVID-19 pandemic; expected or potential actions of third parties, including possible changes to laws, rules, regulations, international trade agreements, tariffs, taxes, other governmental rules or regulations, or other action by regulatory and governmental agencies or other third parties; the future expected balance of supply and demand for and inventory levels of our products; the refinement of our wine and spirits portfolio; the availability of a supply chain finance program; potential amounts of contingent consideration, if any, received in the divestitures of a portion of our wine and spirits business; the manner, timing, and duration of our share repurchase program and source of funds for share repurchases; the amount and timing of future dividends; our beer expansion, optimization, and/or construction activities, including anticipated scope, capacity, supply, costs, capital expenditures, timeframes for completion, discussions with government officials in Mexico, and potential future impairment of non-recoverable brewery construction assets and other costs and expenses; future, target, or expected growth and growth drivers, shareholder value creation, cash flows, gross profit, gross margin, operating income, operating margin, EBIT, leverage ratios, including target debt leverage ratios, dividend payout ratio, depreciation, and other financial metrics; distribution opportunities; strategic business initiatives; expected operating performance; demographic shifts; activities surrounding our investment in Canopy; Canopy’s key priorities, expectations, and outlook; Canopy’s plans to consolidated its U.S. cannabis assets, our intention to transition Common Shares into Exchangeable Shares and to negotiate an exchange of our notes in Canopy for Exchangeable Shares, and potential results of such transactions, including the termination of certain agreements and the surrender of outstanding Canopy warrants we hold; triggering events for and the potential impact of Canopy Strategic Transactions; a potential future impairment of our investment in Canopy; our future ownership level and structure in Canopy and our future accounting for our investment in Canopy; the anticipated availability of water, agricultural and other raw materials, and packaging materials; future global economic, market, or other regulatory conditions; unanticipated environmental liabilities and costs; timing of accounting elections or assertions or changes in accounting elections, assertions, or standards; changes in interest rates and foreign exchange rates; the actions of competitors; consumer preferences and trends; the anticipated effects and benefits of our investment in Canopy and potential benefits to or loss of benefits by Canopy; the ability of Canopy to grow its business, operations, and activities; potential impacts on Canopy’s growth prospects; potential opportunities in the Canadian, U.S., and global cannabis markets; the potential for future form factors and product development; the availability or benefit of Canopy’s existing contractual relationships; the ability of Canopy to achieve market scale; future Canopy revenue run rate and expected timing; Canopy’s future outstanding share capital; the abilities of management of Canopy and composition of Canopy’s management team; total addressable market, potential future profitability, market shares, and operating margins to be achieved in CBD, medical, and recreational cannabis markets; product development; clinical trial work; current and future acquisition, disposition, and investment activities; cannabis legalization; the ability of our divisions to grow their businesses, operations, and activities; potential opportunities in the U.S. and global wine and spirits markets and the U.S. beer market; capital allocation priorities and commitments; the potential for future product development and ability to maintain market scale; and key emerging consumer trends. | 2
FORWARD-LOOKING STATEMENTS (CONT.) In addition to the risks and uncertainties of ordinary business operations and conditions in the general economy and markets in which we compete, our forward-looking statements contained in this presentation are also subject to the risk, uncertainty, and possible variance from our current expectations regarding: the ability to recognize anticipated benefits of the Reclassification; the impact of the Reclassification on the market price of our common stock; the incurrence of substantial non-recurring costs and expenses in connection with the negotiation and completion of the Reclassification; litigation matters; water, agricultural and other raw material, and packaging material supply, production, and/or shipment difficulties which could adversely affect our ability to supply our customers; the ability to respond to anticipated inflationary pressures, including reductions in consumer discretionary income and our ability to pass along rising costs through increased selling prices, and unfavorable global or regional economic conditions, including economic slowdown or recession; the actual impact to supply, production levels, and costs from global supply chain constraints, transportation challenges (including from labor strikes or other labor activities), wildfires, and severe weather events; the actual balance of supply and demand for our products and the performance of our distributors; the actual demand, net sales, channel proportions, and volume trends for our products; beer operations expansion, optimization, and/or construction activities, scope, capacity, supply, costs (including impairments), capital expenditures, and timing; the duration and impact of the COVID-19 pandemic; the impact of the military conflict in Ukraine and associated geopolitical tensions and responses, including on inflation, supply chains, commodities, energy, and cyber-security; the amount, timing, and source of funds for any share repurchases or potential future exercises of our Canopy warrants; the impact of our investment in Canopy; the amount and timing of future Constellation dividends which are subject to the determination and discretion of our Board of Directors and may be impacted if our ability to use cash flow to fund dividends is affected by unanticipated increases in total net debt, we are unable to generate cash flow at anticipated levels, or we fail to generate expected earnings; the fair value of our investment in Canopy; the accuracy of management’s projections relating to the Canopy investment; the timeframe and amount of any potential future impairment of our investment in Canopy; any impact of U.S. federal laws on Canopy Strategic Transactions; the impact of any Canopy Strategic Transaction upon our future ownership level in Canopy or our future share of Canopy’s reported earnings and losses; the cannabis industry, including legalization, the demand for cannabis products, and operational risks inherent in the conduct of cannabis activities; expected benefits of our investment in Canopy that may not materialize in the manner or timeframe expected or at all; the transaction to consolidate Canopy’s U.S. cannabis assets and our plans to transition into and exchange our remaining notes in Canopy for Exchangeable Shares which may not be completed at all, including because Canopy may not receive the required approval of its shareholders, that such transactions, if completed, may significantly alter our relationship with and investment in Canopy, including by Canopy no longer being able to derive benefits from its current strategic relationship with us, which could negatively impact Canopy, by limiting our right or opportunity to derive economic benefits from our investment in Canopy if Canopy declares dividends or dissolves and we continue to hold Exchangeable Shares or to increase our ownership in Canopy if Canopy’s stock price were to recover prior to the expiration of our Canopy warrants that would be surrendered, or by the potential to subject our financial statements to additional volatility if we account for the Exchangeable Shares at fair value; Canopy’s consolidation of its U.S. cannabis assets if it is not viewed favorably by members of the investment community, whether or not it is completed, which may cause a decrease in the value of Canopy’s common shares and impair its liquidity and marketability or that if such transaction is not completed for any reason, then Canopy will have expended substantial time and resources that could otherwise have been spent on Canopy’s existing businesses and the pursuit of other opportunities that could have been beneficial to Canopy; the potential that Canopy will not remain listed on the stock exchanges it is currently listed on and related impacts; the amount of contingent consideration, if any, received in the divestiture of a portion of our wine and spirits business which will depend on actual future brand performance; the expected impacts of wine and spirits portfolio refinement activities; purchase accounting with respect to any transaction, or the assumptions used regarding the assets purchased and liabilities assumed to determine their fair value; our ability to achieve and timeframes for achieving expected target debt leverage ratios, cash flows, operating margin, earnings, and other financial metrics; receipt of any necessary regulatory approvals; operating and financial risks related to managing future growth; competition in our industry or in the cannabis industry; financing, market, economic, regulatory, and environmental risks; global financial conditions; reliance on key personnel; increases in capital or operating costs; changes to international trade agreements or tariffs; any incremental contingent consideration payment paid; accuracy of all projections, including those associated with previously announced acquisitions, investments, and divestitures as well as others associated with Canopy; accuracy of forecasts relating to joint venture businesses; the actual amount and timing of cost reductions based on management’s final plans; and other factors and uncertainties disclosed from time to time in our filings with the Securities and Exchange Commission, including our Annual Report on Form 10-K for the fiscal year ended February 28, 2022 and our Quarterly Report on Form 10-Q for the quarter ended August 31, 2022. Forward-looking statements are made as of December 5, 2022, and Constellation does not intend and expressly disclaims any obligation to update or revise the forward-looking information contained in this presentation, whether as a result of new information, future events, or otherwise, except as required by law. Accordingly, readers are cautioned not to place undue reliance on forward-looking information. | 3
USE OF NON-GAAP FINANCIAL MEASURES, DISCLAIMER, CAUTION REGARDING OUTDATED MATERIAL, AND LOCATION OF DEFINED TERMS This presentation (including audio, video, and supplemental slides, if any) may contain non-GAAP financial measures. These and other non-GAAP financial measures, the purposes for which management uses them, why management believes they are useful to investors, and a reconciliation to the most directly comparable GAAP financial measures can be found in the appendix of this presentation or at ir.cbrands.com under the Financial Info/Financial History (Non-GAAP) section. All references to profit measures and earnings per share on a comparable basis exclude items that affect comparability. Non-GAAP financial measures are also referred to as being presented on a comparable or organic basis. The notes offered under Constellation’s commercial paper program have not been and will not be registered under the Securities Act of 1933 and may not be offered or sold in the U.S. absent registration or an applicable exemption from registration requirements. This presentation shall not constitute an offer to sell or the solicitation of an offer to buy Constellation’s notes under the commercial paper program. Unless otherwise indicated, the information presented at the 2022 Morgan Stanley Global Consumer & Retail Conference and herein is as of December 5, 2022, and, to the best of Constellation's knowledge, timely and accurate when made. Thereafter, it should be considered historical and not subject to further update by Constellation. The Conference presentation does not provide information regarding Constellation’s Fiscal 2023 third quarter results or financial condition. A list of defined terms used within can be found in the appendix of this presentation. | 4
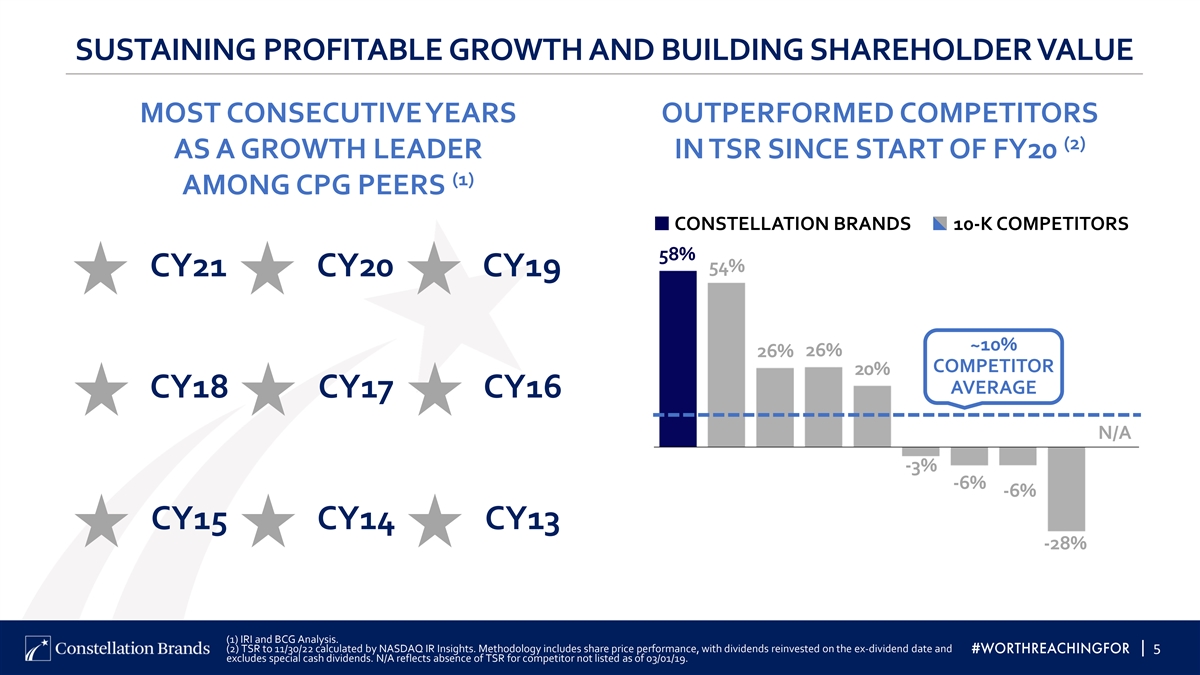
SUSTAINING PROFITABLE GROWTH AND BUILDING SHAREHOLDER VALUE MOST CONSECUTIVE YEARS OUTPERFORMED COMPETITORS (2) AS A GROWTH LEADER IN TSR SINCE START OF FY20 (1) AMONG CPG PEERS CONSTELLATION BRANDS 10-K COMPETITORS 58% 54% CY21 CY20 CY19 ~10% 26% 26% COMPETITOR 20% AVERAGE CY18 CY17 CY16 N/A -3% -6% -6% CY15 CY14 CY13 -28% (1) IRI and BCG Analysis. (2) TSR to 11/30/22 calculated by NASDAQ IR Insights. Methodology includes share price performance, with dividends reinvested on the ex-dividend date and | 5 excludes special cash dividends. N/A reflects absence of TSR for competitor not listed as of 03/01/19.
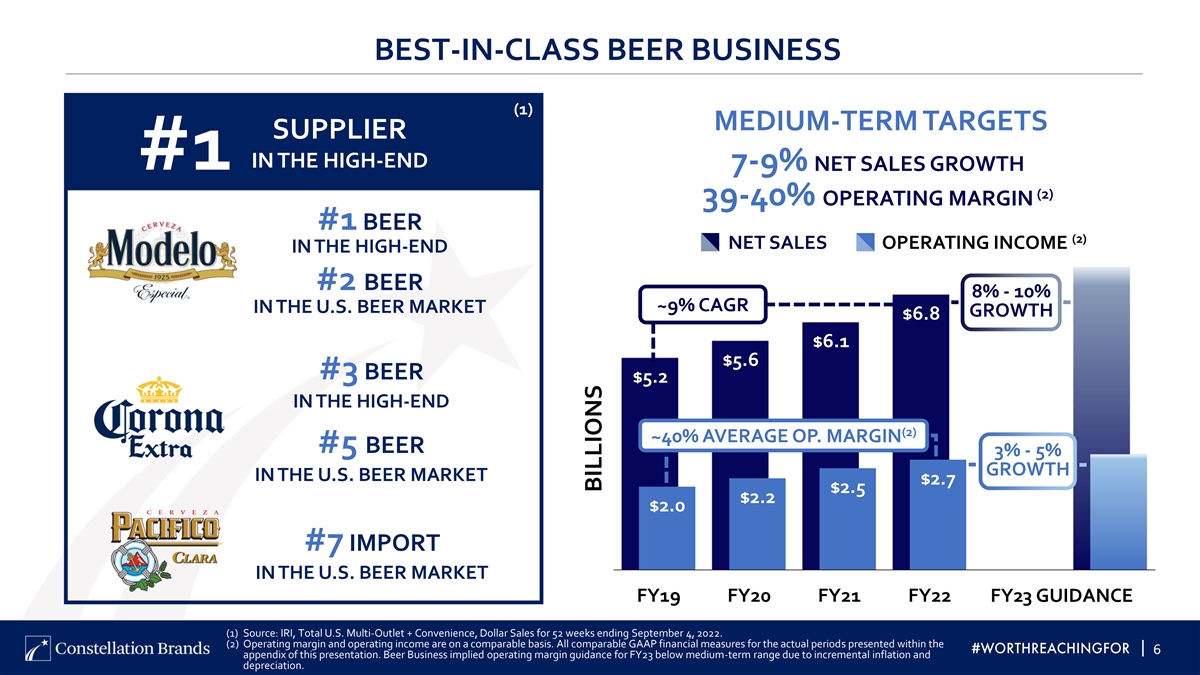
BEST-IN-CLASS BEER BUSINESS (1) MEDIUM-TERM TARGETS SUPPLIER IN THE HIGH-END #1 7-9% NET SALES GROWTH (2) 39-40% OPERATING MARGIN #1 BEER (2) NET SALES OPERATING INCOME IN THE HIGH-END #2 BEER 8% - 10% ~9% CAGR IN THE U.S. BEER MARKET GROWTH $6.8 $6.1 $5.6 #3 BEER $5.2 IN THE HIGH-END (2) ~40% AVERAGE OP. MARGIN #5 BEER 3% - 5% GROWTH IN THE U.S. BEER MARKET $2.7 $2.5 $2.2 $2.0 #7 IMPORT IN THE U.S. BEER MARKET FY19 FY20 FY21 FY22 FY23 GUIDANCE (1) Source: IRI, Total U.S. Multi-Outlet + Convenience, Dollar Sales for 52 weeks ending September 4, 2022. (2) Operating margin and operating income are on a comparable basis. All comparable GAAP financial measures for the actual periods presented within the | 6 appendix of this presentation. Beer Business implied operating margin guidance for FY23 below medium-term range due to incremental inflation and depreciation. BILLIONS
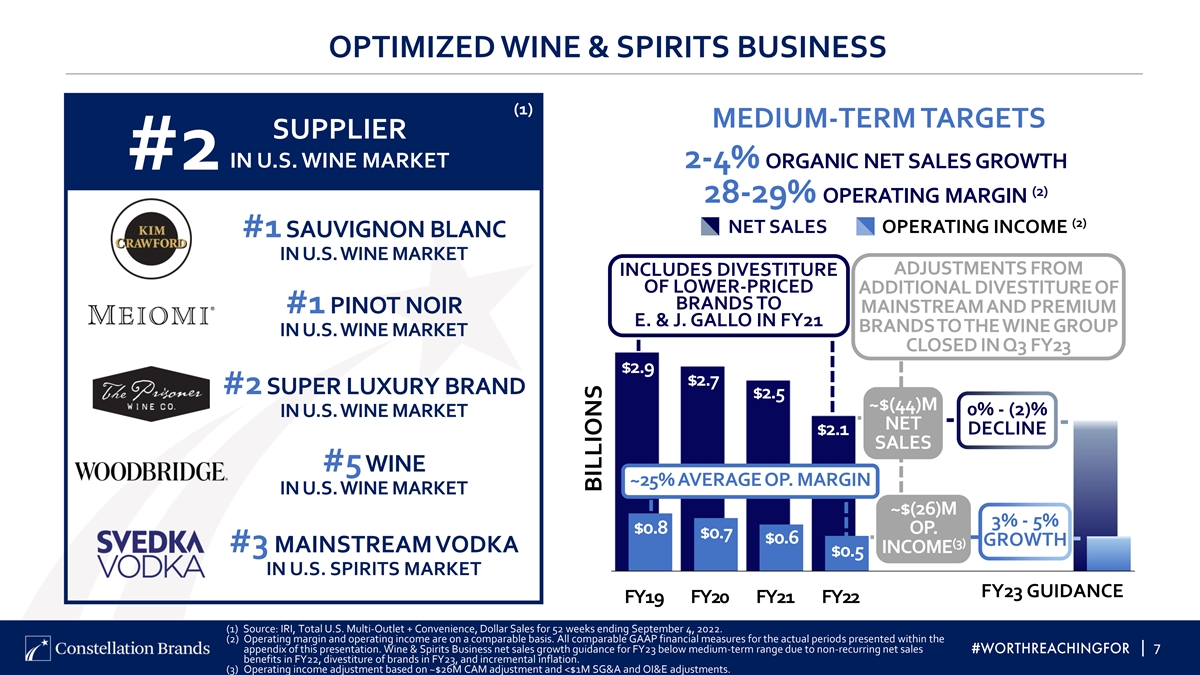
OPTIMIZED WINE & SPIRITS BUSINESS (1) MEDIUM-TERM TARGETS SUPPLIER IN U.S. WINE MARKET 2-4% ORGANIC NET SALES GROWTH #2 (2) 28-29% OPERATING MARGIN (2) NET SALES OPERATING INCOME #1 SAUVIGNON BLANC IN U.S. WINE MARKET ADJUSTMENTS FROM INCLUDES DIVESTITURE OF LOWER-PRICED ADDITIONAL DIVESTITURE OF BRANDS TO MAINSTREAM AND PREMIUM #1 PINOT NOIR E. & J. GALLO IN FY21 BRANDS TO THE WINE GROUP IN U.S. WINE MARKET CLOSED IN Q3 FY23 $2.9 $2.7 #2 SUPER LUXURY BRAND $2.5 ~$(44)M 0% - (2)% IN U.S. WINE MARKET NET $2.1 DECLINE SALES #5 WINE ~25% AVERAGE OP. MARGIN IN U.S. WINE MARKET ~$(26)M 3% - 5% $0.8 OP. $0.7 $0.6 GROWTH (3) #3 MAINSTREAM VODKA INCOME $0.5 IN U.S. SPIRITS MARKET FY23 GUIDANCE FY19 FY20 FY21 FY22 (1) Source: IRI, Total U.S. Multi-Outlet + Convenience, Dollar Sales for 52 weeks ending September 4, 2022. (2) Operating margin and operating income are on a comparable basis. All comparable GAAP financial measures for the actual periods presented within the appendix of this presentation. Wine & Spirits Business net sales growth guidance for FY23 below medium-term range due to non-recurring net sales | 7 benefits in FY22, divestiture of brands in FY23, and incremental inflation. (3) Operating income adjustment based on ~$26M CAM adjustment and <$1M SG&A and OI&E adjustments. BILLIONS
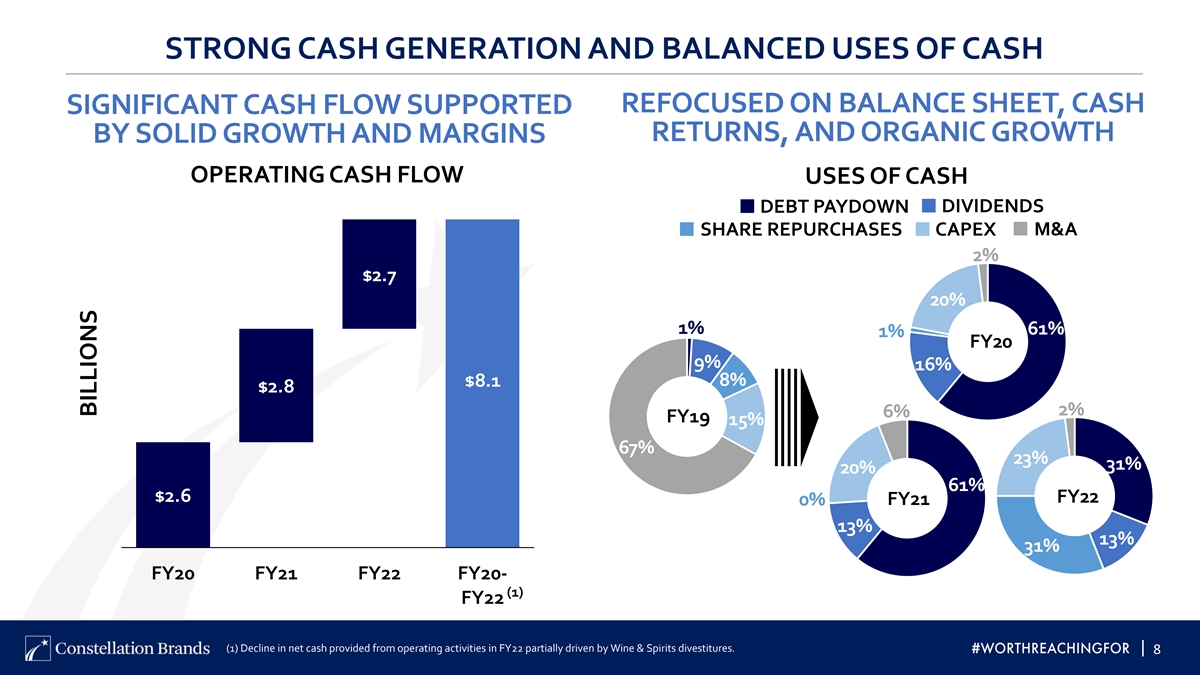
STRONG CASH GENERATION AND BALANCED USES OF CASH REFOCUSED ON BALANCE SHEET, CASH SIGNIFICANT CASH FLOW SUPPORTED RETURNS, AND ORGANIC GROWTH BY SOLID GROWTH AND MARGINS OPERATING CASH FLOW USES OF CASH DEBT PAYDOWN DIVIDENDS M&A SHARE REPURCHASES CAPEX 2% $2.7 20% 1% 61% 1% FY20 9% 16% 8% $8.1 $2.8 2% 6% FY19 15% 67% 23% 31% 20% 61% $2.6 FY22 FY21 0% 13% 13% 31% FY20 FY21 FY22 FY20- (1) FY22 (1) Decline in net cash provided from operating activities in FY22 partially driven by Wine & Spirits divestitures. | 8 BILLIONS
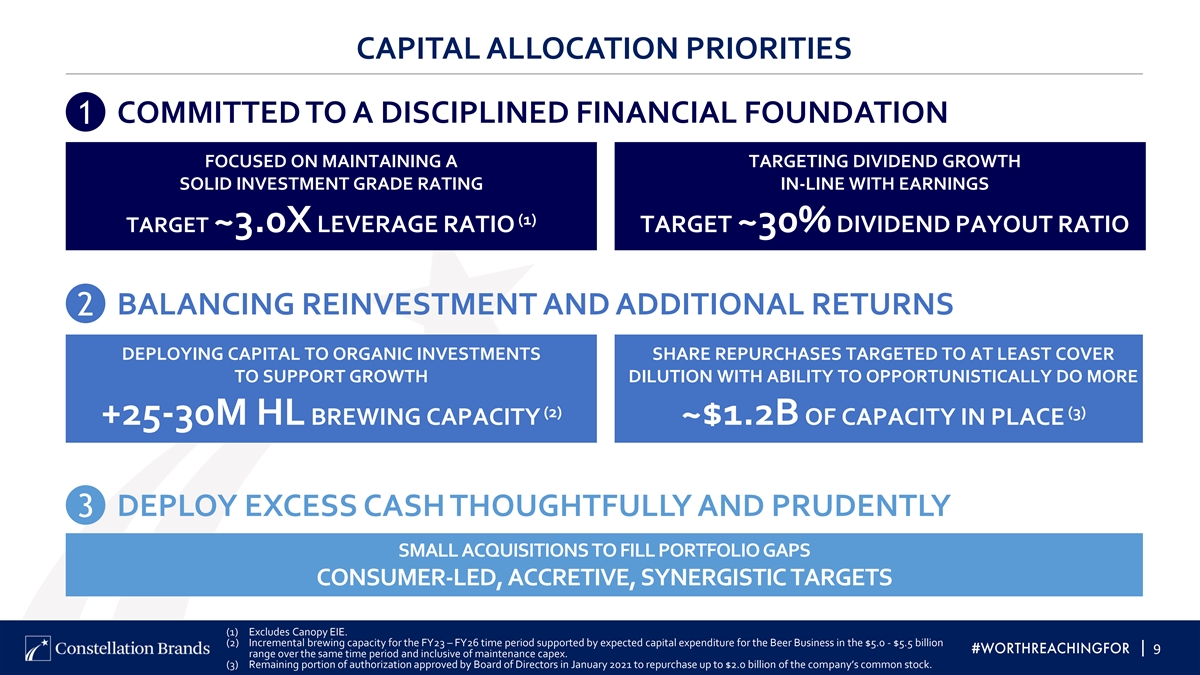
CAPITAL ALLOCATION PRIORITIES COMMITTED TO A DISCIPLINED FINANCIAL FOUNDATION 1 FOCUSED ON MAINTAINING A TARGETING DIVIDEND GROWTH SOLID INVESTMENT GRADE RATING IN-LINE WITH EARNINGS (1) TARGET ~3.0X LEVERAGE RATIO TARGET ~30% DIVIDEND PAYOUT RATIO BALANCING REINVESTMENT AND ADDITIONAL RETURNS 2 DEPLOYING CAPITAL TO ORGANIC INVESTMENTS SHARE REPURCHASES TARGETED TO AT LEAST COVER TO SUPPORT GROWTH DILUTION WITH ABILITY TO OPPORTUNISTICALLY DO MORE (2) (3) +25-30M HL BREWING CAPACITY ~$1.2B OF CAPACITY IN PLACE DEPLOY EXCESS CASH THOUGHTFULLY AND PRUDENTLY 3 SMALL ACQUISITIONS TO FILL PORTFOLIO GAPS CONSUMER-LED, ACCRETIVE, SYNERGISTIC TARGETS (1) Excludes Canopy EIE. (2) Incremental brewing capacity for the FY23 – FY26 time period supported by expected capital expenditure for the Beer Business in the $5.0 - $5.5 billion | 9 range over the same time period and inclusive of maintenance capex. (3) Remaining portion of authorization approved by Board of Directors in January 2021 to repurchase up to $2.0 billion of the company’s common stock.
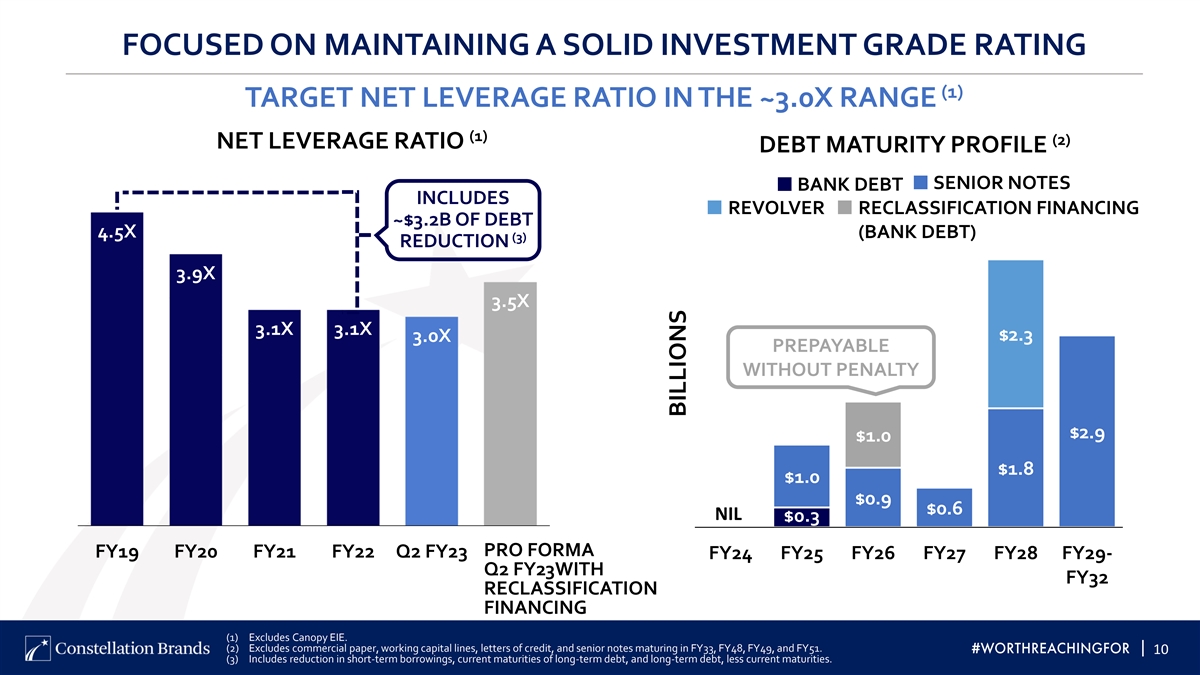
FOCUSED ON MAINTAINING A SOLID INVESTMENT GRADE RATING (1) TARGET NET LEVERAGE RATIO IN THE ~3.0X RANGE (1) (2) NET LEVERAGE RATIO DEBT MATURITY PROFILE SENIOR NOTES BANK DEBT INCLUDES REVOLVER RECLASSIFICATION FINANCING ~$3.2B OF DEBT 4.5X (BANK DEBT) (3) REDUCTION 3.9X 3.5X 3.1X 3.1X $2.3 3.0X PREPAYABLE WITHOUT PENALTY $2.9 $1.0 $1.8 $1.0 $0.9 $0.6 NIL $0.3 PRO FORMA FY19 FY20 FY21 FY22 Q2 FY23 PF W/ FY24 FY25 FY26 FY27 FY28 FY29- Q2 FY23WITH RC FY32 RECLASSIFICATION FINANCING (1) Excludes Canopy EIE. (2) Excludes commercial paper, working capital lines, letters of credit, and senior notes maturing in FY33, FY48, FY49, and FY51. | 10 (3) Includes reduction in short-term borrowings, current maturities of long-term debt, and long-term debt, less current maturities. BILLIONS
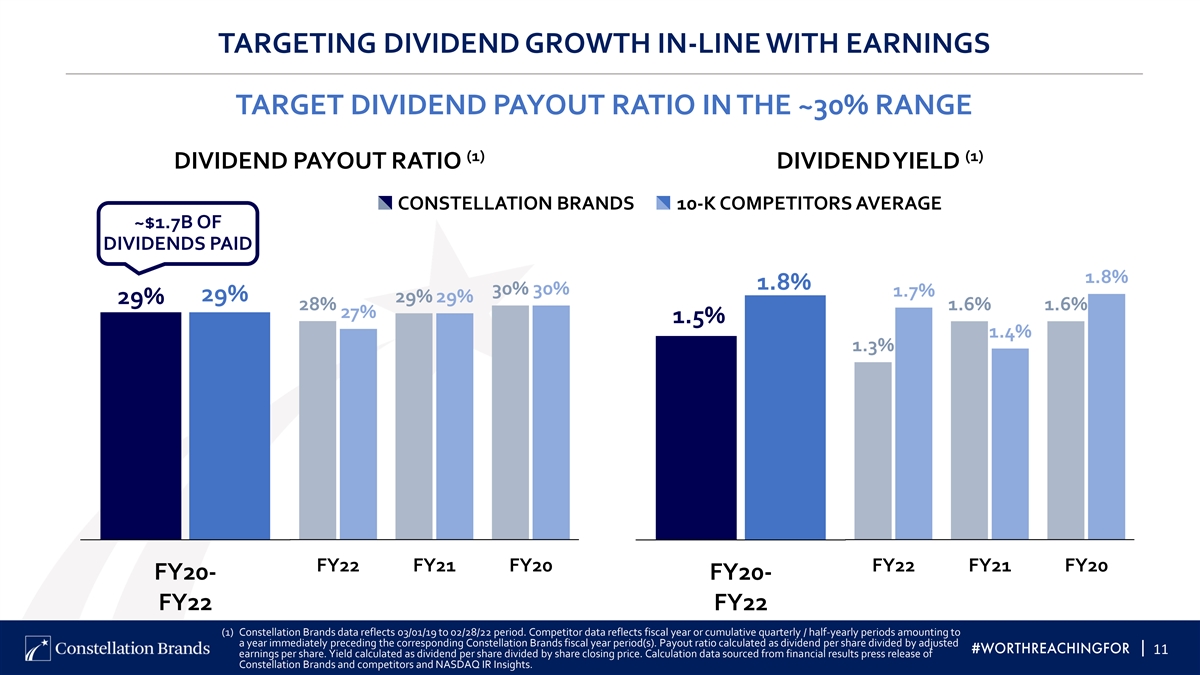
TARGETING DIVIDEND GROWTH IN-LINE WITH EARNINGS TARGET DIVIDEND PAYOUT RATIO IN THE ~30% RANGE (1) (1) DIVIDEND PAYOUT RATIO DIVIDEND YIELD CONSTELLATION BRANDS 10-K COMPETITORS AVERAGE ~$1.7B OF DIVIDENDS PAID 1.8% 1.8% 30% 30% 1.7% 29% 29% 29% 29% 28% 1.6% 1.6% 27% 1.5% 1.4% 1.3% FY22 FY21 FY20 FY22 FY21 FY20 FY20- FY20- FY22 FY22 (1) Constellation Brands data reflects 03/01/19 to 02/28/22 period. Competitor data reflects fiscal year or cumulative quarterly / half-yearly periods amounting to a year immediately preceding the corresponding Constellation Brands fiscal year period(s). Payout ratio calculated as dividend per share divided by adjusted | 11 earnings per share. Yield calculated as dividend per share divided by share closing price. Calculation data sourced from financial results press release of Constellation Brands and competitors and NASDAQ IR Insights.
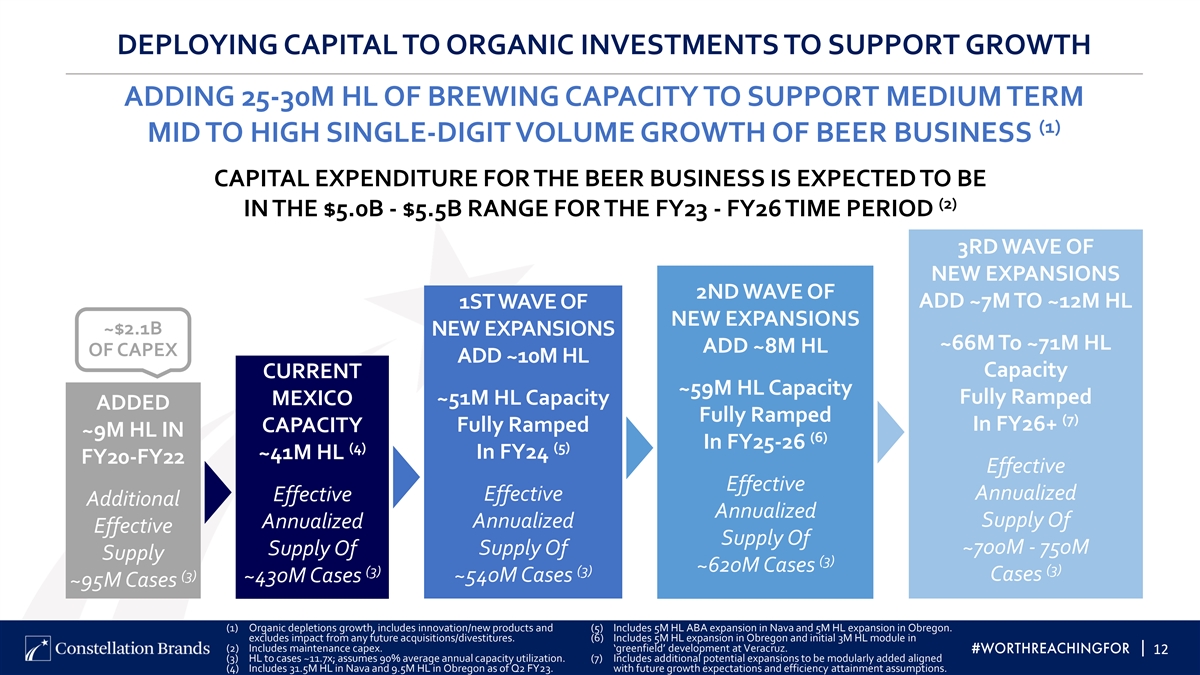
DEPLOYING CAPITAL TO ORGANIC INVESTMENTS TO SUPPORT GROWTH ADDING 25-30M HL OF BREWING CAPACITY TO SUPPORT MEDIUM TERM (1) MID TO HIGH SINGLE-DIGIT VOLUME GROWTH OF BEER BUSINESS CAPITAL EXPENDITURE FOR THE BEER BUSINESS IS EXPECTED TO BE (2) IN THE $5.0B - $5.5B RANGE FOR THE FY23 - FY26 TIME PERIOD 3RD WAVE OF NEW EXPANSIONS 2ND WAVE OF ADD ~7M TO ~12M HL 1ST WAVE OF NEW EXPANSIONS ~$2.1B NEW EXPANSIONS ~66M To ~71M HL ADD ~8M HL OF CAPEX ADD ~10M HL Capacity CURRENT ~59M HL Capacity Fully Ramped MEXICO ~51M HL Capacity ADDED Fully Ramped (7) In FY26+ CAPACITY Fully Ramped ~9M HL IN (6) In FY25-26 (4) (5) In FY24 ~41M HL FY20-FY22 Effective Effective Annualized Effective Effective Additional Annualized Annualized Supply Of Annualized Effective Supply Of ~700M - 750M Supply Of Supply Of Supply (3) ~620M Cases (3) (3) (3) (3) Cases ~430M Cases ~540M Cases ~95M Cases (1) Organic depletions growth, includes innovation/new products and (5) Includes 5M HL ABA expansion in Nava and 5M HL expansion in Obregon. excludes impact from any future acquisitions/divestitures. (6) Includes 5M HL expansion in Obregon and initial 3M HL module in (2) Includes maintenance capex. ‘greenfield’ development at Veracruz. | 12 12 (3) HL to cases ~11.7x; assumes 90% average annual capacity utilization. (7) Includes additional potential expansions to be modularly added aligned (4) Includes 31.5M HL in Nava and 9.5M HL in Obregon as of Q2 FY23. with future growth expectations and efficiency attainment assumptions.
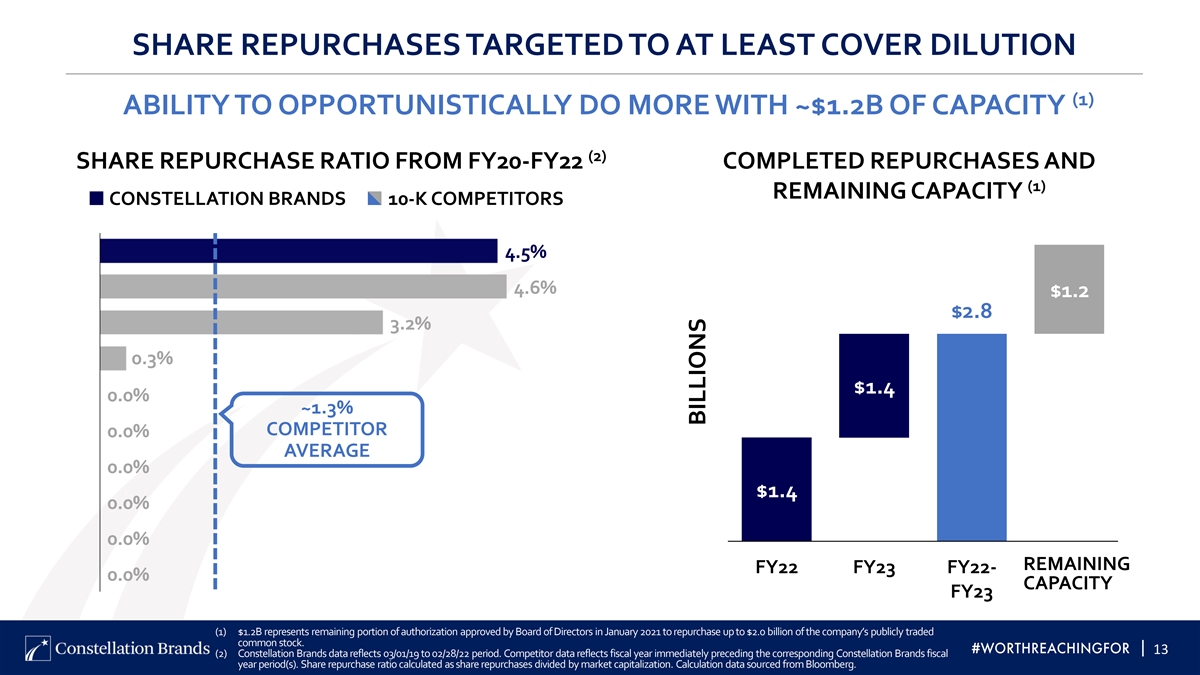
SHARE REPURCHASES TARGETED TO AT LEAST COVER DILUTION (1) ABILITY TO OPPORTUNISTICALLY DO MORE WITH ~$1.2B OF CAPACITY (2) SHARE REPURCHASE RATIO FROM FY20-FY22 COMPLETED REPURCHASES AND (1) REMAINING CAPACITY CONSTELLATION BRANDS 10-K COMPETITORS 4.5% 4.6% $1.2 $2.8 3.2% 0.3% $1.4 0.0% ~1.3% COMPETITOR 0.0% AVERAGE 0.0% $1.4 0.0% 0.0% REMAINING FY22 FY23 FY22- AUTHO 0.0% CAPACITY FY23 (1) $1.2B represents remaining portion of authorization approved by Board of Directors in January 2021 to repurchase up to $2.0 billion of the company’s publicly traded common stock. | 13 (2) Constellation Brands data reflects 03/01/19 to 02/28/22 period. Competitor data reflects fiscal year immediately preceding the corresponding Constellation Brands fiscal year period(s). Share repurchase ratio calculated as share repurchases divided by market capitalization. Calculation data sourced from Bloomberg. BILLIONS
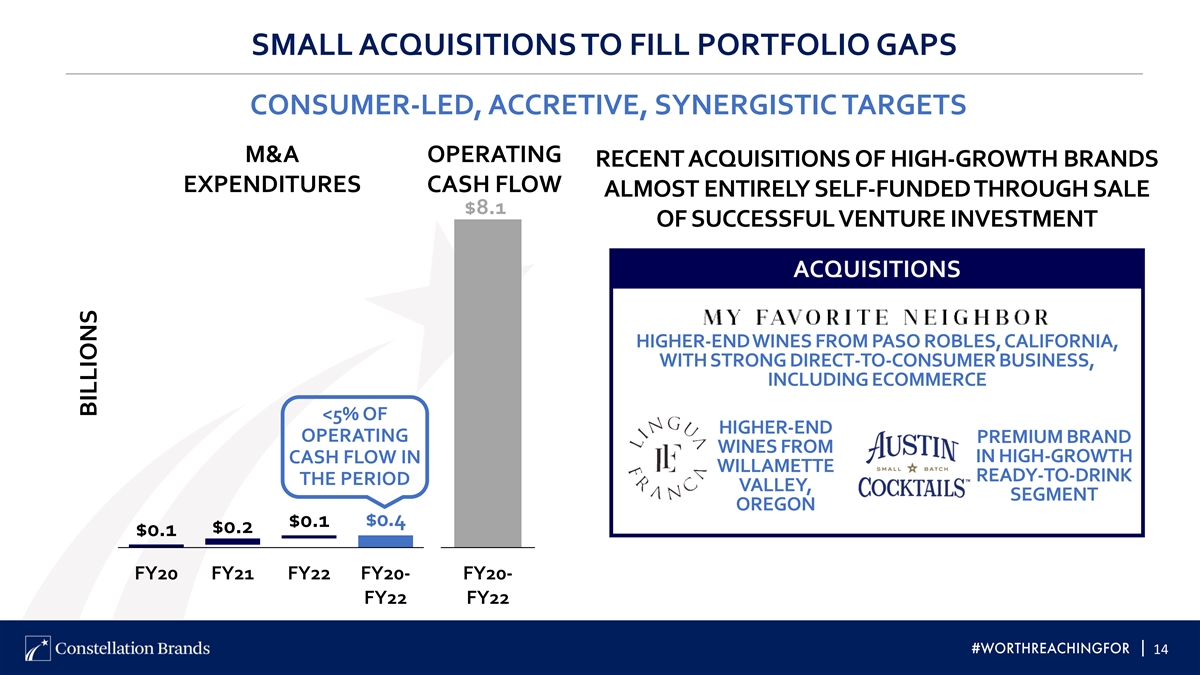
SMALL ACQUISITIONS TO FILL PORTFOLIO GAPS CONSUMER-LED, ACCRETIVE, SYNERGISTIC TARGETS M&A OPERATING RECENT ACQUISITIONS OF HIGH-GROWTH BRANDS EXPENDITURES CASH FLOW ALMOST ENTIRELY SELF-FUNDED THROUGH SALE $8.1 OF SUCCESSFUL VENTURE INVESTMENT ACQUISITIONS HIGHER-END WINES FROM PASO ROBLES, CALIFORNIA, WITH STRONG DIRECT-TO-CONSUMER BUSINESS, INCLUDING ECOMMERCE <5% OF HIGHER-END OPERATING PREMIUM BRAND WINES FROM IN HIGH-GROWTH CASH FLOW IN WILLAMETTE READY-TO-DRINK THE PERIOD VALLEY, SEGMENT OREGON $0.4 $0.1 $0.2 $0.1 FY20 FY21 FY22 FY20- FY20- FY22 FY22 | 14 BILLIONS

THANK YOU | 15
APPENDIX DEFINED TERMS & ADDITIONAL FINANCIAL INFORMATION |
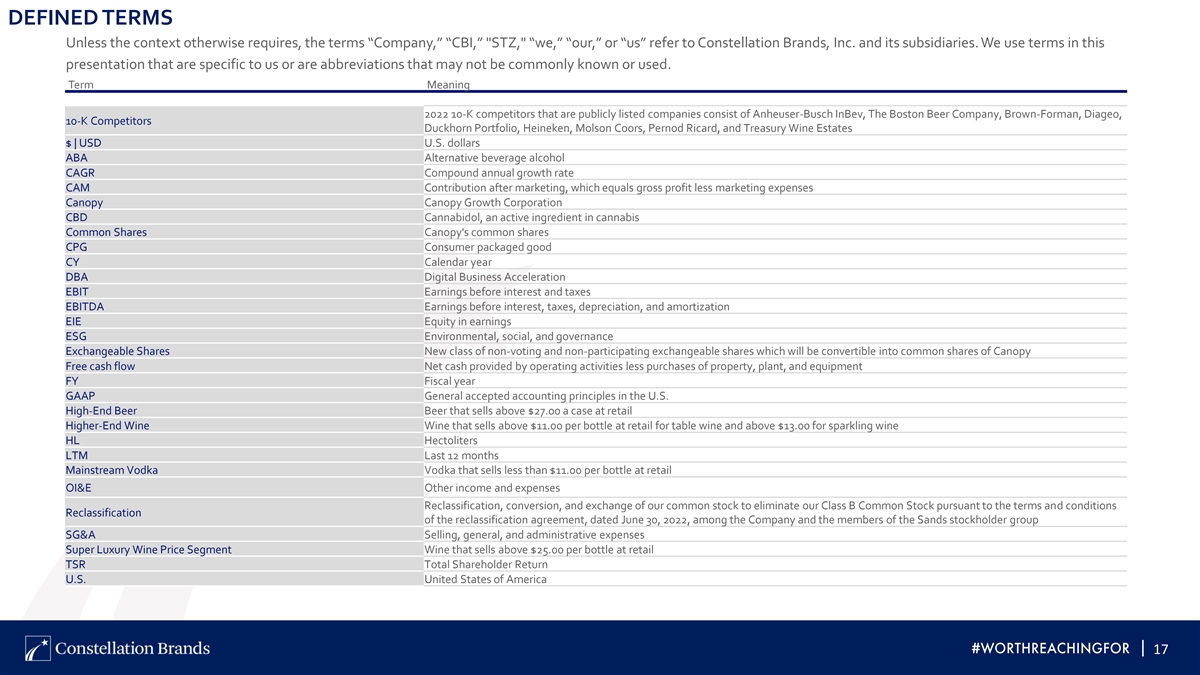
DEFINED TERMS Unless the context otherwise requires, the terms “Company,” “CBI,” STZ, “we,” “our,” or “us” refer to Constellation Brands, Inc. and its subsidiaries. We use terms in this presentation that are specific to us or are abbreviations that may not be commonly known or used. Term Meaning 2022 10-K competitors that are publicly listed companies consist of Anheuser-Busch InBev, The Boston Beer Company, Brown-Forman, Diageo, 10-K Competitors Duckhorn Portfolio, Heineken, Molson Coors, Pernod Ricard, and Treasury Wine Estates $ | USD U.S. dollars ABA Alternative beverage alcohol CAGR Compound annual growth rate CAM Contribution after marketing, which equals gross profit less marketing expenses Canopy Canopy Growth Corporation CBD Cannabidol, an active ingredient in cannabis Common Shares Canopy's common shares CPG Consumer packaged good CY Calendar year DBA Digital Business Acceleration EBIT Earnings before interest and taxes EBITDA Earnings before interest, taxes, depreciation, and amortization EIE Equity in earnings ESG Environmental, social, and governance Exchangeable Shares New class of non-voting and non-participating exchangeable shares which will be convertible into common shares of Canopy Free cash flow Net cash provided by operating activities less purchases of property, plant, and equipment FY Fiscal year GAAP General accepted accounting principles in the U.S. High-End Beer Beer that sells above $27.00 a case at retail Higher-End Wine Wine that sells above $11.00 per bottle at retail for table wine and above $13.00 for sparkling wine HL Hectoliters LTM Last 12 months Mainstream Vodka Vodka that sells less than $11.00 per bottle at retail OI&E Other income and expenses Reclassification, conversion, and exchange of our common stock to eliminate our Class B Common Stock pursuant to the terms and conditions Reclassification of the reclassification agreement, dated June 30, 2022, among the Company and the members of the Sands stockholder group SG&A Selling, general, and administrative expenses Super Luxury Wine Price Segment Wine that sells above $25.00 per bottle at retail TSR Total Shareholder Return U.S. United States of America | 17
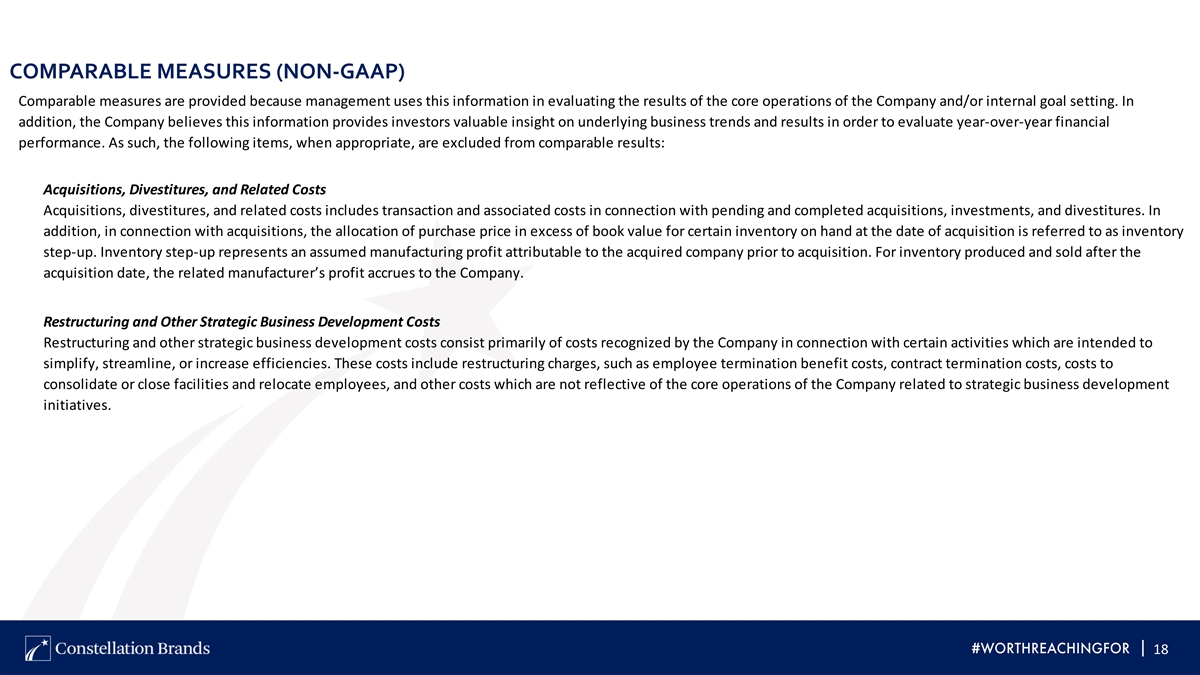
COMPARABLE MEASURES (NON-GAAP) Comparable measures are provided because management uses this information in evaluating the results of the core operations of the Company and/or internal goal setting. In addition, the Company believes this information provides investors valuable insight on underlying business trends and results in order to evaluate year-over-year financial performance. As such, the following items, when appropriate, are excluded from comparable results: Acquisitions, Divestitures, and Related Costs Acquisitions, divestitures, and related costs includes transaction and associated costs in connection with pending and completed acquisitions, investments, and divestitures. In addition, in connection with acquisitions, the allocation of purchase price in excess of book value for certain inventory on hand at the date of acquisition is referred to as inventory step-up. Inventory step-up represents an assumed manufacturing profit attributable to the acquired company prior to acquisition. For inventory produced and sold after the acquisition date, the related manufacturer’s profit accrues to the Company. Restructuring and Other Strategic Business Development Costs Restructuring and other strategic business development costs consist primarily of costs recognized by the Company in connection with certain activities which are intended to simplify, streamline, or increase efficiencies. These costs include restructuring charges, such as employee termination benefit costs, contract termination costs, costs to consolidate or close facilities and relocate employees, and other costs which are not reflective of the core operations of the Company related to strategic business development initiatives. | 18
COMPARABLE MEASURES (NON-GAAP) Other Other includes items that are not specifically related to acquisitions and divestitures or restructuring and other strategic business development costs (e.g. unrealized net (gain) loss on securities measured at fair value, loss on extinguishment of debt, impairment of assets, loss on contract termination, and net (gain) loss from the mark to fair value of undesignated commodity derivative contracts prior to settlement). Comparable Basis Earnings before Interest and Taxes ( Comparable Basis EBIT ), as used by the Company, means net income (loss) attributable to CBI plus (i) net income (loss) attributable to noncontrolling interests, (ii) provision for (benefit from) income taxes, and (iii) interest expense, all on a comparable basis. Comparable Basis EBIT is considered a performance measure and the Company considers net income (loss) attributable to CBI the most comparable GAAP measure. Comparable Basis EBIT is used by management in evaluating the results of the core operations of the Company including, the results of its equity method investments. In addition, the Company believes this information provides investors valuable insight on underlying business trends and results in order to evaluate year-over-year financial performance. The Company has disclosed its debt to Earnings before Interest, Taxes, Depreciation, and Amortization ( EBITDA ) ratio and net debt to EBITDA ratio. These are non-GAAP financial measures that management believes are of interest to investors and lenders in relation to the Company's overall capital structure and its ability to borrow additional funds. The Company considers EBITDA a measure of liquidity and considers net cash provided by operating activities the most comparable GAAP measure. Free cash flow as used by the Company means the Company's net cash flow from operating activities prepared in accordance with GAAP less capital expenditures for property, plant, and equipment. Free cash flow is considered a liquidity measure and provides useful information to investors about the amount of cash generated, which can then be used, after required debt service and dividend payments, for other general corporate purposes. A limitation of free cash flow is that it does not represent the total increase or decrease in the cash balance for the period. Free cash flow should be considered in addition to, not as a substitute for, or superior to, cash flow from operating activities prepared in accordance with GAAP. | 19
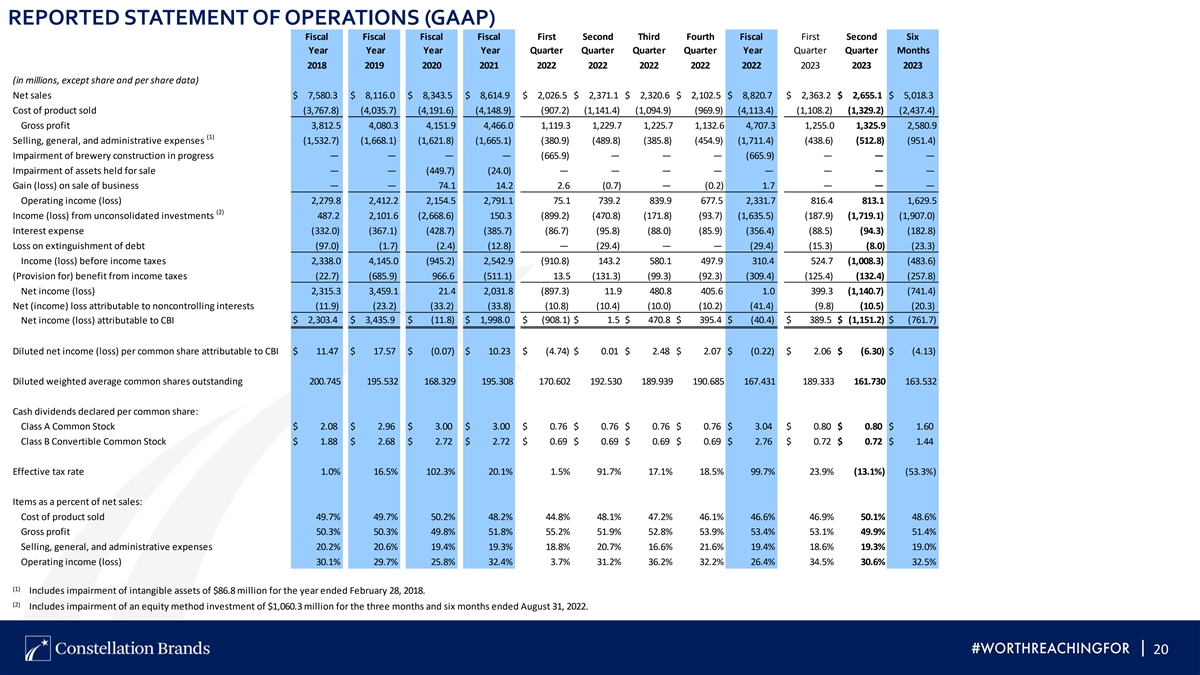
REPORTED STATEMENT OF OPERATIONS (GAAP) Fiscal Fiscal Fiscal Fiscal First Second Third Fourth Fiscal First Second Six Year Year Year Year Quarter Quarter Quarter Quarter Year Quarter Quarter Months 2018 2019 2020 2021 2022 2022 2022 2022 2022 2023 2023 2023 (in millions, except share and per share data) Net sales $ 7,580.3 $ 8,116.0 $ 8,343.5 $ 8,614.9 $ 2,026.5 $ 2,371.1 $ 2,320.6 $ 2,102.5 $ 8,820.7 $ 2,363.2 $ 2,655.1 $ 5,018.3 Cost of product sold (3,767.8) (4,035.7) (4,191.6) (4,148.9) (907.2) (1,141.4) (1,094.9) (969.9) (4,113.4) (1,108.2) (1,329.2) (2,437.4) Gross profit 3,812.5 4,080.3 4,151.9 4,466.0 1,119.3 1,229.7 1,225.7 1,132.6 4,707.3 1,255.0 1,325.9 2,580.9 (1) Selling, general, and administrative expenses (1,532.7) (1,668.1) (1,621.8) (1,665.1) (380.9) (489.8) (385.8) (454.9) (1,711.4) (438.6) (512.8) (951.4) Impairment of brewery construction in progress — — — — (665.9) — — — (665.9) — — — Impairment of assets held for sale — — (449.7) (24.0) — — — — — — — — Gain (loss) on sale of business — — 74.1 14.2 2.6 (0.7) — (0.2) 1.7 — — — Operating income (loss) 2,279.8 2,412.2 2,154.5 2,791.1 75.1 739.2 839.9 677.5 2,331.7 816.4 813.1 1,629.5 (2) Income (loss) from unconsolidated investments 487.2 2,101.6 (2,668.6) 150.3 (899.2) (470.8) (171.8) (93.7) (1,635.5) (187.9) (1,719.1) (1,907.0) Interest expense (332.0) (367.1) (428.7) (385.7) (86.7) (95.8) (88.0) (85.9) (356.4) (88.5) (94.3) (182.8) Loss on extinguishment of debt (97.0) (1.7) (2.4) (12.8) — (29.4) — — (29.4) (15.3) (8.0) (23.3) Income (loss) before income taxes 2,338.0 4,145.0 (945.2) 2,542.9 (910.8) 143.2 580.1 497.9 310.4 524.7 (1,008.3) (483.6) (Provision for) benefit from income taxes (22.7) (685.9) 966.6 (511.1) 13.5 (131.3) (99.3) (92.3) (309.4) (125.4) (132.4) (257.8) Net income (loss) 2,315.3 3,459.1 21.4 2,031.8 (897.3) 11.9 480.8 405.6 1.0 399.3 (1,140.7) (741.4) Net (income) loss attributable to noncontrolling interests (11.9) (23.2) (33.2) (33.8) (10.8) (10.4) (10.0) (10.2) (41.4) (9.8) (10.5) (20.3) Net income (loss) attributable to CBI $ 2,303.4 $ 3,435.9 $ (11.8) $ 1,998.0 $ (908.1) $ 1.5 $ 470.8 $ 395.4 $ (40.4) $ 389.5 $ (1,151.2) $ (761.7) Diluted net income (loss) per common share attributable to CBI $ 11.47 $ 17.57 $ (0.07) $ 10.23 $ (4.74) $ 0.01 $ 2.48 $ 2.07 $ (0.22) $ 2.06 $ (6.30) $ (4.13) Diluted weighted average common shares outstanding 200.745 195.532 168.329 195.308 170.602 192.530 189.939 190.685 167.431 189.333 161.730 163.532 Cash dividends declared per common share: Class A Common Stock $ 2.08 $ 2.96 $ 3.00 $ 3.00 $ 0.76 $ 0.76 $ 0.76 $ 0.76 $ 3.04 $ 0.80 $ 0.80 $ 1.60 Class B Convertible Common Stock $ 1.88 $ 2.68 $ 2.72 $ 2.72 $ 0.69 $ 0.69 $ 0.69 $ 0.69 $ 2.76 $ 0.72 $ 0.72 $ 1.44 Effective tax rate 1.0% 16.5% 102.3% 20.1% 1.5% 91.7% 17.1% 18.5% 99.7% 23.9% (13.1%) (53.3%) Items as a percent of net sales: Cost of product sold 49.7% 49.7% 50.2% 48.2% 44.8% 48.1% 47.2% 46.1% 46.6% 46.9% 50.1% 48.6% Gross profit 50.3% 50.3% 49.8% 51.8% 55.2% 51.9% 52.8% 53.9% 53.4% 53.1% 49.9% 51.4% Selling, general, and administrative expenses 20.2% 20.6% 19.4% 19.3% 18.8% 20.7% 16.6% 21.6% 19.4% 18.6% 19.3% 19.0% Operating income (loss) 30.1% 29.7% 25.8% 32.4% 3.7% 31.2% 36.2% 32.2% 26.4% 34.5% 30.6% 32.5% (1) Includes impairment of intangible assets of $86.8 million for the year ended February 28, 2018. (2) Includes impairment of an equity method investment of $1,060.3 million for the three months and six months ended August 31, 2022. | 20
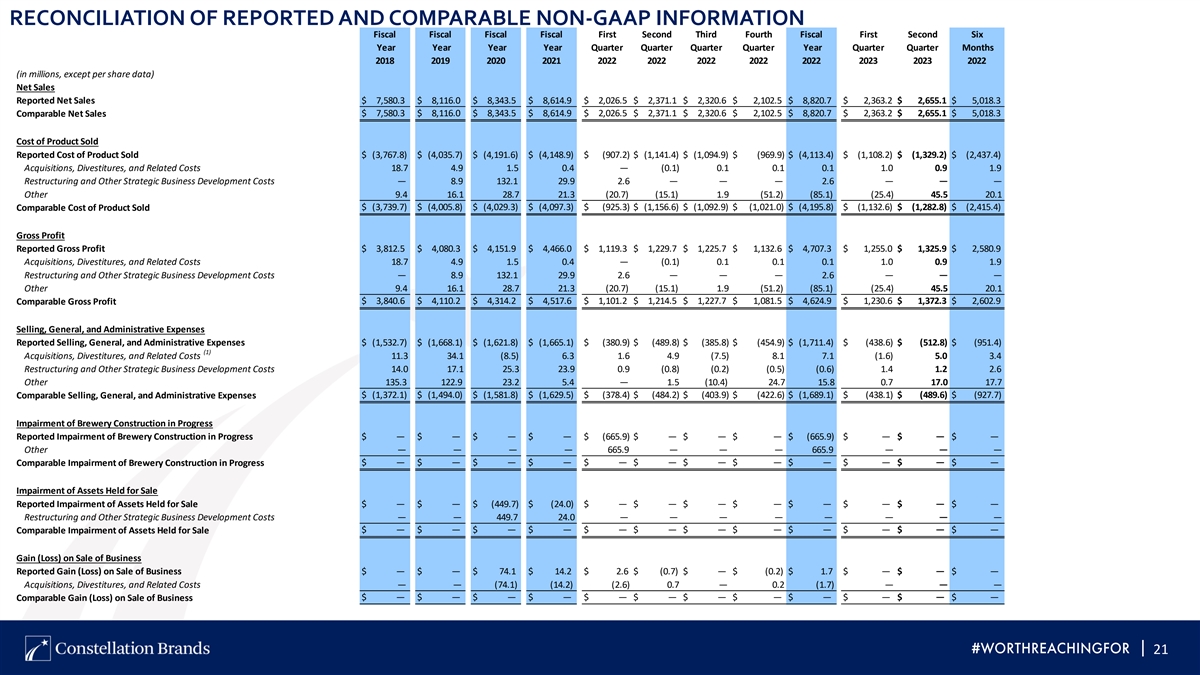
RECONCILIATION OF REPORTED AND COMPARABLE NON-GAAP INFORMATION Fiscal Fiscal Fiscal Fiscal First Second Third Fourth Fiscal First Second Six Year Year Year Year Quarter Quarter Quarter Quarter Year Quarter Quarter Months 2018 2019 2020 2021 2022 2022 2022 2022 2022 2023 2023 2022 (in millions, except per share data) Net Sales Reported Net Sales $ 7,580.3 $ 8,116.0 $ 8,343.5 $ 8,614.9 $ 2,026.5 $ 2,371.1 $ 2,320.6 $ 2,102.5 $ 8,820.7 $ 2,363.2 $ 2,655.1 $ 5,018.3 $ 7,580.3 $ 8,116.0 $ 8,343.5 $ 8,614.9 $ 2,026.5 $ 2,371.1 $ 2,320.6 $ 2,102.5 $ 8,820.7 $ 2,363.2 $ 2,655.1 $ 5,018.3 Comparable Net Sales Cost of Product Sold Reported Cost of Product Sold $ (3,767.8) $ (4,035.7) $ (4,191.6) $ (4,148.9) $ (907.2) $ (1,141.4) $ (1,094.9) $ (969.9) $ (4,113.4) $ (1,108.2) $ (1,329.2) $ (2,437.4) Acquisitions, Divestitures, and Related Costs 18.7 4.9 1.5 0.4 — (0.1) 0.1 0.1 0.1 1.0 0.9 1.9 Restructuring and Other Strategic Business Development Costs — 8.9 132.1 29.9 2.6 — — — 2.6 — — — Other 9.4 16.1 28.7 21.3 (20.7) (15.1) 1.9 (51.2) (85.1) (25.4) 45.5 20.1 $ (3,739.7) $ (4,005.8) $ (4,029.3) $ (4,097.3) $ (925.3) $ (1,156.6) $ (1,092.9) $ (1,021.0) $ (4,195.8) $ (1,132.6) $ (1,282.8) $ (2,415.4) Comparable Cost of Product Sold Gross Profit Reported Gross Profit $ 3,812.5 $ 4,080.3 $ 4,151.9 $ 4,466.0 $ 1,119.3 $ 1,229.7 $ 1,225.7 $ 1,132.6 $ 4,707.3 $ 1,255.0 $ 1,325.9 $ 2,580.9 Acquisitions, Divestitures, and Related Costs 18.7 4.9 1.5 0.4 — (0.1) 0.1 0.1 0.1 1.0 0.9 1.9 Restructuring and Other Strategic Business Development Costs — 8.9 132.1 29.9 2.6 — — — 2.6 — — — Other 9.4 16.1 28.7 21.3 (20.7) (15.1) 1.9 (51.2) (85.1) (25.4) 45.5 20.1 $ 3,840.6 $ 4,110.2 $ 4,314.2 $ 4,517.6 $ 1,101.2 $ 1,214.5 $ 1,227.7 $ 1,081.5 $ 4,624.9 $ 1,230.6 $ 1,372.3 $ 2,602.9 Comparable Gross Profit Selling, General, and Administrative Expenses Reported Selling, General, and Administrative Expenses $ (1,532.7) $ (1,668.1) $ (1,621.8) $ (1,665.1) $ (380.9) $ (489.8) $ (385.8) $ (454.9) $ (1,711.4) $ (438.6) $ (512.8) $ (951.4) (1) Acquisitions, Divestitures, and Related Costs 11.3 34.1 (8.5) 6.3 1.6 4.9 (7.5) 8.1 7.1 (1.6) 5.0 3.4 Restructuring and Other Strategic Business Development Costs 14.0 17.1 25.3 23.9 0.9 (0.8) (0.2) (0.5) (0.6) 1.4 1.2 2.6 Other 135.3 122.9 23.2 5.4 — 1.5 (10.4) 24.7 15.8 0.7 17.0 17.7 $ (1,372.1) $ (1,494.0) $ (1,581.8) $ (1,629.5) $ (378.4) $ (484.2) $ (403.9) $ (422.6) $ (1,689.1) $ (438.1) $ (489.6) $ (927.7) Comparable Selling, General, and Administrative Expenses Impairment of Brewery Construction in Progress Reported Impairment of Brewery Construction in Progress $ — $ — $ — $ — $ (665.9) $ — $ — $ — $ (665.9) $ — $ — $ — Other — — — — 665.9 — — — 665.9 — — — $ — $ — $ — $ — $ — $ — $ — $ — $ — $ — $ — $ — Comparable Impairment of Brewery Construction in Progress Impairment of Assets Held for Sale Reported Impairment of Assets Held for Sale $ — $ — $ (449.7) $ (24.0) $ — $ — $ — $ — $ — $ — $ — $ — Restructuring and Other Strategic Business Development Costs — — 449.7 24.0 — — — — — — — — $ — $ — $ — $ — $ — $ — $ — $ — $ — $ — $ — $ — Comparable Impairment of Assets Held for Sale Gain (Loss) on Sale of Business Reported Gain (Loss) on Sale of Business $ — $ — $ 74.1 $ 14.2 $ 2.6 $ (0.7) $ — $ (0.2) $ 1.7 $ — $ — $ — Acquisitions, Divestitures, and Related Costs — — (74.1) (14.2) (2.6) 0.7 — 0.2 (1.7) — — — $ — $ — $ — $ — $ — $ — $ — $ — $ — $ — $ — $ — Comparable Gain (Loss) on Sale of Business | 21
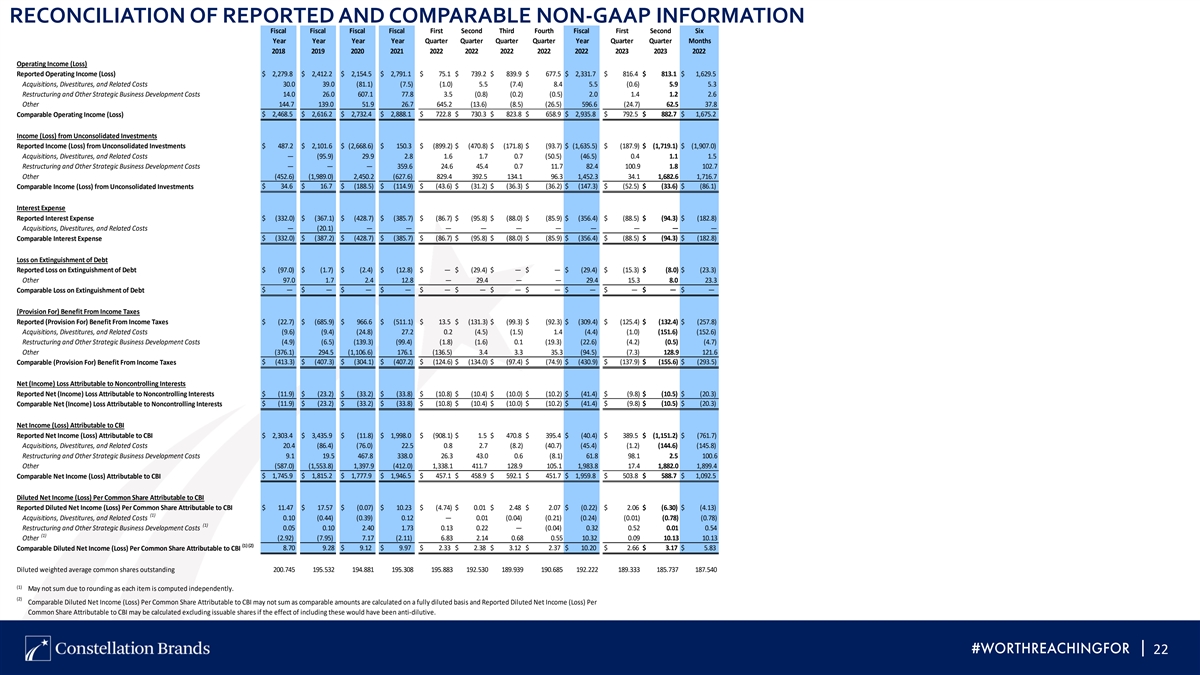
RECONCILIATION OF REPORTED AND COMPARABLE NON-GAAP INFORMATION Fiscal Fiscal Fiscal Fiscal First Second Third Fourth Fiscal First Second Six Year Year Year Year Quarter Quarter Quarter Quarter Year Quarter Quarter Months 2018 2019 2020 2021 2022 2022 2022 2022 2022 2023 2023 2022 Operating Income (Loss) Reported Operating Income (Loss) $ 2,279.8 $ 2,412.2 $ 2,154.5 $ 2,791.1 $ 75.1 $ 739.2 $ 839.9 $ 677.5 $ 2,331.7 $ 816.4 $ 813.1 $ 1,629.5 Acquisitions, Divestitures, and Related Costs 30.0 39.0 (81.1) (7.5) (1.0) 5.5 (7.4) 8.4 5.5 (0.6) 5.9 5.3 Restructuring and Other Strategic Business Development Costs 14.0 26.0 607.1 77.8 3.5 (0.8) (0.2) (0.5) 2.0 1.4 1.2 2.6 Other 144.7 139.0 51.9 26.7 645.2 (13.6) (8.5) (26.5) 596.6 (24.7) 62.5 37.8 $ 2,468.5 $ 2,616.2 $ 2,732.4 $ 2,888.1 $ 722.8 $ 730.3 $ 823.8 $ 658.9 $ 2,935.8 $ 792.5 $ 882.7 $ 1,675.2 Comparable Operating Income (Loss) Income (Loss) from Unconsolidated Investments Reported Income (Loss) from Unconsolidated Investments $ 487.2 $ 2,101.6 $ (2,668.6) $ 150.3 $ (899.2) $ (470.8) $ (171.8) $ (93.7) $ (1,635.5) $ (187.9) $ (1,719.1) $ (1,907.0) Acquisitions, Divestitures, and Related Costs — (95.9) 29.9 2.8 1.6 1.7 0.7 (50.5) (46.5) 0.4 1.1 1.5 Restructuring and Other Strategic Business Development Costs — — — 359.6 24.6 45.4 0.7 11.7 82.4 100.9 1.8 102.7 Other (452.6) (1,989.0) 2,450.2 (627.6) 829.4 392.5 134.1 96.3 1,452.3 34.1 1,682.6 1,716.7 Comparable Income (Loss) from Unconsolidated Investments $ 34.6 $ 16.7 $ (188.5) $ (114.9) $ (43.6) $ (31.2) $ (36.3) $ (36.2) $ (147.3) $ (52.5) $ (33.6) $ (86.1) Interest Expense Reported Interest Expense $ (332.0) $ (367.1) $ (428.7) $ (385.7) $ (86.7) $ (95.8) $ (88.0) $ (85.9) $ (356.4) $ (88.5) $ (94.3) $ (182.8) Acquisitions, Divestitures, and Related Costs — (20.1) — — — — — — — — — — $ (332.0) $ (387.2) $ (428.7) $ (385.7) $ (86.7) $ (95.8) $ (88.0) $ (85.9) $ (356.4) $ (88.5) $ (94.3) $ (182.8) Comparable Interest Expense Loss on Extinguishment of Debt Reported Loss on Extinguishment of Debt $ (97.0) $ (1.7) $ (2.4) $ (12.8) $ — $ (29.4) $ — $ — $ (29.4) $ (15.3) $ (8.0) $ (23.3) Other 97.0 1.7 2.4 12.8 — 29.4 — — 29.4 15.3 8.0 23.3 Comparable Loss on Extinguishment of Debt $ — $ — $ — $ — $ — $ — $ — $ — $ — $ — $ — $ — (Provision For) Benefit From Income Taxes Reported (Provision For) Benefit From Income Taxes $ (22.7) $ (685.9) $ 966.6 $ (511.1) $ 13.5 $ (131.3) $ (99.3) $ (92.3) $ (309.4) $ (125.4) $ (132.4) $ (257.8) Acquisitions, Divestitures, and Related Costs (9.6) (9.4) (24.8) 27.2 0.2 (4.5) (1.5) 1.4 (4.4) (1.0) (151.6) (152.6) Restructuring and Other Strategic Business Development Costs (4.9) (6.5) (139.3) (99.4) (1.8) (1.6) 0.1 (19.3) (22.6) (4.2) (0.5) (4.7) Other (376.1) 294.5 (1,106.6) 176.1 (136.5) 3.4 3.3 35.3 (94.5) (7.3) 128.9 121.6 Comparable (Provision For) Benefit From Income Taxes $ (413.3) $ (407.3) $ (304.1) $ (407.2) $ (124.6) $ (134.0) $ (97.4) $ (74.9) $ (430.9) $ (137.9) $ (155.6) $ (293.5) Net (Income) Loss Attributable to Noncontrolling Interests Reported Net (Income) Loss Attributable to Noncontrolling Interests $ (11.9) $ (23.2) $ (33.2) $ (33.8) $ (10.8) $ (10.4) $ (10.0) $ (10.2) $ (41.4) $ (9.8) $ (10.5) $ (20.3) Comparable Net (Income) Loss Attributable to Noncontrolling Interests $ (11.9) $ (23.2) $ (33.2) $ (33.8) $ (10.8) $ (10.4) $ (10.0) $ (10.2) $ (41.4) $ (9.8) $ (10.5) $ (20.3) Net Income (Loss) Attributable to CBI Reported Net Income (Loss) Attributable to CBI $ 2,303.4 $ 3,435.9 $ (11.8) $ 1,998.0 $ (908.1) $ 1.5 $ 470.8 $ 395.4 $ (40.4) $ 389.5 $ (1,151.2) $ (761.7) Acquisitions, Divestitures, and Related Costs 20.4 (86.4) (76.0) 22.5 0.8 2.7 (8.2) (40.7) (45.4) (1.2) (144.6) (145.8) Restructuring and Other Strategic Business Development Costs 9.1 19.5 467.8 338.0 26.3 43.0 0.6 (8.1) 61.8 98.1 2.5 100.6 Other (587.0) (1,553.8) 1,397.9 (412.0) 1,338.1 411.7 128.9 105.1 1,983.8 17.4 1,882.0 1,899.4 Comparable Net Income (Loss) Attributable to CBI $ 1,745.9 $ 1,815.2 $ 1,777.9 $ 1,946.5 $ 457.1 $ 458.9 $ 592.1 $ 451.7 $ 1,959.8 $ 503.8 $ 588.7 $ 1,092.5 Diluted Net Income (Loss) Per Common Share Attributable to CBI Reported Diluted Net Income (Loss) Per Common Share Attributable to CBI $ 11.47 $ 17.57 $ (0.07) $ 10.23 $ (4.74) $ 0.01 $ 2.48 $ 2.07 $ (0.22) $ 2.06 $ (6.30) $ (4.13) (1) Acquisitions, Divestitures, and Related Costs 0.10 (0.44) (0.39) 0.12 — 0.01 (0.04) (0.21) (0.24) (0.01) (0.78) (0.78) (1) Restructuring and Other Strategic Business Development Costs 0.05 0.10 2.40 1.73 0.13 0.22 — (0.04) 0.32 0.52 0.01 0.54 (1) Other (2.92) (7.95) 7.17 (2.11) 6.83 2.14 0.68 0.55 10.32 0.09 10.13 10.13 (1) (2) 8.70 9.28 $ 9.12 $ 9.97 $ 2.33 $ 2.38 $ 3.12 $ 2.37 $ 10.20 $ 2.66 $ 3.17 $ 5.83 Comparable Diluted Net Income (Loss) Per Common Share Attributable to CBI Diluted weighted average common shares outstanding 200.745 195.532 194.881 195.308 195.883 192.530 189.939 190.685 192.222 189.333 185.737 187.540 (1) May not sum due to rounding as each item is computed independently. (2) Comparable Diluted Net Income (Loss) Per Common Share Attributable to CBI may not sum as comparable amounts are calculated on a fully diluted basis and Reported Diluted Net Income (Loss) Per Common Share Attributable to CBI may be calculated excluding issuable shares if the effect of including these would have been anti-dilutive. | 22
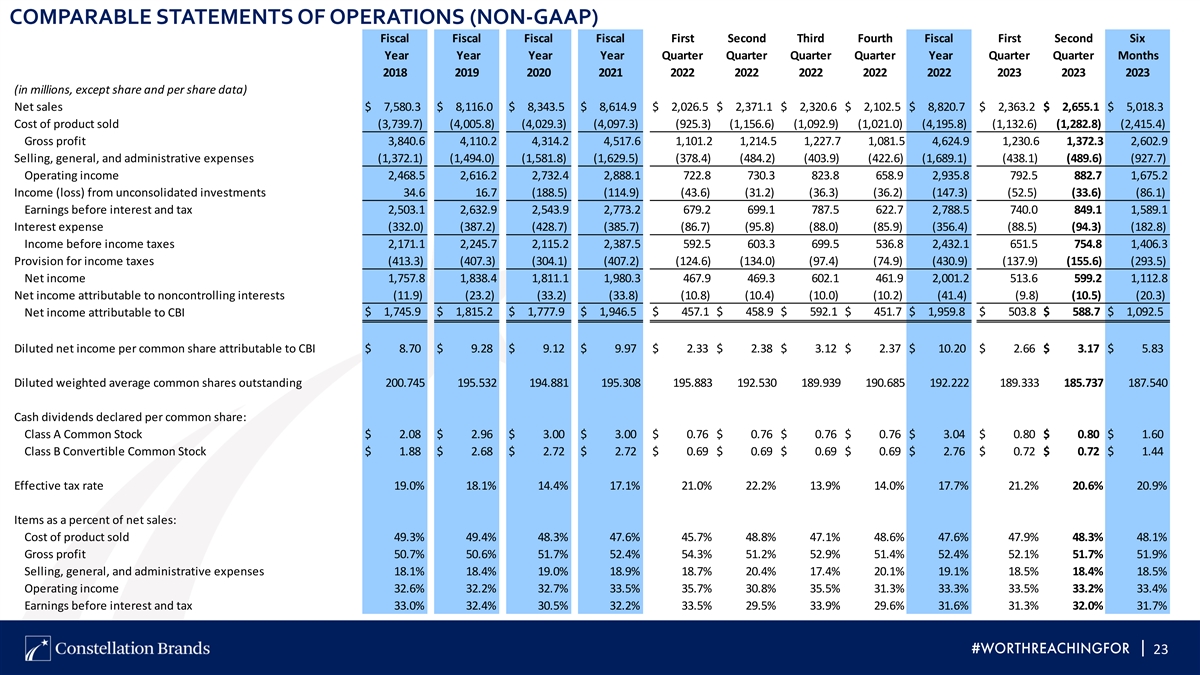
COMPARABLE STATEMENTS OF OPERATIONS (NON-GAAP) Fiscal Fiscal Fiscal Fiscal First Second Third Fourth Fiscal First Second Six Year Year Year Year Quarter Quarter Quarter Quarter Year Quarter Quarter Months 2018 2019 2020 2021 2022 2022 2022 2022 2022 2023 2023 2023 (in millions, except share and per share data) Net sales $ 7,580.3 $ 8,116.0 $ 8,343.5 $ 8,614.9 $ 2,026.5 $ 2,371.1 $ 2,320.6 $ 2,102.5 $ 8,820.7 $ 2,363.2 $ 2,655.1 $ 5,018.3 Cost of product sold (3,739.7) (4,005.8) (4,029.3) (4,097.3) (925.3) (1,156.6) (1,092.9) (1,021.0) (4,195.8) (1,132.6) (1,282.8) (2,415.4) Gross profit 3,840.6 4,110.2 4,314.2 4,517.6 1,101.2 1,214.5 1,227.7 1,081.5 4,624.9 1,230.6 1,372.3 2,602.9 Selling, general, and administrative expenses (1,372.1) (1,494.0) (1,581.8) (1,629.5) (378.4) (484.2) (403.9) (422.6) (1,689.1) (438.1) (489.6) (927.7) Operating income 2,468.5 2,616.2 2,732.4 2,888.1 722.8 730.3 823.8 658.9 2,935.8 792.5 882.7 1,675.2 Income (loss) from unconsolidated investments 34.6 16.7 (188.5) (114.9) (43.6) (31.2) (36.3) (36.2) (147.3) (52.5) (33.6) (86.1) Earnings before interest and tax 2,503.1 2,632.9 2,543.9 2,773.2 679.2 699.1 787.5 622.7 2,788.5 740.0 849.1 1,589.1 Interest expense (332.0) (387.2) (428.7) (385.7) (86.7) (95.8) (88.0) (85.9) (356.4) (88.5) (94.3) (182.8) Income before income taxes 2,171.1 2,245.7 2,115.2 2,387.5 592.5 603.3 699.5 536.8 2,432.1 651.5 754.8 1,406.3 Provision for income taxes (413.3) (407.3) (304.1) (407.2) (124.6) (134.0) (97.4) (74.9) (430.9) (137.9) (155.6) (293.5) Net income 1,757.8 1,838.4 1,811.1 1,980.3 467.9 469.3 602.1 461.9 2,001.2 513.6 599.2 1,112.8 Net income attributable to noncontrolling interests (11.9) (23.2) (33.2) (33.8) (10.8) (10.4) (10.0) (10.2) (41.4) (9.8) (10.5) (20.3) Net income attributable to CBI $ 1,745.9 $ 1,815.2 $ 1,777.9 $ 1,946.5 $ 457.1 $ 458.9 $ 592.1 $ 451.7 $ 1,959.8 $ 503.8 $ 588.7 $ 1,092.5 Diluted net income per common share attributable to CBI $ 8.70 $ 9.28 $ 9.12 $ 9.97 $ 2.33 $ 2.38 $ 3.12 $ 2.37 $ 10.20 $ 2.66 $ 3.17 $ 5.83 Diluted weighted average common shares outstanding 200.745 195.532 194.881 195.308 195.883 192.530 189.939 190.685 192.222 189.333 185.737 187.540 Cash dividends declared per common share: Class A Common Stock $ 2.08 $ 2.96 $ 3.00 $ 3.00 $ 0.76 $ 0.76 $ 0.76 $ 0.76 $ 3.04 $ 0.80 $ 0.80 $ 1.60 Class B Convertible Common Stock $ 1.88 $ 2.68 $ 2.72 $ 2.72 $ 0.69 $ 0.69 $ 0.69 $ 0.69 $ 2.76 $ 0.72 $ 0.72 $ 1.44 Effective tax rate 19.0% 18.1% 14.4% 17.1% 21.0% 22.2% 13.9% 14.0% 17.7% 21.2% 20.6% 20.9% Items as a percent of net sales: Cost of product sold 49.3% 49.4% 48.3% 47.6% 45.7% 48.8% 47.1% 48.6% 47.6% 47.9% 48.3% 48.1% Gross profit 50.7% 50.6% 51.7% 52.4% 54.3% 51.2% 52.9% 51.4% 52.4% 52.1% 51.7% 51.9% Selling, general, and administrative expenses 18.1% 18.4% 19.0% 18.9% 18.7% 20.4% 17.4% 20.1% 19.1% 18.5% 18.4% 18.5% Operating income 32.6% 32.2% 32.7% 33.5% 35.7% 30.8% 35.5% 31.3% 33.3% 33.5% 33.2% 33.4% Earnings before interest and tax 33.0% 32.4% 30.5% 32.2% 33.5% 29.5% 33.9% 29.6% 31.6% 31.3% 32.0% 31.7% | 23
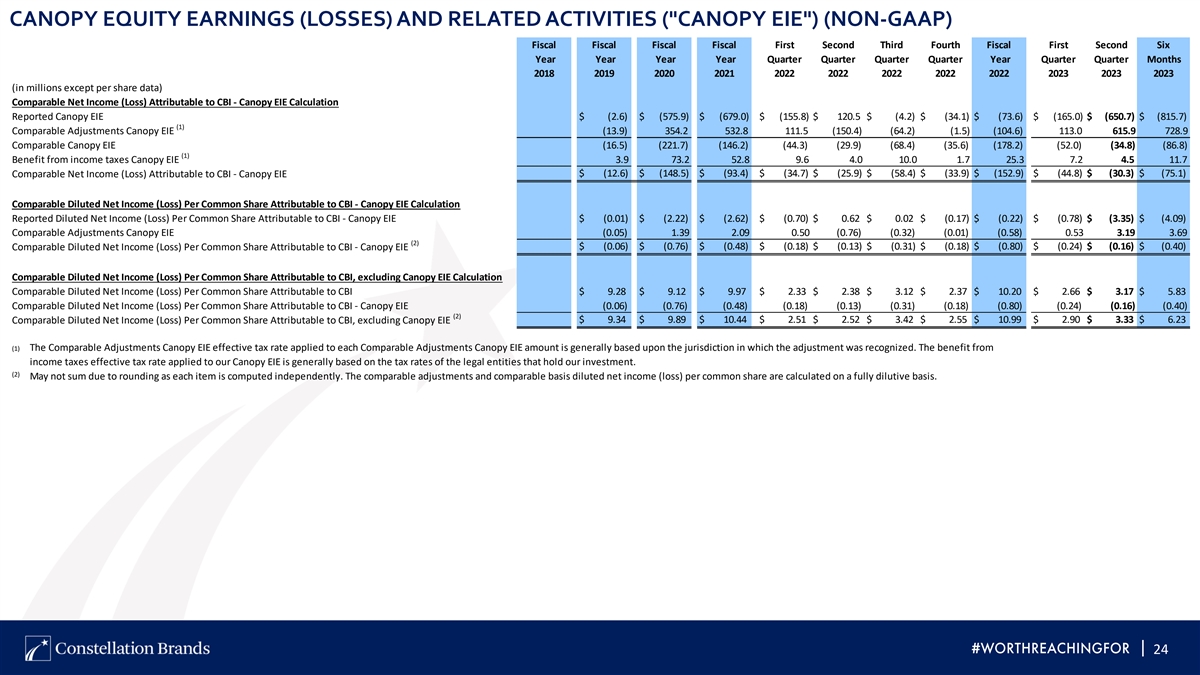
CANOPY EQUITY EARNINGS (LOSSES) AND RELATED ACTIVITIES ( CANOPY EIE ) (NON-GAAP) Fiscal Fiscal Fiscal Fiscal First Second Third Fourth Fiscal First Second Six Year Year Year Year Quarter Quarter Quarter Quarter Year Quarter Quarter Months 2018 2019 2020 2021 2022 2022 2022 2022 2022 2023 2023 2023 (in millions except per share data) Comparable Net Income (Loss) Attributable to CBI - Canopy EIE Calculation Reported Canopy EIE $ (2.6) $ (575.9) $ (679.0) $ (155.8) $ 120.5 $ (4.2) $ (34.1) $ (73.6) $ (165.0) $ (650.7) $ (815.7) (1) Comparable Adjustments Canopy EIE (13.9) 354.2 532.8 111.5 (150.4) (64.2) (1.5) (104.6) 113.0 615.9 728.9 Comparable Canopy EIE (16.5) (221.7) (146.2) (44.3) (29.9) (68.4) (35.6) (178.2) (52.0) (34.8) (86.8) (1) Benefit from income taxes Canopy EIE 3.9 73.2 52.8 9.6 4.0 10.0 1.7 25.3 7.2 4.5 11.7 $ (12.6) $ (148.5) $ (93.4) $ (34.7) $ (25.9) $ (58.4) $ (33.9) $ (152.9) $ (44.8) $ (30.3) $ (75.1) Comparable Net Income (Loss) Attributable to CBI - Canopy EIE Comparable Diluted Net Income (Loss) Per Common Share Attributable to CBI - Canopy EIE Calculation Reported Diluted Net Income (Loss) Per Common Share Attributable to CBI - Canopy EIE $ (0.01) $ (2.22) $ (2.62) $ (0.70) $ 0.62 $ 0.02 $ (0.17) $ (0.22) $ (0.78) $ (3.35) $ (4.09) Comparable Adjustments Canopy EIE (0.05) 1.39 2.09 0.50 (0.76) (0.32) (0.01) (0.58) 0.53 3.19 3.69 (2) Comparable Diluted Net Income (Loss) Per Common Share Attributable to CBI - Canopy EIE $ (0.06) $ (0.76) $ (0.48) $ (0.18) $ (0.13) $ (0.31) $ (0.18) $ (0.80) $ (0.24) $ (0.16) $ (0.40) Comparable Diluted Net Income (Loss) Per Common Share Attributable to CBI, excluding Canopy EIE Calculation Comparable Diluted Net Income (Loss) Per Common Share Attributable to CBI $ 9.28 $ 9.12 $ 9.97 $ 2.33 $ 2.38 $ 3.12 $ 2.37 $ 10.20 $ 2.66 $ 3.17 $ 5.83 Comparable Diluted Net Income (Loss) Per Common Share Attributable to CBI - Canopy EIE (0.06) (0.76) (0.48) (0.18) (0.13) (0.31) (0.18) (0.80) (0.24) (0.16) (0.40) (2) $ 9.34 $ 9.89 $ 10.44 $ 2.51 $ 2.52 $ 3.42 $ 2.55 $ 10.99 $ 2.90 $ 3.33 $ 6.23 Comparable Diluted Net Income (Loss) Per Common Share Attributable to CBI, excluding Canopy EIE (1) The Comparable Adjustments Canopy EIE effective tax rate applied to each Comparable Adjustments Canopy EIE amount is generally based upon the jurisdiction in which the adjustment was recognized. The benefit from income taxes effective tax rate applied to our Canopy EIE is generally based on the tax rates of the legal entities that hold our investment. (2) May not sum due to rounding as each item is computed independently. The comparable adjustments and comparable basis diluted net income (loss) per common share are calculated on a fully dilutive basis. | 24
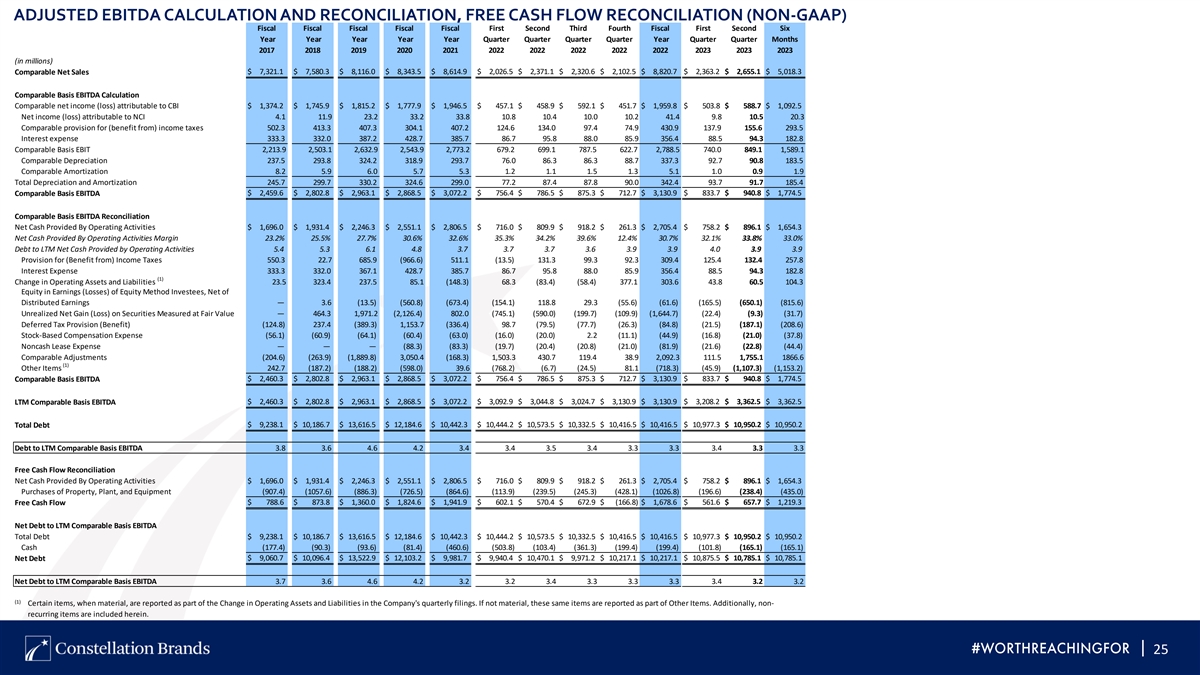
ADJUSTED EBITDA CALCULATION AND RECONCILIATION, FREE CASH FLOW RECONCILIATION (NON-GAAP) Fiscal Fiscal Fiscal Fiscal Fiscal First Second Third Fourth Fiscal First Second Six Year Year Year Year Year Quarter Quarter Quarter Quarter Year Quarter Quarter Months 2017 2018 2019 2020 2021 2022 2022 2022 2022 2022 2023 2023 2023 (in millions) $ 7,321.1 $ 7,580.3 $ 8,116.0 $ 8,343.5 $ 8,614.9 $ 2,026.5 $ 2,371.1 $ 2,320.6 $ 2,102.5 $ 8,820.7 $ 2,363.2 $ 2,655.1 $ 5,018.3 Comparable Net Sales Comparable Basis EBITDA Calculation Comparable net income (loss) attributable to CBI $ 1,374.2 $ 1,745.9 $ 1,815.2 $ 1,777.9 $ 1,946.5 $ 457.1 $ 458.9 $ 592.1 $ 451.7 $ 1,959.8 $ 503.8 $ 588.7 $ 1,092.5 Net income (loss) attributable to NCI 4.1 11.9 23.2 33.2 33.8 10.8 10.4 10.0 10.2 41.4 9.8 10.5 20.3 Comparable provision for (benefit from) income taxes 502.3 413.3 407.3 304.1 407.2 124.6 134.0 97.4 74.9 430.9 137.9 155.6 293.5 Interest expense 333.3 332.0 387.2 428.7 385.7 86.7 95.8 88.0 85.9 356.4 88.5 94.3 182.8 Comparable Basis EBIT 2,213.9 2,503.1 2,632.9 2,543.9 2,773.2 679.2 699.1 787.5 622.7 2,788.5 740.0 849.1 1,589.1 Comparable Depreciation 237.5 293.8 324.2 318.9 293.7 76.0 86.3 86.3 88.7 337.3 92.7 90.8 183.5 Comparable Amortization 8.2 5.9 6.0 5.7 5.3 1.2 1.1 1.5 1.3 5.1 1.0 0.9 1.9 Total Depreciation and Amortization 245.7 299.7 330.2 324.6 299.0 77.2 87.4 87.8 90.0 342.4 93.7 91.7 185.4 $ 2,459.6 $ 2,802.8 $ 2,963.1 $ 2,868.5 $ 3,072.2 $ 756.4 $ 786.5 $ 875.3 $ 712.7 $ 3,130.9 $ 833.7 $ 940.8 $ 1,774.5 Comparable Basis EBITDA Comparable Basis EBITDA Reconciliation Net Cash Provided By Operating Activities $ 1,696.0 $ 1,931.4 $ 2,246.3 $ 2,551.1 $ 2,806.5 $ 716.0 $ 809.9 $ 918.2 $ 261.3 $ 2,705.4 $ 758.2 $ 896.1 $ 1,654.3 Net Cash Provided By Operating Activities Margin 23.2% 25.5% 27.7% 30.6% 32.6% 35.3% 34.2% 39.6% 12.4% 30.7% 32.1% 33.8% 33.0% Debt to LTM Net Cash Provided by Operating Activities 5.4 5.3 6.1 4.8 3.7 3.7 3.7 3.6 3.9 3.9 4.0 3.9 3.9 Provision for (Benefit from) Income Taxes 550.3 22.7 685.9 (966.6) 511.1 (13.5) 131.3 99.3 92.3 309.4 125.4 132.4 257.8 Interest Expense 333.3 332.0 367.1 428.7 385.7 86.7 95.8 88.0 85.9 356.4 88.5 94.3 182.8 (1) Change in Operating Assets and Liabilities 23.5 323.4 237.5 85.1 (148.3) 68.3 (83.4) (58.4) 377.1 303.6 43.8 60.5 104.3 Equity in Earnings (Losses) of Equity Method Investees, Net of Distributed Earnings — 3.6 (13.5) (560.8) (673.4) (154.1) 118.8 29.3 (55.6) (61.6) (165.5) (650.1) (815.6) Unrealized Net Gain (Loss) on Securities Measured at Fair Value — 464.3 1,971.2 (2,126.4) 802.0 (745.1) (590.0) (199.7) (109.9) (1,644.7) (22.4) (9.3) (31.7) Deferred Tax Provision (Benefit) (124.8) 237.4 (389.3) 1,153.7 (336.4) 98.7 (79.5) (77.7) (26.3) (84.8) (21.5) (187.1) (208.6) Stock-Based Compensation Expense (56.1) (60.9) (64.1) (60.4) (63.0) (16.0) (20.0) 2.2 (11.1) (44.9) (16.8) (21.0) (37.8) Noncash Lease Expense — — — (88.3) (83.3) (19.7) (20.4) (20.8) (21.0) (81.9) (21.6) (22.8) (44.4) Comparable Adjustments (204.6) (263.9) (1,889.8) 3,050.4 (168.3) 1,503.3 430.7 119.4 38.9 2,092.3 111.5 1,755.1 1866.6 (1) Other Items 242.7 (187.2) (188.2) (598.0) 39.6 (768.2) (6.7) (24.5) 81.1 (718.3) (45.9) (1,107.3) (1,153.2) $ 2,460.3 $ 2,802.8 $ 2,963.1 $ 2,868.5 $ 3,072.2 $ 756.4 $ 786.5 $ 875.3 $ 712.7 $ 3,130.9 $ 833.7 $ 940.8 $ 1,774.5 Comparable Basis EBITDA $ 2,460.3 $ 2,802.8 $ 2,963.1 $ 2,868.5 $ 3,072.2 $ 3,092.9 $ 3,044.8 $ 3,024.7 $ 3,130.9 $ 3,130.9 $ 3,208.2 $ 3,362.5 $ 3,362.5 LTM Comparable Basis EBITDA Total Debt $ 9,238.1 $ 10,186.7 $ 13,616.5 $ 12,184.6 $ 10,442.3 $ 10,444.2 $ 10,573.5 $ 10,332.5 $ 10,416.5 $ 10,416.5 $ 10,977.3 $ 10,950.2 $ 10,950.2 Debt to LTM Comparable Basis EBITDA 3.8 3.6 4.6 4.2 3.4 3.4 3.5 3.4 3.3 3.3 3.4 3.3 3.3 Free Cash Flow Reconciliation Net Cash Provided By Operating Activities $ 1,696.0 $ 1,931.4 $ 2,246.3 $ 2,551.1 $ 2,806.5 $ 716.0 $ 809.9 $ 918.2 $ 261.3 $ 2,705.4 $ 758.2 $ 896.1 $ 1,654.3 Purchases of Property, Plant, and Equipment (907.4) (1057.6) (886.3) (726.5) (864.6) (113.9) (239.5) (245.3) (428.1) (1026.8) (196.6) (238.4) (435.0) Free Cash Flow $ 788.6 $ 873.8 $ 1,360.0 $ 1,824.6 $ 1,941.9 $ 602.1 $ 570.4 $ 672.9 $ (166.8) $ 1,678.6 $ 561.6 $ 657.7 $ 1,219.3 Net Debt to LTM Comparable Basis EBITDA Total Debt $ 9,238.1 $ 10,186.7 $ 13,616.5 $ 12,184.6 $ 10,442.3 $ 10,444.2 $ 10,573.5 $ 10,332.5 $ 10,416.5 $ 10,416.5 $ 10,977.3 $ 10,950.2 $ 10,950.2 Cash (177.4) (90.3) (93.6) (81.4) (460.6) (503.8) (103.4) (361.3) (199.4) (199.4) (101.8) (165.1) (165.1) Net Debt $ 9,060.7 $ 10,096.4 $ 13,522.9 $ 12,103.2 $ 9,981.7 $ 9,940.4 $ 10,470.1 $ 9,971.2 $ 10,217.1 $ 10,217.1 $ 10,875.5 $ 10,785.1 $ 10,785.1 Net Debt to LTM Comparable Basis EBITDA 3.7 3.6 4.6 4.2 3.2 3.2 3.4 3.3 3.3 3.3 3.4 3.2 3.2 (1) Certain items, when material, are reported as part of the Change in Operating Assets and Liabilities in the Company's quarterly filings. If not material, these same items are reported as part of Other Items. Additionally, non- recurring items are included herein. | 25
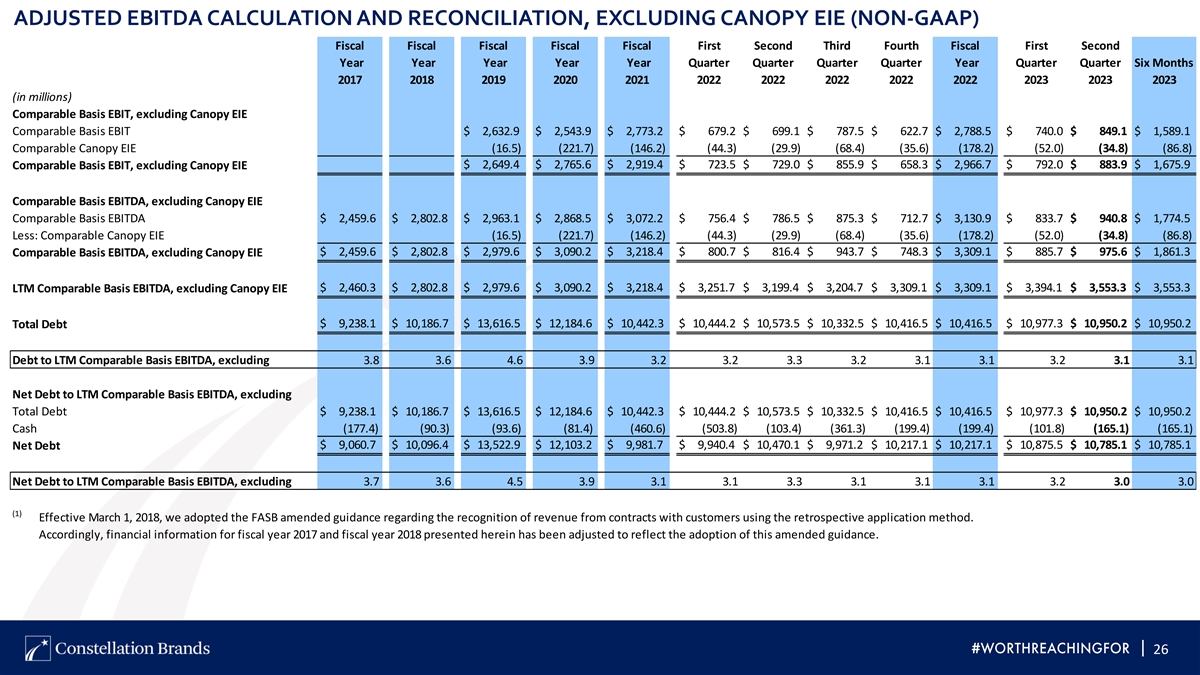
ADJUSTED EBITDA CALCULATION AND RECONCILIATION, EXCLUDING CANOPY EIE (NON-GAAP) Fiscal Fiscal Fiscal Fiscal Fiscal First Second Third Fourth Fiscal First Second Year Year Year Year Year Quarter Quarter Quarter Quarter Year Quarter Quarter Six Months 2017 2018 2019 2020 2021 2022 2022 2022 2022 2022 2023 2023 2023 (in millions) Comparable Basis EBIT, excluding Canopy EIE Comparable Basis EBIT $ 2,632.9 $ 2,543.9 $ 2,773.2 $ 679.2 $ 699.1 $ 787.5 $ 622.7 $ 2,788.5 $ 740.0 $ 849.1 $ 1,589.1 Comparable Canopy EIE (16.5) (221.7) (146.2) (44.3) (29.9) (68.4) (35.6) (178.2) (52.0) (34.8) (86.8) $ 2,649.4 $ 2,765.6 $ 2,919.4 $ 723.5 $ 729.0 $ 855.9 $ 658.3 $ 2,966.7 $ 792.0 $ 883.9 $ 1,675.9 Comparable Basis EBIT, excluding Canopy EIE Comparable Basis EBITDA, excluding Canopy EIE Comparable Basis EBITDA $ 2,459.6 $ 2,802.8 $ 2,963.1 $ 2,868.5 $ 3,072.2 $ 756.4 $ 786.5 $ 875.3 $ 712.7 $ 3,130.9 $ 833.7 $ 940.8 $ 1,774.5 Less: Comparable Canopy EIE (16.5) (221.7) (146.2) (44.3) (29.9) (68.4) (35.6) (178.2) (52.0) (34.8) (86.8) Comparable Basis EBITDA, excluding Canopy EIE $ 2,459.6 $ 2,802.8 $ 2,979.6 $ 3,090.2 $ 3,218.4 $ 800.7 $ 816.4 $ 943.7 $ 748.3 $ 3,309.1 $ 885.7 $ 975.6 $ 1,861.3 $ 2,460.3 $ 2,802.8 $ 2,979.6 $ 3,090.2 $ 3,218.4 $ 3,251.7 $ 3,199.4 $ 3,204.7 $ 3,309.1 $ 3,309.1 $ 3,394.1 $ 3,553.3 $ 3,553.3 LTM Comparable Basis EBITDA, excluding Canopy EIE $ 9,238.1 $ 10,186.7 $ 13,616.5 $ 12,184.6 $ 10,442.3 $ 10,444.2 $ 10,573.5 $ 10,332.5 $ 10,416.5 $ 10,416.5 $ 10,977.3 $ 10,950.2 $ 10,950.2 Total Debt Debt to LTM Comparable Basis EBITDA, excluding 3.8 3.6 4.6 3.9 3.2 3.2 3.3 3.2 3.1 3.1 3.2 3.1 3.1 Net Debt to LTM Comparable Basis EBITDA, excluding Total Debt $ 9,238.1 $ 10,186.7 $ 13,616.5 $ 12,184.6 $ 10,442.3 $ 10,444.2 $ 10,573.5 $ 10,332.5 $ 10,416.5 $ 10,416.5 $ 10,977.3 $ 10,950.2 $ 10,950.2 Cash (177.4) (90.3) (93.6) (81.4) (460.6) (503.8) (103.4) (361.3) (199.4) (199.4) (101.8) (165.1) (165.1) $ 9,060.7 $ 10,096.4 $ 13,522.9 $ 12,103.2 $ 9,981.7 $ 9,940.4 $ 10,470.1 $ 9,971.2 $ 10,217.1 $ 10,217.1 $ 10,875.5 $ 10,785.1 $ 10,785.1 Net Debt Net Debt to LTM Comparable Basis EBITDA, excluding 3.7 3.6 4.5 3.9 3.1 3.1 3.3 3.1 3.1 3.1 3.2 3.0 3.0 (1) Effective March 1, 2018, we adopted the FASB amended guidance regarding the recognition of revenue from contracts with customers using the retrospective application method. Accordingly, financial information for fiscal year 2017 and fiscal year 2018 presented herein has been adjusted to reflect the adoption of this amended guidance. | 26
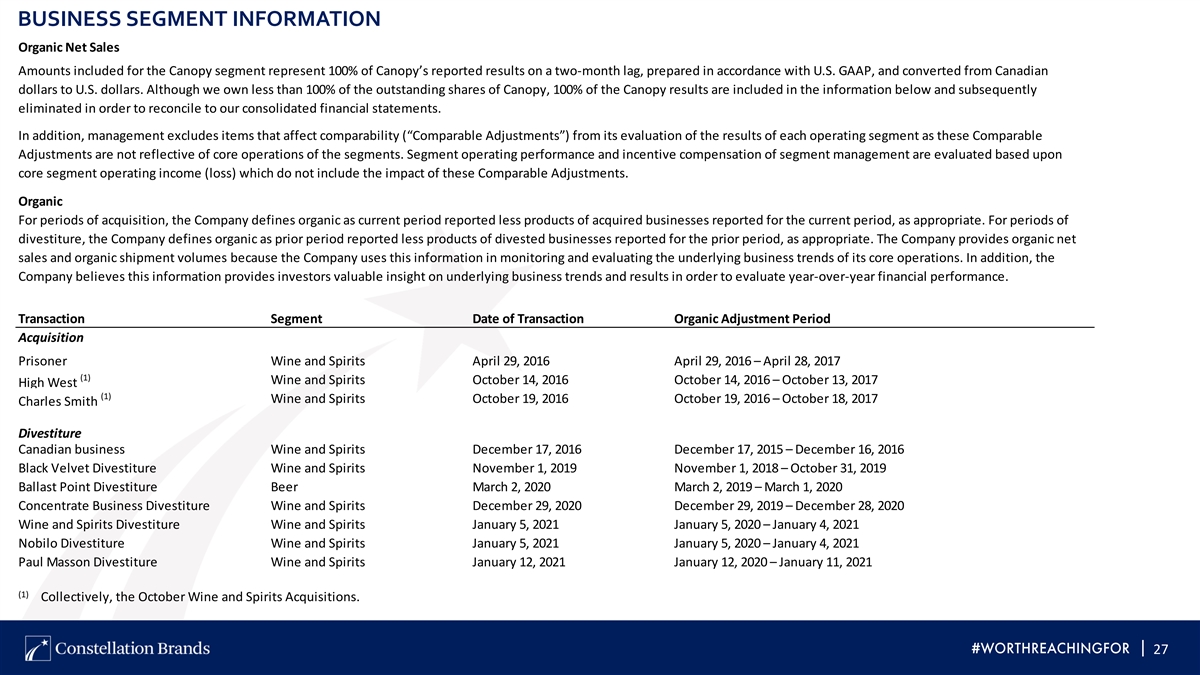
BUSINESS SEGMENT INFORMATION Organic Net Sales Through February 28, 2019, our internal management financial reporting consisted of two business divisions: (i) Beer and (ii) Wine and Spirits. Beginning March 1, 2019, as a result of our Amounts included for the Canopy segment represent 100% of Canopy’s reported results on a two-month lag, prepared in accordance with U.S. GAAP, and converted from Canadian dollars to U.S. dollars. Although we own less than 100% of the outstanding shares of Canopy, 100% of the Canopy results are included in the information below and subsequently eliminated in order to reconcile to our consolidated financial statements. In addition, management excludes items that affect comparability (“Comparable Adjustments”) from its evaluation of the results of each operating segment as these Comparable Adjustments are not reflective of core operations of the segments. Segment operating performance and incentive compensation of segment management are evaluated based upon core segment operating income (loss) which do not include the impact of these Comparable Adjustments. Organic For periods of acquisition, the Company defines organic as current period reported less products of acquired businesses reported for the current period, as appropriate. For periods of divestiture, the Company defines organic as prior period reported less products of divested businesses reported for the prior period, as appropriate. The Company provides organic net sales and organic shipment volumes because the Company uses this information in monitoring and evaluating the underlying business trends of its core operations. In addition, the Company believes this information provides investors valuable insight on underlying business trends and results in order to evaluate year-over-year financial performance. Transaction Segment Date of Transaction Organic Adjustment Period Acquisition Prisoner Wine and Spirits April 29, 2016 April 29, 2016 – April 28, 2017 (1) Wine and Spirits October 14, 2016 October 14, 2016 – October 13, 2017 High West (1) Wine and Spirits October 19, 2016 October 19, 2016 – October 18, 2017 Charles Smith Divestiture Canadian business Wine and Spirits December 17, 2016 December 17, 2015 – December 16, 2016 Black Velvet Divestiture Wine and Spirits November 1, 2019 November 1, 2018 – October 31, 2019 Ballast Point Divestiture Beer March 2, 2020 March 2, 2019 – March 1, 2020 Concentrate Business Divestiture Wine and Spirits December 29, 2020 December 29, 2019 – December 28, 2020 Wine and Spirits Divestiture Wine and Spirits January 5, 2021 January 5, 2020 – January 4, 2021 Nobilo Divestiture Wine and Spirits January 5, 2021 January 5, 2020 – January 4, 2021 Paul Masson Divestiture Wine and Spirits January 12, 2021 January 12, 2020 – January 11, 2021 (1) Collectively, the October Wine and Spirits Acquisitions. | 27
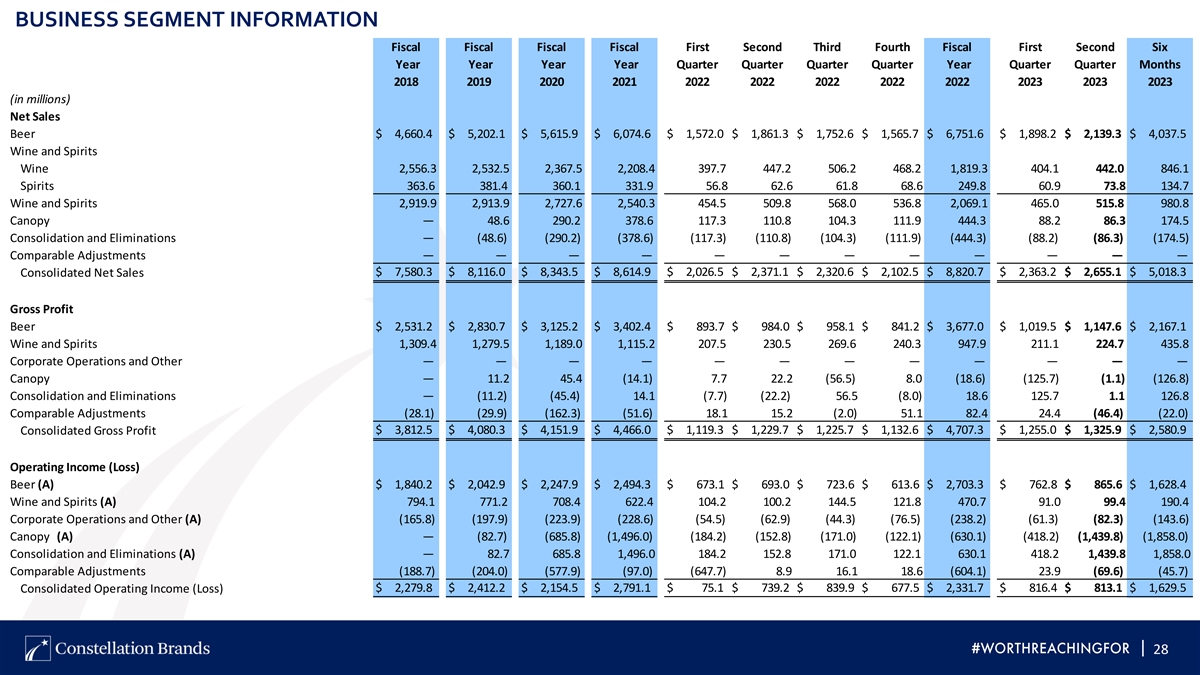
BUSINESS SEGMENT INFORMATION Fiscal Fiscal Fiscal Fiscal First Second Third Fourth Fiscal First Second Six Year Year Year Year Quarter Quarter Quarter Quarter Year Quarter Quarter Months 2018 2019 2020 2021 2022 2022 2022 2022 2022 2023 2023 2023 (in millions) Net Sales Beer $ 4,660.4 $ 5,202.1 $ 5,615.9 $ 6,074.6 $ 1,572.0 $ 1,861.3 $ 1,752.6 $ 1,565.7 $ 6,751.6 $ 1,898.2 $ 2,139.3 $ 4,037.5 Wine and Spirits Wine 2,556.3 2,532.5 2,367.5 2,208.4 397.7 447.2 506.2 468.2 1,819.3 404.1 442.0 846.1 Spirits 363.6 381.4 360.1 331.9 56.8 62.6 61.8 68.6 249.8 60.9 73.8 134.7 Wine and Spirits 2,919.9 2,913.9 2,727.6 2,540.3 454.5 509.8 568.0 536.8 2,069.1 465.0 515.8 980.8 Canopy — 48.6 290.2 378.6 117.3 110.8 104.3 111.9 444.3 88.2 86.3 174.5 Consolidation and Eliminations — (48.6) (290.2) (378.6) (117.3) (110.8) (104.3) (111.9) (444.3) (88.2) (86.3) (174.5) Comparable Adjustments — — — — — — — — — — — — $ 7,580.3 $ 8,116.0 $ 8,343.5 $ 8,614.9 $ 2,026.5 $ 2,371.1 $ 2,320.6 $ 2,102.5 $ 8,820.7 $ 2,363.2 $ 2,655.1 $ 5,018.3 Consolidated Net Sales Gross Profit Beer $ 2,531.2 $ 2,830.7 $ 3,125.2 $ 3,402.4 $ 893.7 $ 984.0 $ 958.1 $ 841.2 $ 3,677.0 $ 1,019.5 $ 1,147.6 $ 2,167.1 Wine and Spirits 1,309.4 1,279.5 1,189.0 1,115.2 207.5 230.5 269.6 240.3 947.9 211.1 224.7 435.8 Corporate Operations and Other — — — — — — — — — — — — Canopy — 11.2 45.4 (14.1) 7.7 22.2 (56.5) 8.0 (18.6) (125.7) (1.1) (126.8) Consolidation and Eliminations — (11.2) (45.4) 14.1 (7.7) (22.2) 56.5 (8.0) 18.6 125.7 1.1 126.8 Comparable Adjustments (28.1) (29.9) (162.3) (51.6) 18.1 15.2 (2.0) 51.1 82.4 24.4 (46.4) (22.0) $ 3,812.5 $ 4,080.3 $ 4,151.9 $ 4,466.0 $ 1,119.3 $ 1,229.7 $ 1,225.7 $ 1,132.6 $ 4,707.3 $ 1,255.0 $ 1,325.9 $ 2,580.9 Consolidated Gross Profit Operating Income (Loss) Beer (A) $ 1,840.2 $ 2,042.9 $ 2,247.9 $ 2,494.3 $ 673.1 $ 693.0 $ 723.6 $ 613.6 $ 2,703.3 $ 762.8 $ 865.6 $ 1,628.4 Wine and Spirits (A) 794.1 771.2 708.4 622.4 104.2 100.2 144.5 121.8 470.7 91.0 99.4 190.4 Corporate Operations and Other (A) (165.8) (197.9) (223.9) (228.6) (54.5) (62.9) (44.3) (76.5) (238.2) (61.3) (82.3) (143.6) Canopy (A) — (82.7) (685.8) (1,496.0) (184.2) (152.8) (171.0) (122.1) (630.1) (418.2) (1,439.8) (1,858.0) Consolidation and Eliminations (A) — 82.7 685.8 1,496.0 184.2 152.8 171.0 122.1 630.1 418.2 1,439.8 1,858.0 Comparable Adjustments (188.7) (204.0) (577.9) (97.0) (647.7) 8.9 16.1 18.6 (604.1) 23.9 (69.6) (45.7) Consolidated Operating Income (Loss) $ 2,279.8 $ 2,412.2 $ 2,154.5 $ 2,791.1 $ 75.1 $ 739.2 $ 839.9 $ 677.5 $ 2,331.7 $ 816.4 $ 813.1 $ 1,629.5 | 28
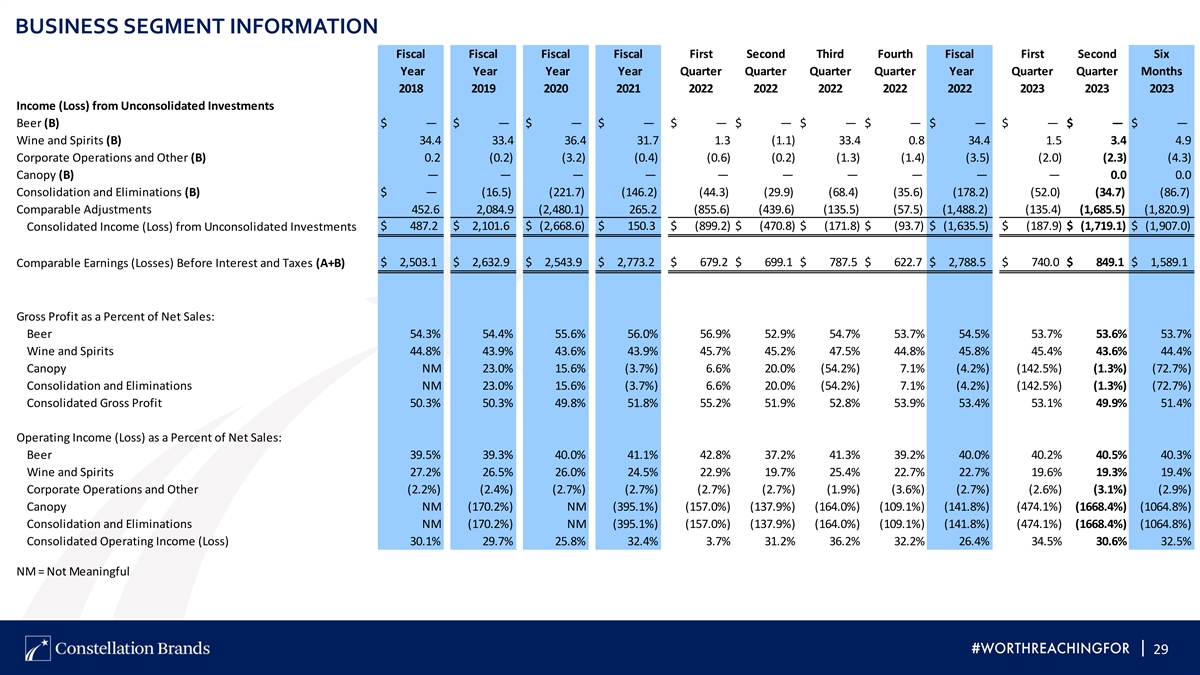
BUSINESS SEGMENT INFORMATION Fiscal Fiscal Fiscal Fiscal First Second Third Fourth Fiscal First Second Six Year Year Year Year Quarter Quarter Quarter Quarter Year Quarter Quarter Months 2018 2019 2020 2021 2022 2022 2022 2022 2022 2023 2023 2023 Income (Loss) from Unconsolidated Investments Beer (B) $ — $ — $ — $ — $ — $ — $ — $ — $ — $ — $ — $ — Wine and Spirits (B) 34.4 33.4 36.4 31.7 1.3 (1.1) 33.4 0.8 34.4 1.5 3.4 4.9 Corporate Operations and Other (B) 0.2 (0.2) (3.2) (0.4) (0.6) (0.2) (1.3) (1.4) (3.5) (2.0) (2.3) (4.3) Canopy (B) — — — — — — — — — — 0.0 0.0 Consolidation and Eliminations (B) $ — (16.5) (221.7) (146.2) (44.3) (29.9) (68.4) (35.6) (178.2) (52.0) (34.7) (86.7) Comparable Adjustments 452.6 2,084.9 (2,480.1) 265.2 (855.6) (439.6) (135.5) (57.5) (1,488.2) (135.4) (1,685.5) (1,820.9) $ 487.2 $ 2,101.6 $ (2,668.6) $ 150.3 $ (899.2) $ (470.8) $ (171.8) $ (93.7) $ (1,635.5) $ (187.9) $ (1,719.1) $ (1,907.0) Consolidated Income (Loss) from Unconsolidated Investments $ 2,503.1 $ 2,632.9 $ 2,543.9 $ 2,773.2 $ 679.2 $ 699.1 $ 787.5 $ 622.7 $ 2,788.5 $ 740.0 $ 849.1 $ 1,589.1 Comparable Earnings (Losses) Before Interest and Taxes (A+B) Gross Profit as a Percent of Net Sales: Beer 54.3% 54.4% 55.6% 56.0% 56.9% 52.9% 54.7% 53.7% 54.5% 53.7% 53.6% 53.7% Wine and Spirits 44.8% 43.9% 43.6% 43.9% 45.7% 45.2% 47.5% 44.8% 45.8% 45.4% 43.6% 44.4% Canopy NM 23.0% 15.6% (3.7%) 6.6% 20.0% (54.2%) 7.1% (4.2%) (142.5%) (1.3%) (72.7%) Consolidation and Eliminations NM 23.0% 15.6% (3.7%) 6.6% 20.0% (54.2%) 7.1% (4.2%) (142.5%) (1.3%) (72.7%) Consolidated Gross Profit 50.3% 50.3% 49.8% 51.8% 55.2% 51.9% 52.8% 53.9% 53.4% 53.1% 49.9% 51.4% Operating Income (Loss) as a Percent of Net Sales: Beer 39.5% 39.3% 40.0% 41.1% 42.8% 37.2% 41.3% 39.2% 40.0% 40.2% 40.5% 40.3% Wine and Spirits 27.2% 26.5% 26.0% 24.5% 22.9% 19.7% 25.4% 22.7% 22.7% 19.6% 19.3% 19.4% Corporate Operations and Other (2.2%) (2.4%) (2.7%) (2.7%) (2.7%) (2.7%) (1.9%) (3.6%) (2.7%) (2.6%) (3.1%) (2.9%) Canopy NM (170.2%) NM (395.1%) (157.0%) (137.9%) (164.0%) (109.1%) (141.8%) (474.1%) (1668.4%) (1064.8%) Consolidation and Eliminations NM (170.2%) NM (395.1%) (157.0%) (137.9%) (164.0%) (109.1%) (141.8%) (474.1%) (1668.4%) (1064.8%) Consolidated Operating Income (Loss) 30.1% 29.7% 25.8% 32.4% 3.7% 31.2% 36.2% 32.2% 26.4% 34.5% 30.6% 32.5% NM = Not Meaningful | 29
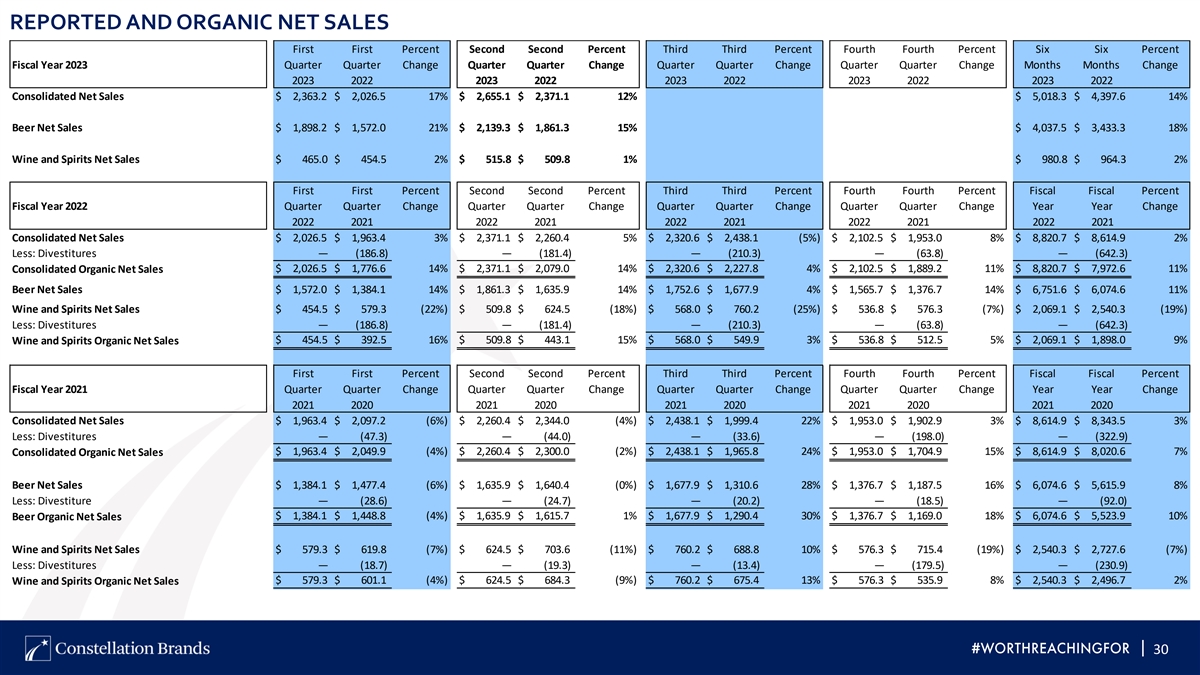
REPORTED AND ORGANIC NET SALES First First Percent Second Second Percent Third Third Percent Fourth Fourth Percent Six Six Percent Fiscal Year 2023 Quarter Quarter Change Quarter Quarter Change Quarter Quarter Change Quarter Quarter Change Months Months Change 2023 2022 2023 2022 2023 2022 2023 2022 2023 2022 Consolidated Net Sales $ 2,363.2 $ 2,026.5 17% $ 2,655.1 $ 2,371.1 12% $ 5,018.3 $ 4,397.6 14% Beer Net Sales $ 1,898.2 $ 1,572.0 21% $ 2,139.3 $ 1,861.3 15% $ 4,037.5 $ 3,433.3 18% Wine and Spirits Net Sales $ 465.0 $ 454.5 2% $ 515.8 $ 509.8 1% $ 980.8 $ 964.3 2% First First Percent Second Second Percent Third Third Percent Fourth Fourth Percent Fiscal Fiscal Percent Fiscal Year 2022 Quarter Quarter Change Quarter Quarter Change Quarter Quarter Change Quarter Quarter Change Year Year Change 2022 2021 2022 2021 2022 2021 2022 2021 2022 2021 Consolidated Net Sales $ 2,026.5 $ 1,963.4 3% $ 2,371.1 $ 2,260.4 5% $ 2,320.6 $ 2,438.1 (5%) $ 2,102.5 $ 1,953.0 8% $ 8,820.7 $ 8,614.9 2% Less: Divestitures — (186.8) — (181.4) — (210.3) — (63.8) — (642.3) Consolidated Organic Net Sales $ 2,026.5 $ 1,776.6 14% $ 2,371.1 $ 2,079.0 14% $ 2,320.6 $ 2,227.8 4% $ 2,102.5 $ 1,889.2 11% $ 8,820.7 $ 7,972.6 11% Beer Net Sales $ 1,572.0 $ 1,384.1 14% $ 1,861.3 $ 1,635.9 14% $ 1,752.6 $ 1,677.9 4% $ 1,565.7 $ 1,376.7 14% $ 6,751.6 $ 6,074.6 11% Wine and Spirits Net Sales $ 454.5 $ 579.3 (22%) $ 509.8 $ 624.5 (18%) $ 568.0 $ 760.2 (25%) $ 536.8 $ 576.3 (7%) $ 2,069.1 $ 2,540.3 (19%) Less: Divestitures — (186.8) — (181.4) — (210.3) — (63.8) — (642.3) $ 454.5 $ 392.5 16% $ 509.8 $ 443.1 15% $ 568.0 $ 549.9 3% $ 536.8 $ 512.5 5% $ 2,069.1 $ 1,898.0 9% Wine and Spirits Organic Net Sales First First Percent Second Second Percent Third Third Percent Fourth Fourth Percent Fiscal Fiscal Percent Fiscal Year 2021 Quarter Quarter Change Quarter Quarter Change Quarter Quarter Change Quarter Quarter Change Year Year Change 2021 2020 2021 2020 2021 2020 2021 2020 2021 2020 Consolidated Net Sales $ 1,963.4 $ 2,097.2 (6%) $ 2,260.4 $ 2,344.0 (4%) $ 2,438.1 $ 1,999.4 22% $ 1,953.0 $ 1,902.9 3% $ 8,614.9 $ 8,343.5 3% Less: Divestitures — (47.3) — (44.0) — (33.6) — (198.0) — (322.9) $ 1,963.4 $ 2,049.9 (4%) $ 2,260.4 $ 2,300.0 (2%) $ 2,438.1 $ 1,965.8 24% $ 1,953.0 $ 1,704.9 15% $ 8,614.9 $ 8,020.6 7% Consolidated Organic Net Sales Beer Net Sales $ 1,384.1 $ 1,477.4 (6%) $ 1,635.9 $ 1,640.4 (0%) $ 1,677.9 $ 1,310.6 28% $ 1,376.7 $ 1,187.5 16% $ 6,074.6 $ 5,615.9 8% Less: Divestiture — (28.6) — (24.7) — (20.2) — (18.5) — (92.0) Beer Organic Net Sales $ 1,384.1 $ 1,448.8 (4%) $ 1,635.9 $ 1,615.7 1% $ 1,677.9 $ 1,290.4 30% $ 1,376.7 $ 1,169.0 18% $ 6,074.6 $ 5,523.9 10% Wine and Spirits Net Sales $ 579.3 $ 619.8 (7%) $ 624.5 $ 703.6 (11%) $ 760.2 $ 688.8 10% $ 576.3 $ 715.4 (19%) $ 2,540.3 $ 2,727.6 (7%) Less: Divestitures — (18.7) — (19.3) — (13.4) — (179.5) — (230.9) $ 579.3 $ 601.1 (4%) $ 624.5 $ 684.3 (9%) $ 760.2 $ 675.4 13% $ 576.3 $ 535.9 8% $ 2,540.3 $ 2,496.7 2% Wine and Spirits Organic Net Sales | 30
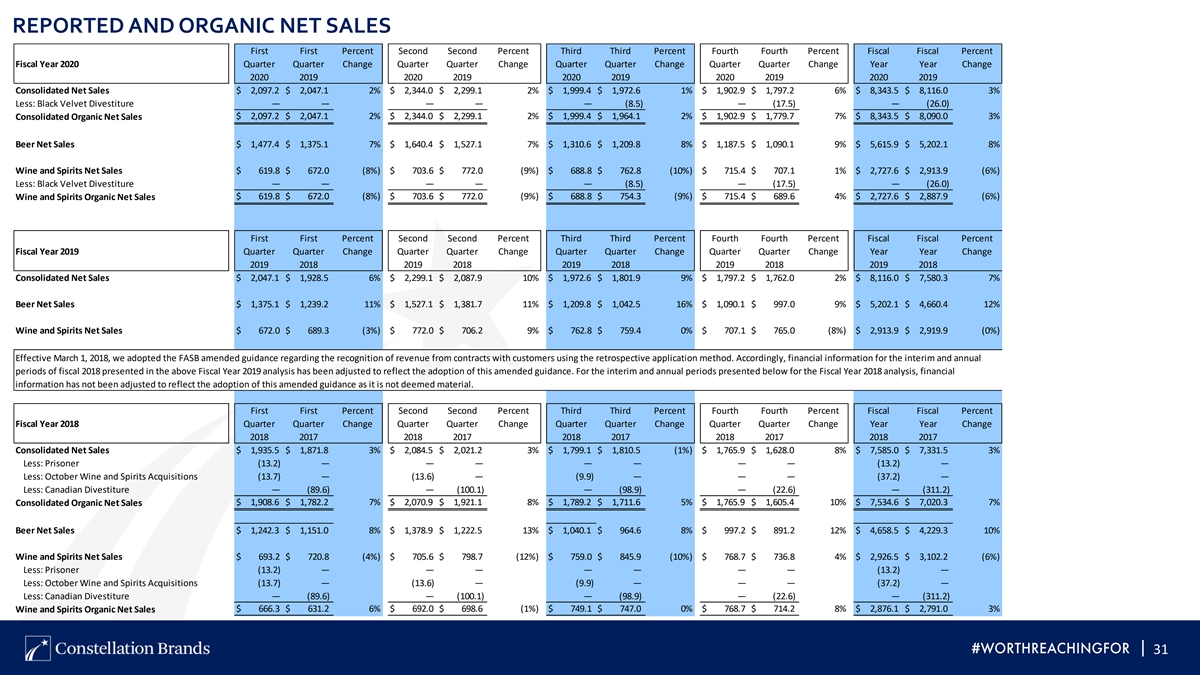
REPORTED AND ORGANIC NET SALES First First Percent Second Second Percent Third Third Percent Fourth Fourth Percent Fiscal Fiscal Percent Fiscal Year 2020 Quarter Quarter Change Quarter Quarter Change Quarter Quarter Change Quarter Quarter Change Year Year Change 2020 2019 2020 2019 2020 2019 2020 2019 2020 2019 Consolidated Net Sales $ 2,097.2 $ 2,047.1 2% $ 2,344.0 $ 2,299.1 2% $ 1,999.4 $ 1,972.6 1% $ 1,902.9 $ 1,797.2 6% $ 8,343.5 $ 8,116.0 3% Less: Black Velvet Divestiture — — — — — (8.5) — (17.5) — (26.0) Consolidated Organic Net Sales $ 2,097.2 $ 2,047.1 2% $ 2,344.0 $ 2,299.1 2% $ 1,999.4 $ 1,964.1 2% $ 1,902.9 $ 1,779.7 7% $ 8,343.5 $ 8,090.0 3% Beer Net Sales $ 1,477.4 $ 1,375.1 7% $ 1,640.4 $ 1,527.1 7% $ 1,310.6 $ 1,209.8 8% $ 1,187.5 $ 1,090.1 9% $ 5,615.9 $ 5,202.1 8% Wine and Spirits Net Sales $ 619.8 $ 672.0 (8%) $ 703.6 $ 772.0 (9%) $ 688.8 $ 762.8 (10%) $ 715.4 $ 707.1 1% $ 2,727.6 $ 2,913.9 (6%) Less: Black Velvet Divestiture — — — — — (8.5) — (17.5) — (26.0) Wine and Spirits Organic Net Sales $ 619.8 $ 672.0 (8%) $ 703.6 $ 772.0 (9%) $ 688.8 $ 754.3 (9%) $ 715.4 $ 689.6 4% $ 2,727.6 $ 2,887.9 (6%) First First Percent Second Second Percent Third Third Percent Fourth Fourth Percent Fiscal Fiscal Percent Fiscal Year 2019 Quarter Quarter Change Quarter Quarter Change Quarter Quarter Change Quarter Quarter Change Year Year Change 2019 2018 2019 2018 2019 2018 2019 2018 2019 2018 Consolidated Net Sales $ 2,047.1 $ 1,928.5 6% $ 2,299.1 $ 2,087.9 10% $ 1,972.6 $ 1,801.9 9% $ 1,797.2 $ 1,762.0 2% $ 8,116.0 $ 7,580.3 7% Beer Net Sales $ 1,375.1 $ 1,239.2 11% $ 1,527.1 $ 1,381.7 11% $ 1,209.8 $ 1,042.5 16% $ 1,090.1 $ 997.0 9% $ 5,202.1 $ 4,660.4 12% Wine and Spirits Net Sales $ 672.0 $ 689.3 (3%) $ 772.0 $ 706.2 9% $ 762.8 $ 759.4 0% $ 707.1 $ 765.0 (8%) $ 2,913.9 $ 2,919.9 (0%) Effective March 1, 2018, we adopted the FASB amended guidance regarding the recognition of revenue from contracts with customers using the retrospective application method. Accordingly, financial information for the interim and annual periods of fiscal 2018 presented in the above Fiscal Year 2019 analysis has been adjusted to reflect the adoption of this amended guidance. For the interim and annual periods presented below for the Fiscal Year 2018 analysis, financial information has not been adjusted to reflect the adoption of this amended guidance as it is not deemed material. First First Percent Second Second Percent Third Third Percent Fourth Fourth Percent Fiscal Fiscal Percent Fiscal Year 2018 Quarter Quarter Change Quarter Quarter Change Quarter Quarter Change Quarter Quarter Change Year Year Change 2018 2017 2018 2017 2018 2017 2018 2017 2018 2017 Consolidated Net Sales $ 1,935.5 $ 1,871.8 3% $ 2,084.5 $ 2,021.2 3% $ 1,799.1 $ 1,810.5 (1%) $ 1,765.9 $ 1,628.0 8% $ 7,585.0 $ 7,331.5 3% Less: Prisoner (13.2) — — — — — — — (13.2) — Less: October Wine and Spirits Acquisitions (13.7) — (13.6) — (9.9) — — — (37.2) — Less: Canadian Divestiture — (89.6) — (100.1) — (98.9) — (22.6) — (311.2) $ 1,908.6 $ 1,782.2 7% $ 2,070.9 $ 1,921.1 8% $ 1,789.2 $ 1,711.6 5% $ 1,765.9 $ 1,605.4 10% $ 7,534.6 $ 7,020.3 7% Consolidated Organic Net Sales Beer Net Sales $ 1,242.3 $ 1,151.0 8% $ 1,378.9 $ 1,222.5 13% $ 1,040.1 $ 964.6 8% $ 997.2 $ 891.2 12% $ 4,658.5 $ 4,229.3 10% Wine and Spirits Net Sales $ 693.2 $ 720.8 (4%) $ 705.6 $ 798.7 (12%) $ 759.0 $ 845.9 (10%) $ 768.7 $ 736.8 4% $ 2,926.5 $ 3,102.2 (6%) Less: Prisoner (13.2) — — — — — — — (13.2) — Less: October Wine and Spirits Acquisitions (13.7) — (13.6) — (9.9) — — — (37.2) — Less: Canadian Divestiture — (89.6) — (100.1) — (98.9) — (22.6) — (311.2) Wine and Spirits Organic Net Sales $ 666.3 $ 631.2 6% $ 692.0 $ 698.6 (1%) $ 749.1 $ 747.0 0% $ 768.7 $ 714.2 8% $ 2,876.1 $ 2,791.0 3% | 31

THANK YOU | 32