EXHIBIT 99.3
Published on January 17, 2003
BRL Hardy Limited

BRL HARDY Overview
BRL Hardy is the largest wine producer (by volume) in the Australian market
The company listed on the Australian Stock Exchange in September 1992 and has since become one of Australias leading wine companies and a leading exporter of quality wines to the world
BRL Hardy has established a strong position in the Australian wine market and has experienced significant success in exporting its wine into world markets and in particular, to the United Kingdom, mainland Europe, North America and New Zealand
Headquartered in Adelaide, BRL Hardy's major production facilities are situated in Australia, New Zealand, France and North America
In August 2001, BRL Hardy and Constellation formed the 50/50 joint venture, Pacific Wine Partners, and used this vehicle to acquire the Blackstone winery in October 2001
2
BRL Hardy Brands
|
Hardys |
|
Hardys contd |
|
Houghton |
|
Reynella |
|
Berri Estates |
|
|
|
|
|
|
|
|
|
|
|
|
|
Eileen Hardy |
|
Insignia |
|
Jack Mann |
|
|
|
Brentwood range |
|
|
Thomas Hardy |
|
Signature |
|
Show Reserve |
|
Renmano |
|
3,5 and 15 litre casks |
|
|
Bankside |
|
Woodcroft |
|
Crofters |
|
Chairmans Selection |
|
|
|
|
Padthaway |
|
Tawny Ports |
|
Line range |
|
River Breeze range |
|
Buronga |
|
|
Sir James |
|
Vintage Ports |
|
Wildflower Ridge |
|
2 litre and 4 litre |
|
3,5 and 15 litre casks |
|
|
Tintara |
|
3 litre Reserve casks |
|
Maidenwood |
|
premium casks |
|
|
|
|
Tintara Cellars |
|
|
|
|
|
|
|
|
|
|
Hunter Ridge |
|
Omni |
|
Banrock Station |
|
Wicked Wines |
|
|
|
|
Siegersdorf |
|
|
|
Premium range |
|
|
|
|
|
|
Nottage Hill |
|
Arras |
|
Sparkling range |
|
Nobilo (New Zealand) |
|
|
|
|
Hardys R&R |
|
|
|
Budget range |
|
|
|
|
|
|
Hardys VR |
|
Leasingham |
|
2 litre casks |
|
Selaks |
|
|
|
|
Stamp of Australia |
|
Classic Clare |
|
|
|
|
|
|
|
|
La Baume (France) |
|
Bin range |
|
Chateau Reynella |
|
Stanley |
|
|
|
|
Black Bottle Brandy |
|
Bastion |
|
|
|
2,4 10 & 20 litre casks |
|
|
|
3
Vineyards
BRL Hardy produces around 95% of its product from grapes processed at its own or contract wineries, with the remaining 5% purchased as juice
Of grapes processed, around 7% are from BRL Hardy owned vineyards (including JV or leased) with the remainder being purchased predominantly under contract
|
|
|
Area |
|
|
|
Area |
|
|
Location |
|
(hectares) |
|
Location |
|
(hectares) |
|
|
|
|
|
|
|
|
|
|
|
South Australia |
|
|
|
Western Australia |
|
|
|
|
Banrock Station |
|
287 |
|
Margaret River |
|
20 |
* |
|
Clare |
|
314 |
|
Frankland River |
|
90 |
* |
|
Coonawarra |
|
192 |
* |
Houghton |
|
60 |
|
|
Elgin Valley |
|
78 |
* |
Moondah Brook |
|
145 |
|
|
Langhorne Creek |
|
90 |
|
Mount Barker |
|
73 |
|
|
McLaren Vale |
|
180 |
* |
Pemberton |
|
91 |
* |
|
Padthaway |
|
450 |
* |
|
|
|
|
|
Reynella |
|
12 |
|
Tasmania |
|
|
|
|
Wrattonbully |
|
152 |
|
Pipers River |
|
22 |
|
|
|
|
|
|
|
|
|
|
|
Victoria |
|
|
|
France |
|
|
|
|
Lake Cullulleraine |
|
160 |
|
Domaine de la Baume |
|
32 |
|
|
Hoddles Creek |
|
81 |
|
|
|
|
|
|
Yarra Burn |
|
7 |
|
New Zealand |
|
|
|
|
|
|
|
|
Marlborough |
|
613 |
* |
|
Australian Capital Territory |
|
|
|
Hawkes Bay |
|
163 |
* |
|
Canberra |
|
40 |
* |
|
|
|
|
* includes joint venture and/or leased vineyards
4
BRL Hardy Wineries
BRL Hardy operates in the major warm area regions South Australia, Victoria and New South Wales and also operates in a number of premium cool areas of Australia
BRL Hardy carries out substantially all of its packaging at its own facilities at Reynell and Houghton (glass) and Berri and Stanley (cask)
|
|
|
Processing |
|
Packaging Capacity |
|
|
|
|
Capacity |
|
(9 litre case |
|
|
Winery |
|
(tonnes) |
|
equivalents) |
|
|
Australia |
|
|
|
|
|
|
Berri Estates |
|
120,000 |
|
5.1 million |
|
|
Drylands |
|
2,000 |
|
|
|
|
Houghton |
|
8,000 |
|
1.7 million |
|
|
Kamberra |
|
1,500 |
|
|
|
|
Leasingham |
|
5,500 |
|
|
|
|
Nannup |
|
3,000 |
|
|
|
|
Pipers River |
|
1,000 |
|
|
|
|
Renmano |
|
22,500 |
|
|
|
|
Reynella |
|
|
|
10.3 million |
|
|
Stanley |
|
75,000 |
|
6.7 million |
|
|
Stonehaven |
|
12,000 |
|
|
|
|
Tintara |
|
7,000 |
|
|
|
|
New Zealand |
|
|
|
|
|
|
Huapai |
|
4,000 |
|
1.0 million |
|
|
France |
|
|
|
|
|
|
Domaine de la |
|
3,000 |
|
|
|
|
Baume |
|
|
|
|
|
|
|
|
264,500 |
|
24.8 million |
|

5
KEY FINANCIAL INFORMATION
|
|
|
|
|
|
|
|
|
|
|
|
|
|
|
CAGR |
|
||||||
|
|
|
1996 |
|
1997 |
|
1998 |
|
1999 |
|
2000 |
|
2001 |
|
5 Yrs |
|
||||||
|
|
|
|
|
|
|
|
|
|
|
|
|
|
|
|
|
||||||
|
Sales Revenue |
|
287,806 |
|
350,256 |
|
430,878 |
|
515,430 |
|
627,434 |
|
757,608 |
|
21.4 |
% |
||||||
|
|
|
|
|
|
|
|
|
|
|
|
|
|
|
|
|
||||||
|
EBIT |
|
39,333 |
|
49,225 |
|
61,679 |
|
82,555 |
|
102,276 |
|
124,248 |
|
25.9 |
% |
||||||
|
|
|
|
|
|
|
|
|
|
|
|
|
|
|
|
|
||||||
|
Operating Profit |
|
32,251 |
|
41,893 |
|
57,482 |
|
72,971 |
|
86,010 |
|
101,858 |
|
25.9 |
% |
||||||
|
(before tax and abnormals) |
|
|
|
|
|
|
|
|
|
|
|
|
|
|
|
||||||
|
|
|
|
|
|
|
|
|
|
|
|
|
|
|
|
|
||||||
|
Operating Profits |
|
21,208 |
|
28,401 |
|
38,551 |
|
48,551 |
|
59,518 |
|
72,159 |
|
27.7 |
% |
||||||
|
(after tax and before abnormals) |
|
|
|
|
|
|
|
|
|
|
|
|
|
|
|
||||||
|
|
|
|
|
|
|
|
|
|
|
|
|
|
|
|
|
||||||
|
Operating Profit After Tax/Sales |
|
7.4 |
% |
8.1 |
% |
8.9 |
% |
9.4 |
% |
9.5 |
% |
9.5 |
% |
|
|
||||||
|
|
|
|
|
|
|
|
|
|
|
|
|
|
|
|
|
||||||
|
Net Tangible Asset Backing |
|
$ |
1.48 |
|
$ |
1.79 |
|
$ |
2.04 |
|
$ |
2.43 |
|
$ |
2.78 |
|
$ |
3.73 |
|
|
|
|
|
|
|
|
|
|
|
|
|
|
|
|
|
|
|
|
||||||
|
Gearing -- Debt/Equity |
|
57.7 |
% |
40.7 |
% |
50.2 |
% |
63.7 |
% |
69.2 |
% |
67.7 |
% |
|
|
||||||
|
Debt/Market Cap |
|
29.4 |
% |
16.1 |
% |
19.8 |
% |
21.7 |
% |
25.9 |
% |
23.9 |
% |
|
|
||||||
|
|
|
|
|
|
|
|
|
|
|
|
|
|
|
|
|
||||||
|
EPS (Basic) |
|
18.1 |
c |
23.3 |
c |
28.7 |
c |
*36.0 |
c |
*43.0 |
c |
45.7 |
c |
20.4 |
% |
||||||
*Includes effect of tax rate change on future tax liabilities
6
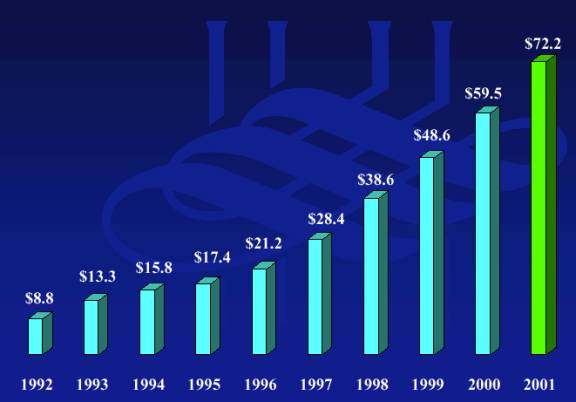
GROUP OPERATING PROFIT AFTER TAX

7
GROUP SALES REVENUE

8
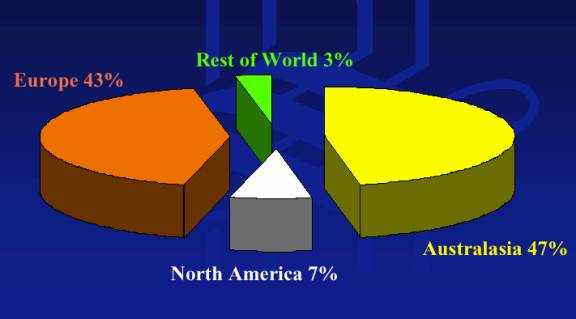
SALES REVENUE BY REGION

9
NET PROFIT BEFORE INTEREST & TAX
|
|
|
1997 |
|
1998 |
|
1999 |
|
2000 |
|
2001 |
|
% Inc |
|
4 Year |
|
|
|
|
$000 |
|
$000 |
|
$000 |
|
$000 |
|
$000 |
|
00/01 |
|
CAGR |
|
|
|
|
|
|
|
|
|
|
|
|
|
|
|
|
|
|
|
Australasia |
|
37,183 |
|
39,560 |
|
45,166 |
|
41,321 |
|
46,794 |
|
10.0 |
% |
5.9 |
% |
|
Europe |
|
11,043 |
|
20,479 |
|
33,199 |
|
52,067 |
|
71,589 |
|
37.4 |
% |
59.6 |
% |
|
North America |
|
272 |
|
655 |
|
2,868 |
|
7,583 |
|
5,282 |
|
(30.3 |
%) |
110.0 |
% |
|
Rest of World |
|
727 |
|
985 |
|
1,322 |
|
1,395 |
|
1,776 |
|
27.3 |
% |
25.0 |
% |
|
|
|
|
|
|
|
|
|
|
|
|
|
|
|
|
|
|
|
|
49,225 |
|
61,679 |
|
82,555 |
|
102,276 |
|
124,248 |
|
21.4 |
% |
26.1 |
% |
10
GROUP SALES BY PRODUCT TYPE

11