EX-99.1
Published on October 6, 2026
Exhibit 99.1

Delivers EPS Growth Driven by Net Sales and Business Division Operating Income Growth
Beer Business Accelerates Category Leading Share Gains Across U.S. Tracked Channels
Returns an Additional $400 Million to Shareholders Through Share Repurchases and Dividends
| Net Sales | Operating Income (Loss) | EPS | |||||||||
Second Quarter Fiscal 2027 Financial Highlights | in millions, except per share data | |||||||||||
| Reported | $2,633 | $805 | $3.32 | ||||||||
| % Change | 6% | (8%) | 25% | ||||||||
| Comparable | $2,633 | $897 | $3.74 | ||||||||
| % Change | 6% | 1% | 3% | ||||||||
Note: A list of defined terms, including definitions of reported, comparable, and organic, as well as reconciliations of non-GAAP financial measures are contained elsewhere in this release. Comparable and organic amounts are non-GAAP financial measures.
HIGHLIGHTS
•Generates reported EPS of $3.32 and comparable EPS of $3.74
•Beer Business delivers both net sales and operating income growth of 5% and 1%, respectively, while leading the category in dollar and volume share gains, outperforming the total beer category by 4 percentage points in year-over-year dollar and volume sales across Circana U.S. tracked channels
•Wine and Spirits Business delivers net sales growth of 17% and depletions growth of 10.2%, outperforming the total wine and spirits category in both dollar and volume sales in Circana U.S. tracked channels as the wine portfolio was the #3 dollar share gainer in the total wine category
•Generates year-to-date operating cash flow of $1.5 billion and free cash flow of $1.1 billion, a decrease of 1% and an increase of 4%, respectively
•Updates fiscal 2027 reported EPS outlook to $11.85 - $12.55, and reaffirms comparable EPS outlook of $11.20 - $11.90, operating cash flow target of $2.4 - $2.5 billion, and free cash flow target of $1.6 - $1.7 billion
•Repurchases $530 million of shares year-to-date through September 2026
•Declares quarterly cash dividend of $1.03 per share of Class A Common Stock
 | “During the second quarter, our portfolio of iconic brands continued to resonate with consumers. We have sharpened our execution and increased investment across the business, and are beginning to see early returns through accelerating dollar and volume share gains in both our Beer and Wine & Spirits businesses relative to the first quarter. As a result, we were the #1 dollar share gainer in beverage alcohol |  | “Through the first half of fiscal 2027, our strong cash flow generation enabled us to continue executing our disciplined and balanced capital allocation priorities. We maintained our target comparable net leverage ratio of ~3.0x, returned more than $800 million to shareholders through share repurchases and dividends, and continued to invest in our business through increased | |||||||||||
during the second quarter. Looking ahead, we remain focused on building on this momentum by expanding our reach across more consumers and occasions, while investing behind the brands and capabilities that will support our next phase of growth.” | brand marketing support. As we look to the second half of the year, we remain committed to supporting long-term growth, maintaining financial flexibility, and returning capital to shareholders.” | |||||||||||||
Nicholas Fink - President & CEO | Garth Hankinson - Executive Vice President & CFO | |||||||||||||
Constellation Brands, Inc. Q2 FY 2027 Earnings Release | #WORTHREACHINGFOR I 1 | ||||

 | BEER | ||||||||||||||||
| Shipments | Depletions | Net Sales | Operating Income (Loss) | ||||||||||||||
| Three Months Ended | in millions; branded product, 24-pack, 12-ounce case equivalents | |||||||||||||||||
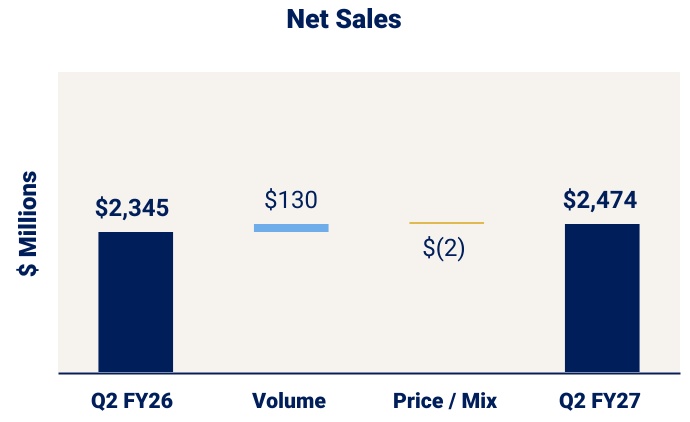
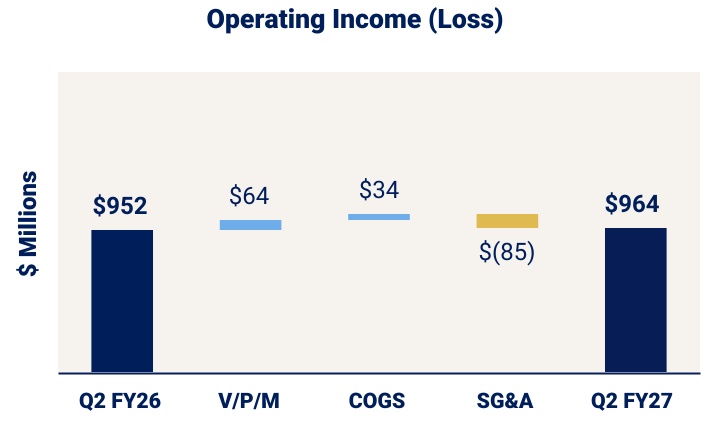
| August 31, 2026 | 123.9 | $2,473.6 | $964.2 | ||||||||||||||
| August 31, 2025 | 117.4 | $2,345.0 | $951.6 | ||||||||||||||
| % Change | 5.5% | (0.6%) | 5% | 1% | |||||||||||||
HIGHLIGHTS
•Net sales increased 5% driven by a 5.5% increase in shipment volumes.
•Operating margin decreased 160 bps to 39.0% as lower tariff expenses and favorable fixed cost absorption were more than offset by increased marketing investment and other SG&A spend.
•Depletions decreased 0.6% as declines for Modelo Especial of approximately 2% and Corona Extra of approximately 5% were partially offset by growth from Pacifico, Victoria, and the Modelo Chelada brands of approximately 19%, 15%, and 5%, respectively. One additional sell day during the quarter was largely offset by a shift in the timing of the Labor Day holiday, resulting in minimal impact on underlying depletion trends.
•Our Beer Business ranked as the #1 dollar and volume share gainer in Circana U.S. tracked channels and had 5 of the top-15 dollar share gaining brands across the entire U.S. beer category:
◦Modelo Especial maintained its position as the #1 brand by dollar sales and was the #3 dollar share gainer. Within the brand family, Modelo Chelada Limón y Sal was the #6 dollar share gainer;
◦Corona Extra remained a top-five brand by dollar sales, while Corona Familiar was the #14 dollar share gainer;
◦Pacifico and Victoria were the #2 and #10 dollar share gainers, respectively, and Pacifico became a top-10 brand by dollar sales.
Note: totals may not sum due to rounding
SPIKEDADE ACQUISITION
Subsequent to the quarter, we acquired SpikedAde, a differentiated, consumer-led spirit-based RTD brand competing in the emerging “Ade” segment. The addition of SpikedAde to our portfolio of iconic brands is consistent with our strategy to selectively expand into new demand spaces aimed at sustainable consumer trends, strengthens our position in the fast-growing RTD category, and remains aligned with our disciplined capital allocation priorities. The transaction included a $75 million payment at close for 100% ownership of the business, as well as additional contingent consideration of up to $278 million payable over five years based on the future performance of the SpikedAde business. The acquisition does not impact our fiscal 2027 outlook below.

Constellation Brands, Inc. Q2 FY 2027 Earnings Release | #WORTHREACHINGFOR I 2 | ||||
 | WINE AND SPIRITS | ||||||||||||||||
| Shipments | Depletions | Net Sales | Operating Income (Loss) | ||||||||||||||
| Three Months Ended | in millions; branded product, 9-liter case equivalents | |||||||||||||||||
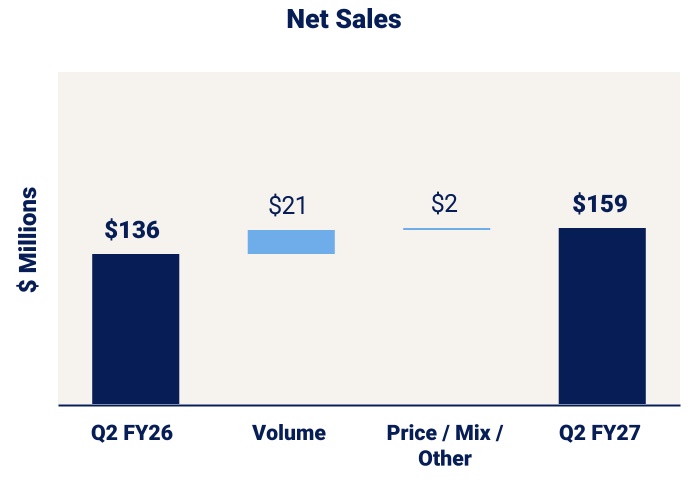
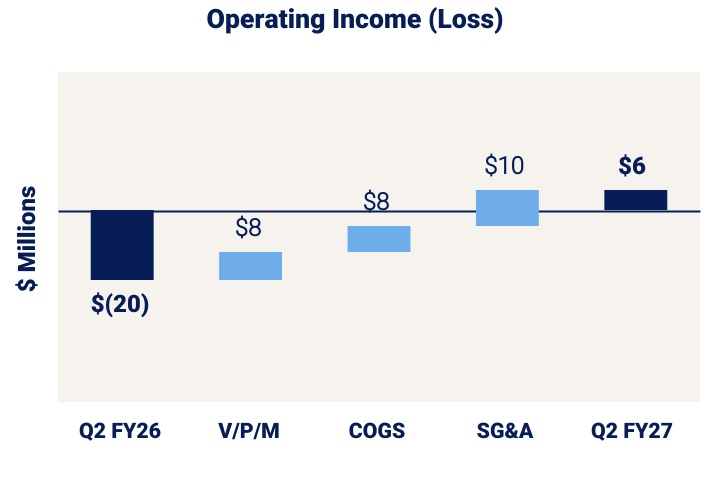
| August 31, 2026 | 1.5 | $159.4 | $6.1 | ||||||||||||||
| August 31, 2025 | 1.3 | $136.0 | $(19.8) | ||||||||||||||
| % Change | 15.4% | 10.2% | 17% | 131% | |||||||||||||
HIGHLIGHTS
•Net sales increased 17% driven by a 15.4% increase in shipment volumes.
•Operating margin improved to 3.8% driven by favorability in COGS from recoveries of U.S. tariffs and savings across marketing and other SG&A from our optimization and restructuring initiatives.
•Depletions increased 10.2% driven by growth from Kim Crawford and Mi CAMPO of approximately 11% and 51%, respectively.
•Across Circana U.S. tracked channels, our wine and spirits portfolio outpaced the total wine and spirits category in both dollar and volume sales, as our wine portfolio was the #3 dollar share gainer in the total wine category.
Note: totals may not sum due to rounding

Constellation Brands, Inc. Q2 FY 2027 Earnings Release | #WORTHREACHINGFOR I 3 | ||||
 | OUTLOOK | ||||
Enterprise and Wine and Spirits growth (decline) net sales assumptions for fiscal 2027 exclude $142 million for the March 1, 2025 to June 1, 2025, period that are no longer part of year-over-year results following the 2025 Wine Divestitures. The table sets forth management's current EPS expectations for fiscal 2027 compared to fiscal 2026 actual results. | ||||||||||||||||||||
| Reported | Comparable | |||||||||||||||||||
FY27 Estimate | FY26 Actual | FY27 Estimate | FY26 Actual | |||||||||||||||||
Fiscal Year Ending February 28 | $11.85 - $12.55 | $9.61 | $11.20 - $11.90 | $11.82 | ||||||||||||||||
| Fiscal 2027 Guidance Assumptions: | ||||||||||||||||||||
•Enterprise: organic net sales growth (decline) of (1)% - 1% ◦Beer: net sales growth (decline) of (1)% - 1% ◦Wine and Spirits: organic net sales growth (decline) of (1)% - 1% •Enterprise operating margin: reported of 31% - 32%; comparable of 32% - 33% ◦Beer: operating margin of 37% - 38% ◦Wine and Spirits: operating margin of 5% - 6% | •Tax rate: reported ~12%; comparable ~20% •Operating cash flow: $2.4 - $2.5 billion •Capital expenditures: ~$800 million •Free cash flow: $1.6 - $1.7 billion | |||||||||||||||||||
QUARTERLY DIVIDEND
On October 6, 2026, Constellation’s board of directors declared a quarterly cash dividend of $1.03 per share of Class A Common Stock payable on November 13, 2026, to stockholders of record as of the close of business on October 30, 2026.
† A copy of this release, including the attachments and other financial information that may be discussed during the call, will be available on our investor relations website, ir.cbrands.com, prior to the call.
ABOUT CONSTELLATION BRANDS Constellation Brands (NYSE: STZ), a leading U.S.-based company, is an international producer and marketer of beer, wine, and spirits with operations in the U.S., Mexico, New Zealand, and Italy. Our mission is to build brands that people love because we believe elevating human connections is Worth Reaching For. It’s worth our dedication, hard work, and calculated risks to anticipate market trends and deliver for our consumers, shareholders, employees, and industry. This dedication is what has driven us to become one of the fastest-growing, large CPG companies in the U.S. at retail, and it drives our pursuit to deliver what’s next. Every day, people reach for brands from our high-end, imported beer portfolio anchored by the iconic Corona Extra and Modelo Especial, a flavorful lineup of Modelo Cheladas, and favorites like Pacifico, and Victoria; our exceptional wine brands including The Prisoner Wine Company, Robert Mondavi Winery, Kim Crawford, Schrader Cellars, and Lingua Franca; and our craft spirits brands such as Mi CAMPO Tequila and High West Whiskey. As an agriculture-based company, we strive to operate in a way that is sustainable and responsible. Our ESG strategy is embedded into our business and we focus on serving as good stewards of the environment, investing in our communities, and promoting responsible beverage alcohol consumption. We believe these aspirations in support of our longer-term business strategy allow us to contribute to a future that is truly Worth Reaching For. To learn more, visit www.cbrands.com and follow us on LinkedIn and Instagram. | ||
MEDIA CONTACTS | INVESTOR RELATIONS CONTACTS | ||||||||||||||||
| Maggie Bowman | 213-500-2401 | maggie.bowman@cbrands.com | Blair Veenema | 585-284-4433 | blair.veenema@cbrands.com | ||||||||||||
| Carissa Guzski | 315-525-7362 | carissa.guzski@cbrands.com | David Paccapaniccia | 585-282-7227 | david.paccapaniccia@cbrands.com | ||||||||||||
| Emily Blanchard | 585-765-5181 | emily.blanchard@cbrands.com | |||||||||||||||
Constellation Brands, Inc. Q2 FY 2027 Earnings Release | #WORTHREACHINGFOR I 4 | ||||
SUPPLEMENTAL INFORMATION
Reported basis are derived from amounts as reported under GAAP. Comparable basis are amounts which exclude comparable adjustments, as they are not reflective of core operations of the segments. The company’s measure of segment profitability excludes comparable adjustments, which is consistent with the measure used by management to evaluate results. The company discusses various non-GAAP measures in this release. Financial statements, as well as supplemental schedules and tables reconciling non-GAAP measures, together with definitions of these measures and the reasons management uses these measures, are included in this release.
FORWARD-LOOKING STATEMENTS
The statements made under the heading Outlook and all statements other than statements of historical fact set forth in this release, including statements regarding our business strategy, priorities, and objectives, expanding our reach, investing behind our brands and capabilities, our growth and long-term value creation, our capital allocation priorities and targets, maintaining financial flexibility, returning capital to shareholders, future operations, financial position, expected net sales, operating margin, tax rate, operating cash flow, capital expenditures, free cash flow, EPS, future payments of dividends, amount, manner, and timing of share repurchases under the share repurchase authorization, and prospects, plans, and objectives of management, as well as information concerning expected actions of third parties, are forward-looking statements that involve risks and uncertainties, many of which are beyond our control, and which could cause actual results to differ materially from those set forth in, or implied by, the Projections.
When used in this release, the words “anticipate,” “believe,” “expect,” “intend,” “outlook,” “will,“ “encouraged,” “approach,” “ability,” “enable,” and similar expressions are intended to identify Projections, although not all Projections contain such identifying words. All Projections speak only as of the date of this release. We undertake no obligation to update or revise any Projections, whether as a result of new information, future events, or otherwise. The Projections are based on management’s current estimates, expectations, plans, and timetables, and, unless otherwise noted, do not take into account the impact of any planned or future acquisition, investment, merger, other business combination, or divestiture (including, in each case, any associated amount of incremental contingent consideration payment paid or received), cost savings, restructuring, operating, or efficiency initiatives, tariff changes, impacts, and responses, or financing or share repurchases that may be completed after the issuance of this release. Although we believe that the estimates, expectations, plans, and timetables reflected in the Projections are reasonable, we can give no assurance that such estimates, expectations, plans, and timetables will prove to be correct. In addition to the risks and uncertainties of ordinary business operations and conditions in the general economy and markets in which we compete, the Projections contained in this release are also subject to the risk, uncertainty, and possible variance from our current expectations regarding:
•potential declines in the consumption of products we sell and our dependence on sales of our beer brands;
•our President and Chief Executive Officer transition;
•impacts of our acquisition, divestiture, investment, and new product development strategies and activities, including from the SpikedAde acquisition and the amount of contingent consideration, if any, that may be paid;
•dependence upon our trademarks and proprietary rights, including the failure to protect our intellectual property rights;
•potential damage to our reputation;
•competition in our industry and for talent;
•economic and other uncertainties associated with our international operations, including tariffs;
•water, agricultural and other raw material, and packaging material supply, production, and/or transportation difficulties, disruptions, and impacts, including limited groups of certain suppliers;
•reliance on complex information systems and third-party global networks as well as risks associated with cybersecurity and artificial intelligence;
•dependence on limited facilities for production of our beer brands and impacts from our Brewery Projects;
•operational disruptions or catastrophic loss to our breweries, wineries, other facilities, or distribution systems;
•severe weather, natural and man-made disasters, climate change, environmental sustainability and corporate social responsibility-related regulatory compliance, and failure to meet environmental sustainability and corporate social responsibility commitments and aspirations;
•the success of our cost savings, restructuring, and efficiency initiatives;
•reliance on wholesale distributors, major retailers, and government agencies;
•food safety and quality, including contamination and product degradation from diseases, pests, weather, and other conditions;
•communicable infection or disease outbreaks, pandemics, or other widespread public health crises impacting our consumers, Customers, employees, and/or suppliers;
•effects of employee labor activities that could increase our costs;our indebtedness and credit ratings, interest rate fluctuations, and credit market disruptions or volatility;
•our international operations, worldwide and regional economic trends and financial market conditions, geopolitical uncertainty, including as a result of the conflict in the Middle East, or other governmental rules and regulations;
•class action or other litigation we face or may face, including related to alleged securities law violations, abuse or misuse of our products, product liability, marketing or sales practices, or other matters;
•potential impairments of our intangible assets, such as goodwill and trademarks;
•changes to tax laws, fluctuations in our effective tax rate, accounting for tax positions, resolution of tax disputes, changes to accounting standards, elections, assertions, or policies, and the potential impact of a global minimum tax rate;
•uncertainties related to future cash dividends and share repurchases, which may affect the price of our common stock;
•ownership of our Class A Common Stock by certain individuals and entities affiliated with the Sands family and their Board of Director nomination rights;
•the choice-of-forum provision in our amended and restated by-laws regarding certain shareholder litigation; and
•other factors and uncertainties disclosed in our filings with the SEC, including our Annual Report on Form 10-K for the fiscal year ended February 28, 2026, which could cause actual future performance to differ materially from our current expectations.
Constellation Brands, Inc. Q2 FY 2027 Earnings Release | #WORTHREACHINGFOR I 5 | ||||
CONSTELLATION BRANDS, INC. AND SUBSIDIARIES
CONDENSED CONSOLIDATED BALANCE SHEETS
CONDENSED CONSOLIDATED BALANCE SHEETS
(in millions)
(unaudited)
(unaudited)
| August 31, 2026 | February 28, 2026 | ||||||||||
| ASSETS | |||||||||||
| Current assets: | |||||||||||
| Cash and cash equivalents | $ | 98.5 | $ | 102.4 | |||||||
| Accounts receivable | 678.1 | 658.2 | |||||||||
| Inventories | 1,378.6 | 1,433.9 | |||||||||
| Prepaid expenses and other | 804.3 | 711.8 | |||||||||
| Total current assets | 2,959.5 | 2,906.3 | |||||||||
Property, plant, and equipment, net | 8,653.2 | 8,520.9 | |||||||||
| Goodwill | 5,269.3 | 5,233.9 | |||||||||
| Intangible assets | 2,531.2 | 2,533.0 | |||||||||
| Deferred income taxes | 1,339.3 | 1,370.3 | |||||||||
| Other assets | 1,311.2 | 1,336.1 | |||||||||
| Total assets | $ | 22,063.7 | $ | 21,900.5 | |||||||
| LIABILITIES AND STOCKHOLDER’S EQUITY | |||||||||||
| Current liabilities: | |||||||||||
| Short-term borrowings | $ | 116.5 | $ | 272.0 | |||||||
| Current maturities of long-term debt | 1,103.0 | 603.6 | |||||||||
| Accounts payable | 999.4 | 960.2 | |||||||||
| Other accrued expenses and liabilities | 744.9 | 854.0 | |||||||||
| Total current liabilities | 2,963.8 | 2,689.8 | |||||||||
| Long-term debt, less current maturities | 9,096.2 | 9,692.9 | |||||||||
| Deferred income taxes and other liabilities | 1,124.3 | 1,130.9 | |||||||||
| Total liabilities | 13,184.3 | 13,513.6 | |||||||||
| CBI stockholders’ equity | 8,586.9 | 8,082.4 | |||||||||
| Noncontrolling interests | 292.5 | 304.5 | |||||||||
| Total stockholders’ equity | 8,879.4 | 8,386.9 | |||||||||
| Total liabilities and stockholders’ equity | $ | 22,063.7 | $ | 21,900.5 | |||||||
Constellation Brands, Inc. Q2 FY 2027 Earnings Release | #WORTHREACHINGFOR I 6 | ||||
CONSTELLATION BRANDS, INC. AND SUBSIDIARIES
CONSOLIDATED STATEMENTS OF OPERATIONS
CONSOLIDATED STATEMENTS OF OPERATIONS
(in millions, except per share data)
(unaudited)
(unaudited)
| Three Months Ended | Six Months Ended | ||||||||||||||||||||||
| August 31, 2026 | August 31, 2025 | August 31, 2026 | August 31, 2025 | ||||||||||||||||||||
| NET INCOME (LOSS) ATTRIBUTABLE TO CBI | |||||||||||||||||||||||
| Sales | $ | 2,816.7 | $ | 2,653.9 | $ | 5,407.1 | $ | 5,331.4 | |||||||||||||||
| Excise taxes | (183.7) | (172.9) | (341.4) | (335.4) | |||||||||||||||||||
| Net sales | 2,633.0 | 2,481.0 | 5,065.7 | 4,996.0 | |||||||||||||||||||
| Cost of product sold | (1,240.0) | (1,171.0) | (2,352.1) | (2,419.4) | |||||||||||||||||||
| Gross profit | 1,393.0 | 1,310.0 | 2,713.6 | 2,576.6 | |||||||||||||||||||
| Selling, general, and administrative expenses | (538.2) | (436.0) | (995.2) | (936.7) | |||||||||||||||||||
Asset impairment and related expenses | (49.8) | — | (68.1) | (52.1) | |||||||||||||||||||
| Operating income (loss) | 805.0 | 874.0 | 1,650.3 | 1,587.8 | |||||||||||||||||||
| Income (loss) from unconsolidated investments | 7.8 | (3.5) | 8.3 | (7.0) | |||||||||||||||||||
| Interest expense, net | (83.4) | (87.6) | (169.2) | (186.5) | |||||||||||||||||||
| Income (loss) before income taxes | 729.4 | 782.9 | 1,489.4 | 1,394.3 | |||||||||||||||||||
| (Provision for) benefit from income taxes | (147.1) | (296.8) | (235.2) | (384.4) | |||||||||||||||||||
| Net income (loss) | 582.3 | 486.1 | 1,254.2 | 1,009.9 | |||||||||||||||||||
| Net (income) loss attributable to noncontrolling interests | (16.5) | (20.1) | (34.6) | (27.8) | |||||||||||||||||||
| Net income (loss) attributable to CBI | $ | 565.8 | $ | 466.0 | $ | 1,219.6 | $ | 982.1 | |||||||||||||||
| CLASS A COMMON STOCK | |||||||||||||||||||||||
| Net income (loss) per common share attributable to CBI – basic | $ | 3.32 | $ | 2.65 | $ | 7.12 | $ | 5.55 | |||||||||||||||
| Net income (loss) per common share attributable to CBI – diluted | $ | 3.32 | $ | 2.65 | $ | 7.11 | $ | 5.55 | |||||||||||||||
| Weighted average common shares outstanding – basic | 170.460 | 175.821 | 171.323 | 176.804 | |||||||||||||||||||
| Weighted average common shares outstanding – diluted | 170.601 | 175.938 | 171.503 | 176.957 | |||||||||||||||||||
| Cash dividends declared per common share | $ | 1.03 | $ | 1.02 | $ | 2.06 | $ | 2.04 | |||||||||||||||
Constellation Brands, Inc. Q2 FY 2027 Earnings Release | #WORTHREACHINGFOR I 7 | ||||
CONSTELLATION BRANDS, INC. AND SUBSIDIARIES CONSOLIDATED STATEMENTS OF CASH FLOWS (in millions) (unaudited) | |||||||||||
| Six Months Ended | |||||||||||
| August 31, 2026 | August 31, 2025 | ||||||||||
| CASH FLOWS FROM OPERATING ACTIVITIES | |||||||||||
| Net income (loss) | $ | 1,254.2 | $ | 1,009.9 | |||||||
| Adjustments to reconcile net income (loss) to net cash provided by (used in) operating activities: | |||||||||||
| Deferred tax provision (benefit) | 26.8 | 277.6 | |||||||||
| Depreciation | 194.4 | 207.9 | |||||||||
| Stock-based compensation | 34.9 | 32.1 | |||||||||
| Noncash lease expense | 67.0 | 62.6 | |||||||||
Asset impairment and related expenses | 68.1 | 52.1 | |||||||||
| Change in operating assets and liabilities, net of effects from purchase and sale of business: | |||||||||||
| Accounts receivable | (18.2) | 72.2 | |||||||||
| Inventories | 3.3 | (48.3) | |||||||||
| Prepaid expenses and other current assets | (45.7) | (56.8) | |||||||||
| Accounts payable | 72.8 | 53.0 | |||||||||
Contract liabilities | 6.5 | (50.4) | |||||||||
| Other accrued expenses and liabilities | (197.9) | (57.0) | |||||||||
| Other | 12.4 | (65.6) | |||||||||
| Total adjustments | 224.4 | 479.4 | |||||||||
| Net cash provided by (used in) operating activities | 1,478.6 | 1,489.3 | |||||||||
| CASH FLOWS FROM INVESTING ACTIVITIES | |||||||||||
| Purchase of property, plant, and equipment | (354.1) | (410.1) | |||||||||
| Purchase of business, net of cash acquired | (15.3) | — | |||||||||
| Proceeds from sale of assets | 4.1 | 30.8 | |||||||||
| Proceeds from sale of business | 13.9 | 851.1 | |||||||||
| Other investing activities | 1.0 | (7.0) | |||||||||
| Net cash provided by (used in) investing activities | (350.4) | 464.8 | |||||||||
Constellation Brands, Inc. Q2 FY 2027 Earnings Release | #WORTHREACHINGFOR I 8 | ||||
CONSTELLATION BRANDS, INC. AND SUBSIDIARIES CONSOLIDATED STATEMENTS OF CASH FLOWS (in millions) (unaudited) | |||||||||||
| Six Months Ended | |||||||||||
| August 31, 2026 | August 31, 2025 | ||||||||||
| CASH FLOWS FROM FINANCING ACTIVITIES | |||||||||||
| Proceeds from issuance of long-term debt | 499.7 | 499.1 | |||||||||
| Principal payments of long-term debt | (602.1) | (902.1) | |||||||||
| Net proceeds from (repayments of) short-term borrowings | (155.5) | (554.2) | |||||||||
| Dividends paid | (353.8) | (361.1) | |||||||||
| Purchase of treasury stock | (454.7) | (604.0) | |||||||||
| Payment of excise tax on share repurchases | (8.8) | (9.9) | |||||||||
| Proceeds from shares issued under equity compensation plans | 7.3 | 13.0 | |||||||||
| Payments of minimum tax withholdings on stock-based payment awards | (10.2) | (9.5) | |||||||||
| Payments of debt issuance, debt extinguishment, and other financing costs | (3.1) | (5.4) | |||||||||
| Distributions to noncontrolling interests | (50.0) | (17.5) | |||||||||
| Payment of contingent consideration | (0.3) | (1.5) | |||||||||
| Net cash provided by (used in) financing activities | (1,131.5) | (1,953.1) | |||||||||
| Effect of exchange rate changes on cash and cash equivalents | (0.6) | 2.9 | |||||||||
| Net increase (decrease) in cash and cash equivalents | (3.9) | 3.9 | |||||||||
Cash and cash equivalents, beginning of period | 102.4 | 68.1 | |||||||||
Cash and cash equivalents, end of period | $ | 98.5 | $ | 72.0 | |||||||
Constellation Brands, Inc. Q2 FY 2027 Earnings Release | #WORTHREACHINGFOR I 9 | ||||
CONSTELLATION BRANDS, INC. AND SUBSIDIARIES
RECONCILIATION OF REPORTED AND ORGANIC NET SALES
(in millions)
(unaudited)
RECONCILIATION OF REPORTED AND ORGANIC NET SALES
(in millions)
(unaudited)
For periods of acquisition, we define organic net sales as current period reported net sales less net sales of products of acquired businesses reported for the current period, as appropriate. For periods of divestiture, we define organic net sales as prior period reported net sales less net sales of products of divested businesses reported for the prior period, as appropriate. We provide organic net sales because management uses this information in monitoring and evaluating the underlying business trends of our core operations. In addition, we believe this information provides our investors and other external users valuable insight on underlying business trends and results in order to evaluate year-over-year financial performance.
| Three Months Ended | Six Months Ended | ||||||||||||||||||||||||||||||||||
| August 31, 2026 | August 31, 2025 | Percent Change | August 31, 2026 | August 31, 2025 | Percent Change | ||||||||||||||||||||||||||||||
| CONSOLIDATED | |||||||||||||||||||||||||||||||||||
| Net sales | $ | 2,633.0 | $ | 2,481.0 | 6 | % | $ | 5,065.7 | $ | 4,996.0 | 1 | % | |||||||||||||||||||||||
Less: divestiture (1) | — | — | — | (142.0) | |||||||||||||||||||||||||||||||
| Organic net sales | $ | 2,633.0 | $ | 2,481.0 | 6 | % | $ | 5,065.7 | $ | 4,854.0 | 4 | % | |||||||||||||||||||||||
| BEER | |||||||||||||||||||||||||||||||||||
| Net sales | $ | 2,473.6 | $ | 2,345.0 | 5 | % | $ | 4,757.1 | $ | 4,579.5 | 4 | % | |||||||||||||||||||||||
| WINE AND SPIRITS | |||||||||||||||||||||||||||||||||||
| Net sales | $ | 159.4 | $ | 136.0 | 17 | % | $ | 308.6 | $ | 416.5 | (26 | %) | |||||||||||||||||||||||
Less: divestiture (1) | — | — | — | (142.0) | |||||||||||||||||||||||||||||||
| Organic net sales | $ | 159.4 | $ | 136.0 | 17 | % | $ | 308.6 | $ | 274.5 | 12 | % | |||||||||||||||||||||||
(1)For the applicable period:
| Six Months Ended August 31, 2025 | ||||||||
2025 Wine Divestitures | 3/1/2025 - 5/31/2025 | |||||||
Constellation Brands, Inc. Q2 FY 2027 Earnings Release | #WORTHREACHINGFOR I 10 | ||||
CONSTELLATION BRANDS, INC. AND SUBSIDIARIES
SUPPLEMENTAL SHIPMENT AND DEPLETION INFORMATION
(in millions)
(unaudited)
SUPPLEMENTAL SHIPMENT AND DEPLETION INFORMATION
(in millions)
(unaudited)
| Three Months Ended | Six Months Ended | ||||||||||||||||||||||||||||||||||
| August 31, 2026 | August 31, 2025 | Percent Change | August 31, 2026 | August 31, 2025 | Percent Change | ||||||||||||||||||||||||||||||
| BEER | |||||||||||||||||||||||||||||||||||
| (branded product, 24-pack, 12-ounce case equivalents) | |||||||||||||||||||||||||||||||||||
| Shipments | 123.9 | 117.4 | 5.5 | % | 237.2 | 228.7 | 3.7 | % | |||||||||||||||||||||||||||
| Depletions | (0.6 | %) | (0.5 | %) | |||||||||||||||||||||||||||||||
| WINE AND SPIRITS | |||||||||||||||||||||||||||||||||||
| (branded product, 9-liter case equivalents) | |||||||||||||||||||||||||||||||||||
| Shipments | 1.5 | 1.3 | 15.4 | % | 2.9 | 5.2 | (44.2 | %) | |||||||||||||||||||||||||||
Organic shipments (1) | 1.5 | 1.3 | 15.4 | % | 2.9 | 2.6 | 11.5 | % | |||||||||||||||||||||||||||
Depletions (1) | 10.2 | % | 8.7 | % | |||||||||||||||||||||||||||||||
(1)Includes adjustments to remove divestiture volumes for the applicable period:
| Six Months Ended August 31, 2025 | ||||||||
2025 Wine Divestitures | 3/1/2025 - 5/31/2025 | |||||||
Constellation Brands, Inc. Q2 FY 2027 Earnings Release | #WORTHREACHINGFOR I 11 | ||||
CONSTELLATION BRANDS, INC. AND SUBSIDIARIES
SUMMARIZED SEGMENT, INCOME (LOSS) FROM UNCONSOLIDATED INVESTMENTS,
AND DEPRECIATION AND AMORTIZATION INFORMATION
(in millions)
(unaudited)
SUMMARIZED SEGMENT, INCOME (LOSS) FROM UNCONSOLIDATED INVESTMENTS,
AND DEPRECIATION AND AMORTIZATION INFORMATION
(in millions)
(unaudited)
Management excludes items that affect comparability from its evaluation of the results of each operating segment as these comparable adjustments are not reflective of core operations of the segments. Segment operating performance and the incentive compensation of segment management are evaluated based on core segment operating income (loss) which does not include the impact of these comparable adjustments. See page 14 for further information on comparable adjustments.
| Three Months Ended | Six Months Ended | ||||||||||||||||||||||||||||||||||
| August 31, 2026 | August 31, 2025 | Percent Change | August 31, 2026 | August 31, 2025 | Percent Change | ||||||||||||||||||||||||||||||
| CONSOLIDATED | |||||||||||||||||||||||||||||||||||
| Net sales | $ | 2,633.0 | $ | 2,481.0 | 6 | % | $ | 5,065.7 | $ | 4,996.0 | 1 | % | |||||||||||||||||||||||
| Gross profit | $ | 1,393.0 | $ | 1,310.0 | 6 | % | $ | 2,713.6 | $ | 2,576.6 | 5 | % | |||||||||||||||||||||||
| Operating income (loss) | $ | 805.0 | $ | 874.0 | (8 | %) | $ | 1,650.3 | $ | 1,587.8 | 4 | % | |||||||||||||||||||||||
| Operating margin | 30.6 | % | 35.2 | % | 32.6 | % | 31.8 | % | |||||||||||||||||||||||||||
| Income (loss) from unconsolidated investments | $ | 7.8 | $ | (3.5) | 323 | % | $ | 8.3 | $ | (7.0) | 219 | % | |||||||||||||||||||||||
| Depreciation and amortization | $ | 97.1 | $ | 103.1 | (6 | %) | $ | 195.0 | $ | 208.6 | (7 | %) | |||||||||||||||||||||||
| COMPARABLE ADJUSTMENTS | |||||||||||||||||||||||||||||||||||
| Gross profit | $ | (15.2) | $ | 15.2 | NM | $ | 23.1 | $ | (1.3) | NM | |||||||||||||||||||||||||
| Operating income (loss) | $ | (91.6) | $ | (12.2) | NM | $ | (80.5) | $ | (108.3) | NM | |||||||||||||||||||||||||
| Income (loss) from unconsolidated investments | $ | — | $ | (10.1) | NM | $ | — | $ | (10.1) | NM | |||||||||||||||||||||||||
| BEER | |||||||||||||||||||||||||||||||||||
| Net sales | $ | 2,473.6 | $ | 2,345.0 | 5 | % | $ | 4,757.1 | $ | 4,579.5 | 4 | % | |||||||||||||||||||||||
| Segment gross profit | $ | 1,337.7 | $ | 1,240.0 | 8 | % | $ | 2,555.9 | $ | 2,427.0 | 5 | % | |||||||||||||||||||||||
| Segment gross margin | 54.1 | % | 52.9 | % | 53.7 | % | 53.0 | % | |||||||||||||||||||||||||||
| Segment operating income (loss) | $ | 964.2 | $ | 951.6 | 1 | % | $ | 1,855.6 | $ | 1,825.0 | 2 | % | |||||||||||||||||||||||
| Segment operating margin | 39.0 | % | 40.6 | % | 39.0 | % | 39.9 | % | |||||||||||||||||||||||||||
| Segment depreciation and amortization | $ | 76.5 | $ | 82.6 | (7 | %) | $ | 153.8 | $ | 159.4 | (4 | %) | |||||||||||||||||||||||
| WINE AND SPIRITS | |||||||||||||||||||||||||||||||||||
| Net sales | $ | 159.4 | $ | 136.0 | 17 | % | $ | 308.6 | $ | 416.5 | (26 | %) | |||||||||||||||||||||||
| Segment gross profit | $ | 70.5 | $ | 54.8 | 29 | % | $ | 134.6 | $ | 150.9 | (11 | %) | |||||||||||||||||||||||
| Segment gross margin | 44.2 | % | 40.3 | % | 43.6 | % | 36.2 | % | |||||||||||||||||||||||||||
| Segment operating income (loss) | $ | 6.1 | $ | (19.8) | 131 | % | $ | 5.0 | $ | (25.8) | 119 | % | |||||||||||||||||||||||
| Segment operating margin | 3.8 | % | (14.6) | % | 1.6 | % | (6.2) | % | |||||||||||||||||||||||||||
| Segment income (loss) from unconsolidated investments | $ | 7.4 | $ | 7.5 | (1 | %) | $ | 8.3 | $ | 5.1 | 63 | % | |||||||||||||||||||||||
| Segment depreciation and amortization | $ | 15.4 | $ | 14.3 | 8 | % | $ | 30.9 | $ | 36.5 | (15 | %) | |||||||||||||||||||||||
| CORPORATE OPERATIONS AND OTHER | |||||||||||||||||||||||||||||||||||
| Segment operating income (loss) | $ | (73.7) | $ | (45.6) | (62 | %) | $ | (129.8) | $ | (103.1) | (26 | %) | |||||||||||||||||||||||
| Segment income (loss) from unconsolidated investments | $ | 0.4 | $ | (0.9) | 144 | % | $ | — | $ | (2.0) | 100% | ||||||||||||||||||||||||
| Segment depreciation and amortization | $ | 5.2 | $ | 6.2 | (16 | %) | $ | 10.3 | $ | 12.7 | (19 | %) | |||||||||||||||||||||||
Constellation Brands, Inc. Q2 FY 2027 Earnings Release | #WORTHREACHINGFOR I 12 | ||||
CONSTELLATION BRANDS, INC. AND SUBSIDIARIES
RECONCILIATIONS OF GAAP TO NON-GAAP FINANCIAL MEASURES
(in millions, except per share data)
(unaudited)
RECONCILIATIONS OF GAAP TO NON-GAAP FINANCIAL MEASURES
(in millions, except per share data)
(unaudited)
We report our financial results in accordance with GAAP. However, non-GAAP financial measures, as defined in the reconciliation tables below, are provided because management uses this information in evaluating the results of our core operations and/or internal goal setting. In addition, we believe this information provides our investors and other external users valuable insight on underlying business trends and results in order to evaluate year-over-year financial performance. See the tables below for supplemental financial data and corresponding reconciliations of these non-GAAP financial measures to GAAP financial measures for the periods presented. Non-GAAP financial measures should be considered in addition to, not as a substitute for, or superior to, our reported results prepared in accordance with GAAP.
| Three Months Ended | Six Months Ended | ||||||||||||||||||||||||||||||||||
| August 31, 2026 | August 31, 2025 | Percent Change | August 31, 2026 | August 31, 2025 | Percent Change | ||||||||||||||||||||||||||||||
| Operating income (loss) (GAAP) | $ | 805.0 | $ | 874.0 | (8 | %) | $ | 1,650.3 | $ | 1,587.8 | 4 | % | |||||||||||||||||||||||
| Comparable adjustments | 91.6 | 12.2 | 80.5 | 108.3 | |||||||||||||||||||||||||||||||
Less: divestiture (1) | — | — | — | (24.5) | |||||||||||||||||||||||||||||||
| Comparable operating income (loss) (Non-GAAP) | $ | 896.6 | $ | 886.2 | 1 | % | $ | 1,730.8 | $ | 1,671.6 | 4 | % | |||||||||||||||||||||||
| Comparable operating margin | 34.1 | % | 35.7 | % | 34.2 | % | 34.4 | % | |||||||||||||||||||||||||||
| Three Months Ended | Six Months Ended | ||||||||||||||||||||||||||||||||||
| August 31, 2026 | August 31, 2025 | Percent Change | August 31, 2026 | August 31, 2025 | Percent Change | ||||||||||||||||||||||||||||||
| Net income (loss) attributable to CBI (GAAP) | $ | 565.8 | $ | 466.0 | 21 | % | $ | 1,219.6 | $ | 982.1 | 24 | % | |||||||||||||||||||||||
| Comparable adjustments | 71.5 | 171.8 | 8.3 | 228.6 | |||||||||||||||||||||||||||||||
| Comparable net income (loss) attributable to CBI (Non-GAAP) | $ | 637.3 | $ | 637.8 | (0 | %) | $ | 1,227.9 | $ | 1,210.7 | 1 | % | |||||||||||||||||||||||
| Three Months Ended | Six Months Ended | ||||||||||||||||||||||||||||||||||
| August 31, 2026 | August 31, 2025 | Percent Change | August 31, 2026 | August 31, 2025 | Percent Change | ||||||||||||||||||||||||||||||
| EPS (GAAP) | $ | 3.32 | $ | 2.65 | 25 | % | $ | 7.11 | $ | 5.55 | 28 | % | |||||||||||||||||||||||
| Comparable adjustments | 0.42 | 0.98 | 0.05 | 1.29 | |||||||||||||||||||||||||||||||
Comparable EPS (Non-GAAP) | $ | 3.74 | $ | 3.63 | 3 | % | $ | 7.16 | $ | 6.84 | 5 | % | |||||||||||||||||||||||
| Weighted average common shares outstanding - diluted | 170.601 | 175.938 | 171.503 | 176.957 | |||||||||||||||||||||||||||||||
(1)Amount reflects gross profit less marketing that are no longer part of the results for the applicable period:
| Six Months Ended August 31, 2025 | ||||||||
2025 Wine Divestitures | 3/1/2025 - 5/31/2025 | |||||||
Constellation Brands, Inc. Q2 FY 2027 Earnings Release | #WORTHREACHINGFOR I 13 | ||||
CONSTELLATION BRANDS, INC. AND SUBSIDIARIES
RECONCILIATIONS OF GAAP TO NON-GAAP FINANCIAL MEASURES (continued)
(in millions, except per share data)
(unaudited)
RECONCILIATIONS OF GAAP TO NON-GAAP FINANCIAL MEASURES (continued)
(in millions, except per share data)
(unaudited)
The comparable adjustments that impacted comparability in our results for each period are as follows:
| Three Months Ended | Six Months Ended | ||||||||||||||||||||||
| August 31, 2026 | August 31, 2025 | August 31, 2026 | August 31, 2025 | ||||||||||||||||||||
| Settlements of undesignated commodity derivative contracts | $ | (14.8) | $ | 4.2 | $ | (24.2) | $ | 6.7 | |||||||||||||||
| Strategic business reconfiguration costs | (3.7) | (1.2) | (4.3) | (1.6) | |||||||||||||||||||
| Flow through of inventory step-up | (0.1) | (0.8) | (1.1) | (1.7) | |||||||||||||||||||
| Net gain (loss) on undesignated commodity derivative contracts | 3.4 | 13.0 | 52.7 | (4.7) | |||||||||||||||||||
| Comparable adjustments, Gross profit | (15.2) | 15.2 | 23.1 | (1.3) | |||||||||||||||||||
| Asset impairment and related expenses | (49.8) | — | (68.1) | (52.1) | |||||||||||||||||||
| Strategic business reconfiguration costs | (14.2) | — | (13.9) | (5.2) | |||||||||||||||||||
| 2025 Restructuring Initiative | (4.9) | (8.3) | (5.5) | (21.6) | |||||||||||||||||||
| Transition services agreements activity | (4.6) | (10.0) | (9.7) | (15.5) | |||||||||||||||||||
| Gain (loss) on sale of business | (1.8) | (14.9) | (4.3) | (16.3) | |||||||||||||||||||
| Other gains (losses) | (1.1) | 5.8 | (2.1) | 3.7 | |||||||||||||||||||
| Comparable adjustments, Operating income (loss) | (91.6) | (12.2) | (80.5) | (108.3) | |||||||||||||||||||
| Comparable adjustments, Income (loss) from unconsolidated investments | — | (10.1) | — | (10.1) | |||||||||||||||||||
| Comparable adjustments, Interest expense, net | — | (1.6) | (0.3) | (1.6) | |||||||||||||||||||
| Comparable adjustments, (Provision for) benefit from income taxes | 20.1 | (147.9) | 72.5 | (108.6) | |||||||||||||||||||
| Comparable adjustments, Net income (loss) attributable to CBI | $ | (71.5) | $ | (171.8) | $ | (8.3) | $ | (228.6) | |||||||||||||||
Undesignated commodity derivative contracts
Net gain (loss) on undesignated commodity derivative contracts represents a net gain (loss) from the changes in fair value of undesignated commodity derivative contracts. The net gain (loss) is reported outside of segment operating results until such time that the underlying exposure is recognized in the segment operating results. At settlement, the net gain (loss) from the changes in fair value of the undesignated commodity derivative contracts is reported in the appropriate operating segment, allowing the results of our operating segments to reflect the economic effects of the commodity derivative contracts without the resulting unrealized mark to fair value volatility.
Net gain (loss) on undesignated commodity derivative contracts represents a net gain (loss) from the changes in fair value of undesignated commodity derivative contracts. The net gain (loss) is reported outside of segment operating results until such time that the underlying exposure is recognized in the segment operating results. At settlement, the net gain (loss) from the changes in fair value of the undesignated commodity derivative contracts is reported in the appropriate operating segment, allowing the results of our operating segments to reflect the economic effects of the commodity derivative contracts without the resulting unrealized mark to fair value volatility.
Strategic business reconfiguration costs
We recognized costs in connection with activities intended to streamline operations, improve efficiencies, and reduce our cost structure. Operating income (loss) also includes the loss on settlement of a receivable related to the sale of a previously-owned facility (three months and six months ended August 31, 2026).
We recognized costs in connection with activities intended to streamline operations, improve efficiencies, and reduce our cost structure. Operating income (loss) also includes the loss on settlement of a receivable related to the sale of a previously-owned facility (three months and six months ended August 31, 2026).
Flow through of inventory step-up
In connection with acquisitions, the allocation of purchase price in excess of book value for certain inventories on hand at the date of acquisition is referred to as inventory step-up. Inventory step-up represents an assumed manufacturing profit attributable to the acquired business prior to acquisition.
In connection with acquisitions, the allocation of purchase price in excess of book value for certain inventories on hand at the date of acquisition is referred to as inventory step-up. Inventory step-up represents an assumed manufacturing profit attributable to the acquired business prior to acquisition.
Asset impairment and related expenses
We recognized (i) impairments on assets held for sale associated with management’s plan to divest the Nelson’s Green Brier business (three months and six months ended August 31, 2026) and on then-existing net assets held for sale in connection with the New Zealand Wine Divestitures (six months ended August 31, 2026) and (ii) contract liabilities and inventory obsolescence expenses associated with the 2025 Wine Divestitures, partially offset by changes in the carrying value of those then-existing net assets held for sale (six months ended August 31, 2025).
We recognized (i) impairments on assets held for sale associated with management’s plan to divest the Nelson’s Green Brier business (three months and six months ended August 31, 2026) and on then-existing net assets held for sale in connection with the New Zealand Wine Divestitures (six months ended August 31, 2026) and (ii) contract liabilities and inventory obsolescence expenses associated with the 2025 Wine Divestitures, partially offset by changes in the carrying value of those then-existing net assets held for sale (six months ended August 31, 2025).
2025 Restructuring Initiative
We recognized costs in connection with an enterprise-wide cost savings and restructuring initiative designed to help optimize the performance of our business.
Constellation Brands, Inc. Q2 FY 2027 Earnings Release | #WORTHREACHINGFOR I 14 | ||||
CONSTELLATION BRANDS, INC. AND SUBSIDIARIES
RECONCILIATIONS OF GAAP TO NON-GAAP FINANCIAL MEASURES (continued)
(in millions, except per share data)
(unaudited)
RECONCILIATIONS OF GAAP TO NON-GAAP FINANCIAL MEASURES (continued)
(in millions, except per share data)
(unaudited)
Transition services agreements activity
We recognized costs in connection with transition services agreements related to the previous sales of portions of our Wine and Spirits Business.
We recognized costs in connection with transition services agreements related to the previous sales of portions of our Wine and Spirits Business.
Gain (loss) on sale of business
We recognized a net gain (loss) largely in connection with the 2025 Wine Divestitures (three months ended August 31, 2025 and six months ended August 31, 2026, and August 31, 2025, respectively).
We recognized a net gain (loss) largely in connection with the 2025 Wine Divestitures (three months ended August 31, 2025 and six months ended August 31, 2026, and August 31, 2025, respectively).
Other gains (losses)
Primarily includes the following:
| Three Months Ended | Six Months Ended | ||||||||||||||||||||||
| August 31, 2026 | August 31, 2025 | August 31, 2026 | August 31, 2025 | ||||||||||||||||||||
| Gain (loss) on sale of assets | $ | — | $ | 4.1 | $ | — | $ | 4.1 | |||||||||||||||
Comparable adjustments, Income (loss) from unconsolidated investments
Includes the following:
| Three Months Ended | Six Months Ended | ||||||||||||||||||||||
| August 31, 2026 | August 31, 2025 | August 31, 2026 | August 31, 2025 | ||||||||||||||||||||
Unrealized gain (loss) from the changes in fair value of our securities measured at fair value | $ | — | $ | (5.0) | $ | — | $ | (5.0) | |||||||||||||||
Other gains (losses) | $ | — | $ | (3.6) | $ | — | $ | (3.6) | |||||||||||||||
| Equity method investments impairment | $ | — | $ | (1.5) | $ | — | $ | (1.5) | |||||||||||||||
Comparable adjustments, Interest expense, net
We (i) recognized losses from the write-off of unamortized discount and debt issuance costs in connection with the redemption and repayment of outstanding senior notes (three months ended August 31, 2025 and six months ended August 31, 2026, and August 31, 2025, respectively) and (ii) wrote-off accrued interest income related to convertible notes issued to certain investments (three months and six months ended August 31, 2025).
Comparable adjustments, (Provision for) benefit from income taxes
The effective tax rate applied to each comparable adjustment amount is generally based upon the jurisdiction in which the comparable adjustment was recognized. Comparable adjustments, (Provision for) benefit from income taxes also include items solely impacting income taxes and consist of the following (expense) and benefit adjustments:
| Three Months Ended | Six Months Ended | ||||||||||||||||||||||
| August 31, 2026 | August 31, 2025 | August 31, 2026 | August 31, 2025 | ||||||||||||||||||||
| Recent divestitures | $ | 1.5 | $ | (7.1) | $ | 1.5 | $ | (13.2) | |||||||||||||||
| Resolution of various tax examinations and assessments related to prior periods | $ | (1.2) | $ | 65.5 | $ | (1.8) | $ | 87.4 | |||||||||||||||
| Adjustments to valuation allowances | $ | — | $ | (192.1) | $ | 63.3 | $ | (192.7) | |||||||||||||||
| Taxable dividend distribution from a foreign subsidiary | $ | — | $ | (18.3) | $ | — | $ | (18.3) | |||||||||||||||
Tax rate change impacts | $ | — | $ | — | $ | 11.5 | $ | — | |||||||||||||||
| Adjustments to tax attributes | $ | — | $ | — | $ | (20.1) | $ | — | |||||||||||||||
Constellation Brands, Inc. Q2 FY 2027 Earnings Release | #WORTHREACHINGFOR I 15 | ||||
CONSTELLATION BRANDS, INC. AND SUBSIDIARIES
RECONCILIATIONS OF GAAP TO NON-GAAP FINANCIAL MEASURES (continued)
(in millions, except per share data)
(unaudited)
RECONCILIATIONS OF GAAP TO NON-GAAP FINANCIAL MEASURES (continued)
(in millions, except per share data)
(unaudited)
Three Months Ended | |||||||||||||||||||||||||||||||||||
| August 31, 2026 | August 31, 2025 | ||||||||||||||||||||||||||||||||||
| Income (loss) before income taxes | (Provision for) benefit from income taxes (1) | Effective tax rate (2) | Income (loss) before income taxes | (Provision for) benefit from income taxes (1) | Effective tax rate (2) | ||||||||||||||||||||||||||||||
| Reported basis (GAAP) | $ | 729.4 | $ | (147.1) | 20.2 | % | $ | 782.9 | $ | (296.8) | 37.9 | % | |||||||||||||||||||||||
| Comparable adjustments | 91.6 | (20.1) | 23.9 | 147.9 | |||||||||||||||||||||||||||||||
| Comparable basis (Non-GAAP) | $ | 821.0 | $ | (167.2) | 20.4 | % | $ | 806.8 | $ | (148.9) | 18.5 | % | |||||||||||||||||||||||
(1)The comparable adjustment effective tax rate applied to each comparable adjustment amount is generally based upon the jurisdiction in which the adjustment was recognized.
(2)Effective tax rate is not considered a GAAP financial measure, for purposes of this reconciliation, we derived the reported GAAP measure based on GAAP results, which serves as the basis for the reconciliation to the comparable non-GAAP financial measure.
Operating Margin Guidance
| Guidance Range for the Year Ending February 28, 2027 | |||||||||||
Net sales (GAAP) | $ | 8,910 | $ | 9,090 | |||||||
| Operating income (GAAP) | $ | 2,745 | $ | 2,895 | |||||||
Comparable adjustments (1) | 90 | 90 | |||||||||
| Comparable operating income (Non-GAAP) | $ | 2,835 | $ | 2,985 | |||||||
Operating margin (GAAP) | 31 | % | 32 | % | |||||||
Comparable operating margin (Non-GAAP) | 32 | % | 33 | % | |||||||
(1) | Comparable adjustments include: | Estimated for the Year Ending February 28, 2027 | ||||||
Asset impairment and related expenses | $ | 68 | ||||||
| Settlements of undesignated commodity derivative contracts | $ | 24 | ||||||
| Strategic business reconfiguration costs | $ | 17 | ||||||
| Transition services agreements activity | $ | 16 | ||||||
| 2025 Restructuring Initiative | $ | 9 | ||||||
| (Gain) loss on sale of business | $ | 4 | ||||||
| Flow through of inventory step-up | $ | 2 | ||||||
| Other (gains) losses | $ | 2 | ||||||
| Net (gain) loss on undesignated commodity derivative contracts | $ | (53) | ||||||
Constellation Brands, Inc. Q2 FY 2027 Earnings Release | #WORTHREACHINGFOR I 16 | ||||
CONSTELLATION BRANDS, INC. AND SUBSIDIARIES
RECONCILIATIONS OF GAAP TO NON-GAAP FINANCIAL MEASURES (continued)
(in millions, except per share data)
(unaudited)
RECONCILIATIONS OF GAAP TO NON-GAAP FINANCIAL MEASURES (continued)
(in millions, except per share data)
(unaudited)
EPS Guidance
| Guidance Range for the Year Ending February 28, 2027 | Actual for the Year Ended February 28, 2026 | ||||||||||||||||
| Forecasted EPS (GAAP) | $ | 11.85 | $ | 12.55 | $ | 9.61 | |||||||||||
Comparable adjustments (1) | (0.65) | (0.65) | 2.21 | ||||||||||||||
Forecasted comparable EPS (Non-GAAP) (2) | $ | 11.20 | $ | 11.90 | $ | 11.82 | |||||||||||
(1) | Comparable adjustments include: (2) | Estimated for the Year Ending February 28, 2027 | Actual for the Year Ended February 28, 2026 | |||||||||||
| Adjustments to valuation allowances | $ | (1.10) | $ | 1.88 | ||||||||||
| Net (gain) loss on undesignated commodity derivative contracts | $ | (0.23) | $ | (0.10) | ||||||||||
| Tax rate change impacts | $ | (0.07) | $ | 0.13 | ||||||||||
| Recent divestitures | $ | (0.01) | $ | 0.25 | ||||||||||
| Asset impairment and related expenses | $ | 0.30 | $ | 0.46 | ||||||||||
| Adjustments to tax attributes | $ | 0.12 | $ | 0.12 | ||||||||||
| Settlements of undesignated commodity derivative contracts | $ | 0.11 | $ | (0.01) | ||||||||||
| Strategic business reconfiguration costs | $ | 0.09 | $ | 0.07 | ||||||||||
| Transition services agreements activity | $ | 0.07 | $ | 0.15 | ||||||||||
| 2025 Restructuring Initiative | $ | 0.04 | $ | 0.30 | ||||||||||
| (Gain) loss on sale of business | $ | 0.02 | $ | 0.14 | ||||||||||
| Resolution of various tax examinations and assessments related to prior periods | $ | 0.01 | $ | (1.36) | ||||||||||
| Flow through of inventory step-up | $ | 0.01 | $ | 0.02 | ||||||||||
| Other (gains) losses | $ | 0.01 | $ | (0.12) | ||||||||||
| Taxable dividend distribution from a foreign subsidiary | $ | — | $ | 0.19 | ||||||||||
| (Income) loss from unconsolidated investments | $ | — | $ | 0.04 | ||||||||||
| CEO severance and transition benefits | $ | — | $ | 0.03 | ||||||||||
(2) | May not sum due to rounding as each item is computed independently. The comparable adjustments and comparable EPS are calculated on a fully dilutive basis. | |||||||||||||
Free Cash Flow Guidance
Free cash flow, as defined in the reconciliation below, is considered a liquidity measure and is considered to provide useful information to investors and other external users about the amount of cash generated, which can then be used, after required debt service and dividend payments, for other general corporate purposes. A limitation of free cash flow is that it does not represent the total increase or decrease in the cash balance for the period.
| Guidance Range for the Year Ending February 28, 2027 | |||||||||||
| Net cash provided by operating activities (GAAP) | $ | 2,400 | $ | 2,500 | |||||||
| Purchase of property, plant, and equipment | (800) | (800) | |||||||||
| Free cash flow (Non-GAAP) | $ | 1,600 | $ | 1,700 | |||||||
| Six Months Ended | |||||||||||
| August 31, 2026 | August 31, 2025 | ||||||||||
| Net cash provided by operating activities (GAAP) | $ | 1,478.6 | $ | 1,489.3 | |||||||
| Purchase of property, plant, and equipment | (354.1) | (410.1) | |||||||||
| Free cash flow (Non-GAAP) | $ | 1,124.5 | $ | 1,079.2 | |||||||
Constellation Brands, Inc. Q2 FY 2027 Earnings Release | #WORTHREACHINGFOR I 17 | ||||
DEFINED TERMS
Unless the context otherwise requires, the terms “Company,” “CBI,” “we,” “our,” or “us” refer to Constellation Brands, Inc. and its subsidiaries.
| TERM | MEANING | ||||
| 2025 Restructuring Initiative | enterprise-wide cost savings and restructuring initiative designed to help optimize the performance of our business | ||||
| 2025 Wine Divestitures | sale and, in certain instances, exclusive license to use the trademarks of a portion of our wine and spirits business, primarily centered around our then-owned mainstream wine brands and associated inventory, wineries, vineyards, offices, and facilities on June 2, 2025 | ||||
| bps | basis points | ||||
| Brewery Projects | modular capacity addition activities at our breweries located in Nava, Coahuila, Mexico and Obregón, Sonora, Mexico and our new brewery being constructed in Heroica Veracruz, Veracruz, Mexico | ||||
CircanaTM | Industry market research publication used by consumer packaged goods companies | ||||
| COGS | cost of product sold | ||||
| comparable adjustments | certain items affecting comparability that have been excluded because management uses this information in monitoring and evaluating the results and underlying business trends of the core operations of the Company and/or in internal goal setting | ||||
| Comparable or Comparable basis | amounts which exclude items that affect comparability | ||||
| Customers | wholesale distributors, retailers (generally outside of the 3-tier U.S. distribution channel where products are sold to a distributor (wholesaler) who then sells to a retailer; the retailer sells the products to a consumer; however, in control states, the state government performs the role of wholesaler and retailer), state alcohol beverage control agencies which sell to consumers, and direct-to-consumer purchasers | ||||
| Depletions | represents U.S. distributor shipments of our respective branded products to retail customers, based on third-party data | ||||
| EPS | diluted net income (loss) per share attributable to CBI | ||||
| external users | financial analysts covering the Company, rating agencies, and other external users | ||||
| FY or fiscal | fiscal year | ||||
| GAAP | general accepted accounting principles in the U.S. | ||||
| Projections | statements made under the heading Outlook and all statements other than statements of historical fact set forth in this release, including those identified under Forward-Looking Statements | ||||
| Reported or Reported basis | derived from amounts as reported under GAAP | ||||
| RTD | ready-to-drink | ||||
| New Zealand Wine Divestitures | sale of eight small-scale domestic-market New Zealand mainstream wine brands and associated inventory, equipment, a winery, and vineyards in June 2026 | ||||
| NM | not meaningful | ||||
| SG&A | selling, general, and administrative expenses | ||||
| V/P/M | volume / price / mix | ||||
Constellation Brands, Inc. Q2 FY 2027 Earnings Release | #WORTHREACHINGFOR I 18 | ||||