10-Q: Quarterly report [Sections 13 or 15(d)]
Published on October 7, 2025
UNITED STATES
SECURITIES AND EXCHANGE COMMISSION
Washington, D.C. 20549
FORM 10-Q
(Mark One)
| QUARTERLY REPORT PURSUANT TO SECTION 13 OR 15(D) OF THE SECURITIES EXCHANGE ACT OF 1934 | |||||
For the quarterly period ended August 31, 2025
or
| TRANSITION REPORT PURSUANT TO SECTION 13 OR 15(D) OF THE SECURITIES EXCHANGE ACT OF 1934 | |||||
For the transition period from_____________to_____________
Commission File Number: 001-08495

(Exact name of registrant as specified in its charter)
| (State or other jurisdiction of incorporation or organization) | (I.R.S. Employer Identification No.) | ||||
(Address of principal executive offices) (Zip code)
(585 ) 678-7100
(Registrant’s telephone number, including area code)
Not Applicable
(Former name, former address and former fiscal year, if changed since last report)
Securities registered pursuant to Section 12(b) of the Act:
| Title of Each Class | Trading Symbol(s) | Name of Each Exchange on Which Registered | ||||||
Indicate by check mark whether the registrant (1) has filed all reports required to be filed by Section 13 or 15(d) of the Securities Exchange Act of 1934 during the preceding 12 months (or for such shorter period that the registrant was required to file such reports), and (2) has been subject to such filing requirements for the past 90 days. ☒ Yes ☐ No
Indicate by check mark whether the registrant has submitted electronically every Interactive Data File required to be submitted pursuant to Rule 405 of Regulation S-T (§232.405 of this chapter) during the preceding 12 months (or for such shorter period that the registrant was required to submit such files). ☒ Yes ☐ No
Indicate by check mark whether the registrant is a large accelerated filer, an accelerated filer, a non-accelerated filer, a smaller reporting company, or an emerging growth company. See the definitions of “large accelerated filer,” “accelerated filer,” “smaller reporting company,” and “emerging growth company” in Rule 12b-2 of the Exchange Act.
| ☒ | Accelerated filer | ☐ | |||||||||
| Non-accelerated filer | ☐ | Smaller reporting company | |||||||||
| Emerging growth company | |||||||||||
If an emerging growth company, indicate by check mark if the registrant has elected not to use the extended transition period for complying with any new or revised financial accounting standards provided pursuant to Section 13(a) of the Exchange Act. ☐
Indicate by check mark whether the registrant is a shell company (as defined in Rule 12b-2 of the Exchange Act).
Yes ☐ No ☒
There were 175,013,336 shares of Class A Common Stock and 27,167 shares of Class 1 Common Stock outstanding as of September 30, 2025.
TABLE OF CONTENTS
| Page | ||||||||
| DEFINED TERMS | ||||||||
| PART I – FINANCIAL INFORMATION | ||||||||
| Item 1. Financial Statements | ||||||||
| Consolidated Balance Sheets | ||||||||
| Consolidated Statements of Comprehensive Income (Loss) | ||||||||
| Consolidated Statements of Changes in Stockholders’ Equity | ||||||||
| Consolidated Statements of Cash Flows | ||||||||
| Notes to Consolidated Financial Statements | ||||||||
1. Basis of Presentation | ||||||||
2. Acquisitions and Divestitures | ||||||||
3. Restructuring | ||||||||
4. Inventories | ||||||||
5. Prepaid Expenses and Other | ||||||||
6. Derivative Instruments | ||||||||
7. Fair Value of Financial Instruments | ||||||||
8. Goodwill | ||||||||
9. Intangible Assets | ||||||||
10. Other Assets | ||||||||
11. Borrowings | ||||||||
12. Income Taxes | ||||||||
13. Stockholders' Equity | ||||||||
14. Net Income (Loss) Per Common Share Attributable to CBI | ||||||||
15. Comprehensive Income (Loss) Attributable to CBI | ||||||||
16. Business Segment Information | ||||||||
17. Accounting Guidance Not Yet Adopted | ||||||||
| Item 2. Management’s Discussion and Analysis of Financial Condition and Results of Operations | ||||||||
| Item 3. Quantitative and Qualitative Disclosures About Market Risk | ||||||||
| Item 4. Controls and Procedures | ||||||||
| PART II – OTHER INFORMATION | ||||||||
| Item 1. Legal Proceedings | ||||||||
| Item 2. Unregistered Sales of Equity Securities and Use of Proceeds | ||||||||
| Item 5. Other Information | ||||||||
| Item 6. Exhibits | ||||||||
| SIGNATURES | ||||||||
This Form 10-Q contains “forward-looking statements” within the meaning of Section 27A of the Securities Act and Section 21E of the Exchange Act. These forward-looking statements are subject to a number of risks and uncertainties, many of which are beyond our control, which could cause actual results to differ materially from those set forth in, or implied by, such forward-looking statements. For further information regarding such forward-looking statements, risks, and uncertainties, please see “Information Regarding Forward-Looking Statements” under MD&A.
Market positions and industry data discussed in this Form 10-Q are for the 52-weeks ending August 31, 2025.
DEFINED TERMS
Unless the context otherwise requires, the terms “Company,” “CBI,” “we,” “our,” or “us” refer to Constellation Brands, Inc. and its subsidiaries. We use terms in this Form 10-Q and in our Notes that are specific to us or are abbreviations that may not be commonly known or used.
| TERM | MEANING | ||||
| $ | U.S. dollars | ||||
| 10b5-1 Trading Plan | a pre-arranged trading plan intended to satisfy the affirmative defense conditions of Rule 10b5-1(c) of the Exchange Act | ||||
2025 Annual Report | our Annual Report on Form 10-K for the fiscal year ended February 28, 2025 | ||||
| 2025 Authorization | authorization to repurchase up to $4.0 billion of our publicly traded common stock, approved by our Board of Directors in April 2025 | ||||
| 2025 Credit Agreement | eleventh amended and restated credit agreement, dated as of April 28, 2025, that provides for a $2.25 billion aggregate revolving credit facility | ||||
| 2025 Restructuring Initiative | an enterprise-wide cost savings and restructuring initiative designed to help optimize the performance of our business, including through enhanced organizational efficiency and optimized expenditures across our organization, with the majority of the work expected to be completed within Fiscal 2026 and net annualized cost savings expected to be fully realized by Fiscal 2028 | ||||
| 2025 Term Credit Agreement | term loan credit agreement, dated as of May 9, 2025, that provides for a $500.0 million unsecured delayed draw term loan facility | ||||
| 2025 Wine Divestitures | sale and, in certain instances, exclusive license to use the trademarks of a portion of our wine and spirits business, primarily centered around our then-owned mainstream wine brands and associated inventory, wineries, vineyards, offices, and facilities on June 2, 2025 | ||||
| 3-tier | distribution channel where products are sold to a distributor (wholesaler) who then sells to a retailer; the retailer sells the products to a consumer | ||||
| 3-tier eCommerce | digital commerce experience for consumers to purchase beverage alcohol from retailers | ||||
| 4.75% December 2015 Senior Notes | $400.0 million principal amount of 4.75% senior notes issued in December 2015, now repaid in full | ||||
| 4.80% May 2025 Senior Notes | $500.0 million aggregate principal amount of senior notes issued in May 2025 | ||||
| 5.00% February 2023 Senior Notes | $500.0 million principal amount of 5.00% senior notes issued in February 2023, now repaid in full | ||||
| ABA | alternative beverage alcohol | ||||
| Administrative Agent | Bank of America, N.A., as administrative agent for the senior credit facility and the 2025 Term Credit Agreement | ||||
| AOCI | accumulated other comprehensive income (loss) | ||||
| Canopy | Canopy Growth Corporation, an Ontario, Canada-based public company in which we have an investment | ||||
CB International | CB International Finance S.à r.l., a wholly-owned subsidiary of ours | ||||
| Class 1 Stock | our Class 1 Convertible Common Stock, par value $0.01 per share | ||||
| Class A Stock | our Class A Common Stock, par value $0.01 per share | ||||
Constellation Brands, Inc. Q2 FY 2026 Form 10-Q | #WORTHREACHINGFOR I i | ||||
| TERM | MEANING | ||||
| CODM | chief operating decision maker, our President and Chief Executive Officer | ||||
| Comparable Adjustments | certain items affecting comparability that have been excluded because management uses this information in monitoring and evaluating the results and underlying business trends of the core operations of the Company and/or in internal goal setting | ||||
| CPG | consumer packaged goods | ||||
| CSR | corporate social responsibility | ||||
| Depletions | represent U.S. distributor shipments of our respective branded products to retail customers, based on third-party data | ||||
| DTC | direct-to-consumer inclusive of (i) a digital commerce experience for consumers to purchase directly from brand websites with inventory coming straight from the supplier and (ii) consumer purchases at hospitality locations (tasting rooms and tap rooms) from the supplier | ||||
| Exchangeable Shares | class of non-voting and non-participating exchangeable shares in Canopy which are convertible into common shares of Canopy on a one-for-one basis | ||||
| Exchange Act | Securities Exchange Act of 1934, as amended | ||||
| FASB | Financial Accounting Standards Board | ||||
| Financial Statements | our consolidated financial statements and notes thereto included herein | ||||
| Fiscal 2025 | the Company’s fiscal year ended February 28, 2025 | ||||
| Fiscal 2026 | the Company’s fiscal year ending February 28, 2026 | ||||
| Fiscal 2027 | the Company’s fiscal year ending February 28, 2027 | ||||
| Fiscal 2028 | the Company’s fiscal year ending February 29, 2028 | ||||
| Fiscal 2029 | the Company’s fiscal year ending February 28, 2029 | ||||
| Fiscal 2030 | the Company’s fiscal year ending February 28, 2030 | ||||
| Fiscal 2031 | the Company’s fiscal year ending February 28, 2031 | ||||
| Form 10-Q | this Quarterly Report on Form 10-Q for the quarterly period ended August 31, 2025, unless otherwise specified | ||||
| IRA | Inflation Reduction Act of 2022 | ||||
| IT | information technology | ||||
| Mainstream | wine that sells less than $11.00 per bottle at retail and sparkling wine and all other wine that sells less than $13.00 per bottle at retail | ||||
| MD&A | Management’s Discussion and Analysis of Financial Condition and Results of Operations under Part I – Item 2. of this Form 10-Q | ||||
Mexicali Brewery | canceled brewery construction project located in Mexicali, Baja California, Mexico, sold the remaining assets classified as held for sale in July 2024 | ||||
| Mexico Beer Projects | expansion, optimization, and/or construction activities at the Obregón Brewery, Nava Brewery, and Veracruz Brewery | ||||
| M&T | Manufacturers and Traders Trust Company | ||||
| Nava | Nava, Coahuila, Mexico | ||||
Constellation Brands, Inc. Q2 FY 2026 Form 10-Q | #WORTHREACHINGFOR I ii | ||||
| TERM | MEANING | ||||
| Nava Brewery | our brewery located in Nava | ||||
| Net sales | gross sales less promotions, returns and allowances, and excise taxes | ||||
| NM | not meaningful | ||||
| Non-GAAP | financial measures not calculated in accordance with U.S. GAAP, for example, comparable operating income (loss) | ||||
| Note(s) | notes to the consolidated financial statements | ||||
OB3 Act | One Big Beautiful Bill Act, signed into U.S. law on July 4, 2025 | ||||
| Obregón | Obregón, Sonora, Mexico | ||||
Obregón Brewery | our brewery located in Obregón | ||||
| OECD | Organization for Economic Cooperation and Development | ||||
| OCI | other comprehensive income (loss) | ||||
| Pre-issuance hedge contracts | treasury lock and/or swap lock contracts designated as cash flow hedges entered into to hedge treasury rate volatility on future debt issuances | ||||
| Premium | wine that sells between $11.00 to $24.99 per bottle at retail and sparkling wine that sells between $13.00 to $34.99 per bottle at retail | ||||
| SEC | Securities and Exchange Commission | ||||
Second Quarter 2025 | the Company’s three months ended August 31, 2024 | ||||
Second Quarter 2026 | the Company’s three months ended August 31, 2025 | ||||
| Securities Act | Securities Act of 1933, as amended | ||||
Six Months 2025 | the Company’s six months ended August 31, 2024 | ||||
Six Months 2026 | the Company’s six months ended August 31, 2025 | ||||
| SOFR | secured overnight financing rate administered by the Federal Reserve Bank of New York | ||||
| SVEDKA Divestiture | sale of the SVEDKA brand and related assets, primarily including inventory and equipment on January 6, 2025 | ||||
| U.S. | United States of America | ||||
| U.S. GAAP | generally accepted accounting principles in the U.S. | ||||
| Veracruz | Heroica Veracruz, Veracruz, Mexico | ||||
| Veracruz Brewery | our new brewery being constructed in Veracruz | ||||
Wine and Spirits Divestitures | the 2025 Wine Divestitures and the SVEDKA Divestiture, collectively | ||||
Constellation Brands, Inc. Q2 FY 2026 Form 10-Q | #WORTHREACHINGFOR I iii | ||||
| FINANCIAL STATEMENTS | |||||
PART I – FINANCIAL INFORMATION
ITEM 1. FINANCIAL STATEMENTS.
CONSTELLATION BRANDS, INC. AND SUBSIDIARIES
CONSOLIDATED BALANCE SHEETS
(in millions, except share and per share data)
(unaudited)
CONSOLIDATED BALANCE SHEETS
(in millions, except share and per share data)
(unaudited)
| August 31, 2025 | February 28, 2025 | ||||||||||
ASSETS | |||||||||||
| Current assets: | |||||||||||
| Cash and cash equivalents | $ | $ | |||||||||
| Accounts receivable | |||||||||||
| Inventories | |||||||||||
| Prepaid expenses and other | |||||||||||
| Assets held for sale | |||||||||||
| Total current assets | |||||||||||
Property, plant, and equipment, net of accumulated depreciation of $ | |||||||||||
| Goodwill | |||||||||||
| Intangible assets | |||||||||||
| Deferred income taxes | |||||||||||
| Other assets | |||||||||||
| Total assets | $ | $ | |||||||||
| LIABILITIES AND STOCKHOLDERS’ EQUITY | |||||||||||
| Current liabilities: | |||||||||||
| Short-term borrowings | $ | $ | |||||||||
| Current maturities of long-term debt | |||||||||||
| Accounts payable | |||||||||||
| Other accrued expenses and liabilities | |||||||||||
| Total current liabilities | |||||||||||
| Long-term debt, less current maturities | |||||||||||
| Deferred income taxes and other liabilities | |||||||||||
| Total liabilities | |||||||||||
| Commitments and contingencies | |||||||||||
| CBI stockholders’ equity: | |||||||||||
Class A Stock, $ Issued, | |||||||||||
| Additional paid-in capital | |||||||||||
| Retained earnings | |||||||||||
| Accumulated other comprehensive income (loss) | ( | ( | |||||||||
Class A Stock in treasury, at cost, | ( | ( | |||||||||
| Total CBI stockholders’ equity | |||||||||||
| Noncontrolling interests | |||||||||||
| Total stockholders’ equity | |||||||||||
| Total liabilities and stockholders’ equity | $ | $ | |||||||||
The accompanying notes are an integral part of these statements.
| Constellation Brands, Inc. Q2 FY 2026 Form 10-Q | #WORTHREACHINGFOR I 1 | ||||
| FINANCIAL STATEMENTS | |||||
CONSTELLATION BRANDS, INC. AND SUBSIDIARIES
CONSOLIDATED STATEMENTS OF COMPREHENSIVE INCOME (LOSS)
(in millions, except per share data)
(unaudited)
| For the Six Months Ended August 31, | For the Three Months Ended August 31, | ||||||||||||||||||||||
| 2025 | 2024 | 2025 | 2024 | ||||||||||||||||||||
NET INCOME (LOSS) ATTRIBUTABLE TO CBI | |||||||||||||||||||||||
| Sales | $ | $ | $ | $ | |||||||||||||||||||
| Excise taxes | ( | ( | ( | ( | |||||||||||||||||||
| Net sales | |||||||||||||||||||||||
| Cost of product sold | ( | ( | ( | ( | |||||||||||||||||||
| Gross profit | |||||||||||||||||||||||
| Selling, general, and administrative expenses | ( | ( | ( | ( | |||||||||||||||||||
Goodwill impairment | ( | ( | |||||||||||||||||||||
Asset impairment and related expenses | ( | ||||||||||||||||||||||
| Operating income (loss) | ( | ( | |||||||||||||||||||||
| Income (loss) from unconsolidated investments | ( | ( | ( | ||||||||||||||||||||
| Interest expense, net | ( | ( | ( | ( | |||||||||||||||||||
| Income (loss) before income taxes | ( | ( | |||||||||||||||||||||
| (Provision for) benefit from income taxes | ( | ( | |||||||||||||||||||||
| Net income (loss) | ( | ( | |||||||||||||||||||||
| Net (income) loss attributable to noncontrolling interests | ( | ( | ( | ( | |||||||||||||||||||
| Net income (loss) attributable to CBI | $ | $ | ( | $ | $ | ( | |||||||||||||||||
COMPREHENSIVE INCOME (LOSS) ATTRIBUTABLE TO CBI | |||||||||||||||||||||||
| Comprehensive income (loss) | $ | $ | ( | $ | $ | ( | |||||||||||||||||
| Comprehensive (income) loss attributable to noncontrolling interests | ( | ( | |||||||||||||||||||||
| Comprehensive income (loss) attributable to CBI | $ | $ | ( | $ | $ | ( | |||||||||||||||||
CLASS A STOCK | |||||||||||||||||||||||
| Net income (loss) per common share attributable to CBI – basic | $ | $ | ( | $ | $ | ( | |||||||||||||||||
| Net income (loss) per common share attributable to CBI – diluted | $ | $ | ( | $ | $ | ( | |||||||||||||||||
| Weighted average common shares outstanding – basic | |||||||||||||||||||||||
| Weighted average common shares outstanding – diluted | |||||||||||||||||||||||
| Cash dividends declared per common share | $ | $ | $ | $ | |||||||||||||||||||
The accompanying notes are an integral part of these statements.
| Constellation Brands, Inc. Q2 FY 2026 Form 10-Q | #WORTHREACHINGFOR I 2 | ||||
| FINANCIAL STATEMENTS | |||||
CONSTELLATION BRANDS, INC. AND SUBSIDIARIES CONSOLIDATED STATEMENTS OF CHANGES IN STOCKHOLDERS’ EQUITY (in millions) (unaudited) | ||||||||||||||||||||||||||||||||||||||||||||
| Class A Stock | Additional Paid-in Capital | Retained Earnings | Accumulated Other Comprehensive Income (Loss) | Treasury Stock | Non-controlling Interests | Total | ||||||||||||||||||||||||||||||||||||||
| Balance at February 28, 2025 | $ | $ | $ | $ | ( | $ | ( | $ | $ | |||||||||||||||||||||||||||||||||||
Comprehensive income (loss): | ||||||||||||||||||||||||||||||||||||||||||||
| Net income (loss) | — | — | — | — | ||||||||||||||||||||||||||||||||||||||||
| Other comprehensive income (loss), net of income tax effect | — | — | — | — | ||||||||||||||||||||||||||||||||||||||||
| Comprehensive income (loss) | ||||||||||||||||||||||||||||||||||||||||||||
| Repurchase of shares | — | — | — | — | ( | — | ( | |||||||||||||||||||||||||||||||||||||
| Dividends declared | — | — | ( | — | — | — | ( | |||||||||||||||||||||||||||||||||||||
| Noncontrolling interest distributions | — | — | — | — | — | ( | ( | |||||||||||||||||||||||||||||||||||||
| Shares issued under equity compensation plans | — | ( | — | — | — | ( | ||||||||||||||||||||||||||||||||||||||
| Stock-based compensation | — | — | — | — | — | |||||||||||||||||||||||||||||||||||||||
Balance at May 31, 2025 | ( | ( | ||||||||||||||||||||||||||||||||||||||||||
| Comprehensive income (loss): | ||||||||||||||||||||||||||||||||||||||||||||
| Net income (loss) | — | — | — | — | ||||||||||||||||||||||||||||||||||||||||
| Other comprehensive income (loss), net of income tax effect | — | — | — | — | ||||||||||||||||||||||||||||||||||||||||
| Comprehensive income (loss) | ||||||||||||||||||||||||||||||||||||||||||||
| Repurchase of shares | — | — | — | — | ( | — | ( | |||||||||||||||||||||||||||||||||||||
| Dividends declared | — | — | ( | — | — | — | ( | |||||||||||||||||||||||||||||||||||||
| Noncontrolling interest distributions | — | — | — | — | — | ( | ( | |||||||||||||||||||||||||||||||||||||
| Shares issued under equity compensation plans | — | ( | — | — | — | |||||||||||||||||||||||||||||||||||||||
| Stock-based compensation | — | — | — | — | — | |||||||||||||||||||||||||||||||||||||||
| Balance at August 31, 2025 | $ | $ | $ | $ | ( | $ | ( | $ | $ | |||||||||||||||||||||||||||||||||||
| Constellation Brands, Inc. Q2 FY 2026 Form 10-Q | #WORTHREACHINGFOR I 3 | ||||
| FINANCIAL STATEMENTS | |||||
CONSTELLATION BRANDS, INC. AND SUBSIDIARIES CONSOLIDATED STATEMENTS OF CHANGES IN STOCKHOLDERS’ EQUITY (in millions) (unaudited) | ||||||||||||||||||||||||||||||||||||||||||||
| Class A Stock | Additional Paid-in Capital | Retained Earnings | Accumulated Other Comprehensive Income (Loss) | Treasury Stock | Non-controlling Interests | Total | ||||||||||||||||||||||||||||||||||||||
| Balance at February 29, 2024 | $ | $ | $ | $ | $ | ( | $ | $ | ||||||||||||||||||||||||||||||||||||
| Comprehensive income (loss): | ||||||||||||||||||||||||||||||||||||||||||||
| Net income (loss) | — | — | — | — | ||||||||||||||||||||||||||||||||||||||||
| Other comprehensive income (loss), net of income tax effect | — | — | — | ( | — | ( | ||||||||||||||||||||||||||||||||||||||
| Comprehensive income (loss) | ||||||||||||||||||||||||||||||||||||||||||||
| Repurchase of shares | — | — | — | — | ( | — | ( | |||||||||||||||||||||||||||||||||||||
| Dividends declared | — | — | ( | — | — | — | ( | |||||||||||||||||||||||||||||||||||||
| Noncontrolling interest distributions | — | — | — | — | — | ( | ( | |||||||||||||||||||||||||||||||||||||
| Shares issued under equity compensation plans | — | — | — | — | ||||||||||||||||||||||||||||||||||||||||
| Stock-based compensation | — | — | — | — | — | |||||||||||||||||||||||||||||||||||||||
Balance at May 31, 2024 | ( | |||||||||||||||||||||||||||||||||||||||||||
| Comprehensive income (loss): | ||||||||||||||||||||||||||||||||||||||||||||
| Net income (loss) | — | — | ( | — | — | ( | ||||||||||||||||||||||||||||||||||||||
| Other comprehensive income (loss), net of income tax effect | — | — | — | ( | — | ( | ( | |||||||||||||||||||||||||||||||||||||
| Comprehensive income (loss) | ( | |||||||||||||||||||||||||||||||||||||||||||
| Repurchase of shares | — | — | — | — | ( | — | ( | |||||||||||||||||||||||||||||||||||||
| Dividends declared | — | — | ( | — | — | — | ( | |||||||||||||||||||||||||||||||||||||
| Noncontrolling interest distributions | — | — | — | — | — | ( | ( | |||||||||||||||||||||||||||||||||||||
| Shares issued under equity compensation plans | — | — | — | — | ||||||||||||||||||||||||||||||||||||||||
| Stock-based compensation | — | — | — | — | — | |||||||||||||||||||||||||||||||||||||||
| Balance at August 31, 2024 | $ | $ | $ | $ | ( | $ | ( | $ | $ | |||||||||||||||||||||||||||||||||||
The accompanying notes are an integral part of these statements.
| Constellation Brands, Inc. Q2 FY 2026 Form 10-Q | #WORTHREACHINGFOR I 4 | ||||
| FINANCIAL STATEMENTS | |||||
CONSTELLATION BRANDS, INC. AND SUBSIDIARIES
CONSOLIDATED STATEMENTS OF CASH FLOWS
(in millions)
(unaudited)
| For the Six Months Ended August 31, | |||||||||||
| 2025 | 2024 | ||||||||||
CASH FLOWS FROM OPERATING ACTIVITIES | |||||||||||
| Net income (loss) | $ | $ | ( | ||||||||
| Adjustments to reconcile net income (loss) to net cash provided by (used in) operating activities: | |||||||||||
| Deferred tax provision (benefit) | ( | ||||||||||
| Depreciation | |||||||||||
| Stock-based compensation | |||||||||||
| Noncash lease expense | |||||||||||
Asset impairment and related expenses | |||||||||||
| Net gain in connection with Exchangeable Shares | ( | ||||||||||
Goodwill impairment | |||||||||||
| Change in operating assets and liabilities, net of effects from purchase and sale of business: | |||||||||||
| Accounts receivable | ( | ||||||||||
| Inventories | ( | ||||||||||
| Prepaid expenses and other current assets | ( | ( | |||||||||
| Accounts payable | |||||||||||
| Contract liabilities | ( | ||||||||||
| Other accrued expenses and liabilities | ( | ( | |||||||||
| Other | ( | ( | |||||||||
| Total adjustments | |||||||||||
| Net cash provided by (used in) operating activities | |||||||||||
CASH FLOWS FROM INVESTING ACTIVITIES | |||||||||||
| Purchase of property, plant, and equipment | ( | ( | |||||||||
| Purchase of business, net of cash acquired | ( | ||||||||||
| Investments in equity method investees and securities | ( | ( | |||||||||
| Proceeds from sale of assets | |||||||||||
| Proceeds from sale of business | |||||||||||
| Other investing activities | ( | ||||||||||
| Net cash provided by (used in) investing activities | ( | ||||||||||
| Constellation Brands, Inc. Q2 FY 2026 Form 10-Q | #WORTHREACHINGFOR I 5 | ||||
| FINANCIAL STATEMENTS | |||||
CONSTELLATION BRANDS, INC. AND SUBSIDIARIES
CONSOLIDATED STATEMENTS OF CASH FLOWS
(in millions)
(unaudited)
| For the Six Months Ended August 31, | |||||||||||
| 2025 | 2024 | ||||||||||
CASH FLOWS FROM FINANCING ACTIVITIES | |||||||||||
| Proceeds from issuance of long-term debt | |||||||||||
| Principal payments of long-term debt | ( | ( | |||||||||
| Net proceeds from (repayments of) short-term borrowings | ( | ||||||||||
| Dividends paid | ( | ( | |||||||||
| Purchases of treasury stock | ( | ( | |||||||||
| Proceeds from shares issued under equity compensation plans | |||||||||||
| Payments of minimum tax withholdings on stock-based payment awards | ( | ( | |||||||||
| Payments of debt issuance, debt extinguishment, and other financing costs | ( | ||||||||||
| Distributions to noncontrolling interests | ( | ( | |||||||||
| Payment of contingent consideration | ( | ( | |||||||||
| Net cash provided by (used in) financing activities | ( | ( | |||||||||
| Effect of exchange rate changes on cash and cash equivalents | |||||||||||
| Net increase (decrease) in cash and cash equivalents | ( | ||||||||||
| Cash and cash equivalents, beginning of period | |||||||||||
| Cash and cash equivalents, end of period | $ | $ | |||||||||
SUPPLEMENTAL DISCLOSURES OF NONCASH INVESTING AND FINANCING ACTIVITIES | |||||||||||
| Additions to property, plant, and equipment | $ | $ | |||||||||
The accompanying notes are an integral part of these statements.
| Constellation Brands, Inc. Q2 FY 2026 Form 10-Q | #WORTHREACHINGFOR I 6 | ||||
| FINANCIAL STATEMENTS | NOTES TO CONSOLIDATED FINANCIAL STATEMENTS | |||||||
CONSTELLATION BRANDS, INC. AND SUBSIDIARIES
AUGUST 31, 2025
(unaudited)
1. BASIS OF PRESENTATION
We have prepared the Financial Statements, without audit, pursuant to the rules and regulations of the SEC applicable to quarterly reporting on Form 10-Q and reflect, in our opinion, all adjustments necessary to present fairly our financial information. All such adjustments are of a normal recurring nature. Certain information and footnote disclosures normally included in financial statements, prepared in accordance with generally accepted accounting principles, have been condensed or omitted as permitted by such rules and regulations. These Financial Statements should be read in conjunction with the consolidated financial statements and related notes included in the 2025 Annual Report. Results of operations for interim periods are not necessarily indicative of annual results.
2. ACQUISITIONS AND DIVESTITURES
ACQUISITION
Sea Smoke
In June 2024, we acquired the Sea Smoke business, including a California-based luxury wine brand, vineyards, and a production facility for $158.7 million, net of closing and post-closing adjustments. This transaction also included the acquisition of goodwill, inventory, and a trademark. The results of operations of Sea Smoke are reported in the Wine and Spirits segment and have been included in our consolidated results of operations from the date of acquisition.
DIVESTITURES
2025 Wine Divestitures
On June 2, 2025, we sold and, in certain instances, exclusively licensed the trademarks of a portion of our wine and spirits business, primarily centered around our then-owned mainstream wine brands and associated inventory, wineries, vineyards, offices, and facilities. The net cash proceeds from the 2025 Wine Divestitures were used for repayment of debt (see Note 11). Prior to the completion of the 2025 Wine Divestitures, we recorded the results of operations of the divested and exclusively licensed brands in the Wine and Spirits segment. The following table summarizes the net loss recognized in connection with this transaction:
| (in millions) | |||||||||||
| Cash received from buyer | $ | ||||||||||
| Net assets sold | ( | ||||||||||
| Direct costs to sell | ( | ||||||||||
Loss on sale of business (1) | $ | ( | |||||||||
(1)Included in selling, general, and administrative expenses within our consolidated results of operations.
SVEDKA Divestiture
On January 6, 2025, we sold the SVEDKA brand and related assets, primarily including inventory and equipment. The net cash proceeds from the SVEDKA Divestiture were used for general corporate purposes, including funding share repurchases, capital expenditures, and repayment of debt. Prior to the SVEDKA Divestiture, we recorded the results of operations of the SVEDKA brand in the Wine and Spirits segment.
Mexicali Brewery sale
In July 2024, we sold the remaining assets classified as held for sale at the canceled Mexicali Brewery.
| Constellation Brands, Inc. Q2 FY 2026 Form 10-Q | #WORTHREACHINGFOR I 7 | ||||
| FINANCIAL STATEMENTS | NOTES TO CONSOLIDATED FINANCIAL STATEMENTS | |||||||
Assets held for sale
Certain wine and spirits net assets met the held for sale criteria largely in connection with the 2025 Wine Divestitures. The carrying values of these assets held for sale consisted of the following:
| February 28, 2025 | |||||
(in millions) | |||||
| ASSETS | |||||
| Inventories | $ | ||||
| Prepaid expenses and other | |||||
| Property, plant, and equipment | |||||
| Intangible assets | |||||
Less: Asset impairment | ( | ||||
| Assets held for sale | |||||
| LIABILITIES | |||||
Other accrued expenses and liabilities (1) | |||||
| Net assets held for sale | $ | ||||
(1)Liabilities held for sale are included in the consolidated balance sheets within other accrued expenses and liabilities.
3. RESTRUCTURING
The 2025 Restructuring Initiative is an enterprise-wide cost savings and restructuring initiative designed to help optimize the performance of our business, including through enhanced organizational efficiency and optimized expenditures across our organization. The majority of the work associated with the 2025 Restructuring Initiative is expected to be completed within the year ending February 28, 2026, and is estimated to result in $80 million to $100 million of cumulative pre-tax costs once all phases are fully implemented. This range is estimated to be comprised of (i) employee termination costs (60 %) and (ii) consulting services as well as other costs, which primarily include contract termination costs (40 %).
We recognized pre-tax restructuring costs in connection with the 2025 Restructuring Initiative as follows:
| Results of Operations Location | For the Six Months Ended August 31, 2025 | For the Three Months Ended August 31, 2025 | |||||||||||||||
(in millions) | |||||||||||||||||
| Consulting services | Selling, general, and administrative expenses | $ | $ | ||||||||||||||
| Other costs | Selling, general, and administrative expenses | ||||||||||||||||
| $ | $ | ||||||||||||||||
Since the inception of the 2025 Restructuring Initiative, we have incurred the following pre-tax restructuring costs:
Cumulative Costs as of August 31, 2025 | Percent of Total Costs | ||||||||||
(in millions) | |||||||||||
Employee termination | $ | % | |||||||||
| Consulting services | % | ||||||||||
| Other costs | % | ||||||||||
| $ | % | ||||||||||
| Constellation Brands, Inc. Q2 FY 2026 Form 10-Q | #WORTHREACHINGFOR I 8 | ||||
| FINANCIAL STATEMENTS | NOTES TO CONSOLIDATED FINANCIAL STATEMENTS | |||||||
The activity for the restructuring costs discussed above and the related accruals are as follows:
| Employee Termination | Consulting Services | Other | Total | ||||||||||||||||||||
| (in millions) | |||||||||||||||||||||||
| Balance at February 28, 2025 | $ | $ | $ | $ | |||||||||||||||||||
Restructuring costs | |||||||||||||||||||||||
| Cash payments | ( | ( | ( | ||||||||||||||||||||
Balance at August 31, 2025 (1) | $ | $ | $ | $ | |||||||||||||||||||
(1)The total accrual was recorded in accrued restructuring within other accrued expenses and liabilities in our consolidated balance sheets.
4. INVENTORIES
Inventories are stated at the lower of cost (primarily computed in accordance with the first-in, first-out method) or net realizable value. Elements of cost include materials, labor, and overhead and consist of the following:
| August 31, 2025 | February 28, 2025 | ||||||||||
| (in millions) | |||||||||||
| Raw materials and supplies | $ | $ | |||||||||
| In-process inventories | |||||||||||
| Finished case goods | |||||||||||
| $ | $ | ||||||||||
5. PREPAID EXPENSES AND OTHER
The major components of prepaid expenses and other are as follows:
| August 31, 2025 | February 28, 2025 | ||||||||||
| (in millions) | |||||||||||
| Value added taxes receivable | $ | $ | |||||||||
| Prepaid excise and sales taxes | |||||||||||
| Derivative assets | |||||||||||
Prepaid advertising | |||||||||||
Prepaid insurance | |||||||||||
| Other | |||||||||||
| $ | $ | ||||||||||
6. DERIVATIVE INSTRUMENTS
Overview
Our risk management and derivative accounting policies are presented in Notes 1 and 6 of our consolidated financial statements included in our 2025 Annual Report and have not changed significantly for the six months and three months ended August 31, 2025.
| Constellation Brands, Inc. Q2 FY 2026 Form 10-Q | #WORTHREACHINGFOR I 9 | ||||
| FINANCIAL STATEMENTS | NOTES TO CONSOLIDATED FINANCIAL STATEMENTS | |||||||
The aggregate notional value of outstanding derivative instruments is as follows:
| August 31, 2025 | February 28, 2025 | ||||||||||
| (in millions) | |||||||||||
| Derivative instruments designated as hedging instruments | |||||||||||
| Foreign currency contracts | $ | $ | |||||||||
| Pre-issuance hedge contracts | $ | $ | |||||||||
| Net investment hedge contracts | $ | $ | |||||||||
| Derivative instruments not designated as hedging instruments | |||||||||||
| Foreign currency contracts | $ | $ | |||||||||
| Commodity derivative contracts | $ | $ | |||||||||
Net investment hedge contracts
In April 2025, we entered into cross-currency swaps to hedge portions of our net investment in certain of our non-U.S. operations against fluctuations in foreign currency exchange rates. These cross-currency swaps are designated as net investment hedges and mature between April 2028 and April 2029. The changes in the fair value of these swaps are recognized as a component of other comprehensive income (loss) and reported in accumulated other comprehensive income (loss) in our consolidated balance sheets. The gain or loss will be subsequently reclassified into net earnings when the hedged net investment is either sold, liquidated, or substantially liquidated. We assess the effectiveness of our cross-currency swaps using the spot method. Under this method, the periodic interest settlements are recorded directly in earnings through interest expense, net. Accordingly, we recorded interest income of $0.8 million and $0.5 million during the six months and three months ended August 31, 2025, respectively.
Credit risk
We are exposed to credit-related losses if the counterparties to our derivative contracts default. This credit risk is limited to the fair value of the derivative contracts. To manage this risk, we contract only with major financial institutions that have earned investment-grade credit ratings and with whom we have standard International Swaps and Derivatives Association agreements which allow for net settlement of the derivative contracts. We have also established counterparty credit guidelines that are regularly monitored. Because of these safeguards, we believe the risk of loss from counterparty default to be immaterial.
In addition, our derivative instruments are not subject to credit rating contingencies or collateral requirements. As of August 31, 2025, the estimated fair value of derivative instruments in a net liability position due to counterparties was $0.6 million. If we were required to settle the net liability position under these derivative instruments on August 31, 2025, we would have had sufficient available liquidity on hand to satisfy this obligation.
Results of period derivative activity
The estimated fair value and location of our derivative instruments on our balance sheets are as follows (see Note 7):
| Assets | Liabilities | |||||||||||||||||||||||||
| August 31, 2025 | February 28, 2025 | August 31, 2025 | February 28, 2025 | |||||||||||||||||||||||
| (in millions) | ||||||||||||||||||||||||||
| Derivative instruments designated as hedging instruments | ||||||||||||||||||||||||||
| Foreign currency contracts: | ||||||||||||||||||||||||||
| Prepaid expenses and other | $ | $ | Other accrued expenses and liabilities | $ | $ | |||||||||||||||||||||
| Other assets | $ | $ | Deferred income taxes and other liabilities | $ | $ | |||||||||||||||||||||
| Constellation Brands, Inc. Q2 FY 2026 Form 10-Q | #WORTHREACHINGFOR I 10 | ||||
| FINANCIAL STATEMENTS | NOTES TO CONSOLIDATED FINANCIAL STATEMENTS | |||||||
| Assets | Liabilities | |||||||||||||||||||||||||
| August 31, 2025 | February 28, 2025 | August 31, 2025 | February 28, 2025 | |||||||||||||||||||||||
| (in millions) | ||||||||||||||||||||||||||
| Pre-issuance hedge contracts: | ||||||||||||||||||||||||||
| Prepaid expenses and other | $ | $ | Other accrued expenses and liabilities | $ | $ | |||||||||||||||||||||
| Net investment hedge contracts: | ||||||||||||||||||||||||||
| Other assets | $ | $ | Deferred income taxes and other liabilities | $ | $ | |||||||||||||||||||||
| Derivative instruments not designated as hedging instruments | ||||||||||||||||||||||||||
| Foreign currency contracts: | ||||||||||||||||||||||||||
| Prepaid expenses and other | $ | $ | Other accrued expenses and liabilities | $ | $ | |||||||||||||||||||||
| Commodity derivative contracts: | ||||||||||||||||||||||||||
| Prepaid expenses and other | $ | $ | Other accrued expenses and liabilities | $ | $ | |||||||||||||||||||||
| Other assets | $ | $ | Deferred income taxes and other liabilities | $ | $ | |||||||||||||||||||||
The principal effect of our derivative instruments designated in cash flow hedging relationships on our results of operations, as well as OCI, net of income tax effect, is as follows:
| Derivative Instruments in Designated Cash Flow Hedging Relationships | Net Gain (Loss) Recognized in OCI | Location of Net Gain (Loss) Reclassified from AOCI to Income (Loss) | Net Gain (Loss) Reclassified from AOCI to Income (Loss) | |||||||||||||||||
| (in millions) | ||||||||||||||||||||
| For the Six Months Ended August 31, 2025 | ||||||||||||||||||||
| Foreign currency contracts | $ | Sales | $ | |||||||||||||||||
| Cost of product sold | ||||||||||||||||||||
| Selling, general, and administrative expenses | ||||||||||||||||||||
| Pre-issuance hedge contracts | ( | Interest expense, net | ( | |||||||||||||||||
| $ | $ | |||||||||||||||||||
| For the Six Months Ended August 31, 2024 | ||||||||||||||||||||
| Foreign currency contracts | $ | ( | Sales | $ | ||||||||||||||||
| Cost of product sold | ||||||||||||||||||||
| $ | ( | $ | ||||||||||||||||||
| For the Three Months Ended August 31, 2025 | ||||||||||||||||||||
| Foreign currency contracts | $ | Sales | $ | |||||||||||||||||
| Cost of product sold | ||||||||||||||||||||
| Pre-issuance hedge contracts | Interest expense, net | ( | ||||||||||||||||||
| $ | $ | |||||||||||||||||||
| Constellation Brands, Inc. Q2 FY 2026 Form 10-Q | #WORTHREACHINGFOR I 11 | ||||
| FINANCIAL STATEMENTS | NOTES TO CONSOLIDATED FINANCIAL STATEMENTS | |||||||
| Derivative Instruments in Designated Cash Flow Hedging Relationships | Net Gain (Loss) Recognized in OCI | Location of Net Gain (Loss) Reclassified from AOCI to Income (Loss) | Net Gain (Loss) Reclassified from AOCI to Income (Loss) | |||||||||||||||||
| (in millions) | ||||||||||||||||||||
| For the Three Months Ended August 31, 2024 | ||||||||||||||||||||
| Foreign currency contracts | $ | ( | Sales | $ | ||||||||||||||||
| Cost of product sold | ||||||||||||||||||||
| $ | ( | $ | ||||||||||||||||||
We expect $66.4 million of net gains, net of income tax effect, to be reclassified from AOCI to our results of operations within the next 12 months.
The effect of our undesignated derivative instruments on our results of operations is as follows:
| Derivative Instruments Not Designated as Hedging Instruments | Location of Net Gain (Loss) Recognized in Income (Loss) | Net Gain (Loss) Recognized in Income (Loss) | ||||||||||||
| (in millions) | ||||||||||||||
| For the Six Months Ended August 31, 2025 | ||||||||||||||
| Commodity derivative contracts | Cost of product sold | $ | ( | |||||||||||
| Foreign currency contracts | Selling, general, and administrative expenses | |||||||||||||
| Interest rate swap contracts | Interest expense, net | ( | ||||||||||||
| $ | ||||||||||||||
| For the Six Months Ended August 31, 2024 | ||||||||||||||
| Commodity derivative contracts | Cost of product sold | $ | ( | |||||||||||
| Foreign currency contracts | Selling, general, and administrative expenses | ( | ||||||||||||
| $ | ( | |||||||||||||
| For the Three Months Ended August 31, 2025 | ||||||||||||||
| Commodity derivative contracts | Cost of product sold | $ | ||||||||||||
| Foreign currency contracts | Selling, general, and administrative expenses | |||||||||||||
| Interest rate swap contracts | Interest expense, net | ( | ||||||||||||
| $ | ||||||||||||||
| For the Three Months Ended August 31, 2024 | ||||||||||||||
| Commodity derivative contracts | Cost of product sold | $ | ( | |||||||||||
| Foreign currency contracts | Selling, general, and administrative expenses | ( | ||||||||||||
| $ | ( | |||||||||||||
7. FAIR VALUE OF FINANCIAL INSTRUMENTS
Authoritative guidance establishes a framework for measuring fair value, including a hierarchy for inputs used in measuring fair value that maximizes the use of observable inputs and minimizes the use of unobservable inputs by requiring that the most observable inputs be used when available. The hierarchy includes three levels:
•Level 1 inputs are quoted prices in active markets for identical assets or liabilities;
•Level 2 inputs include data points that are observable such as quoted prices for similar assets or liabilities in active markets, quoted prices for identical assets or similar assets or liabilities in markets that are not active,
| Constellation Brands, Inc. Q2 FY 2026 Form 10-Q | #WORTHREACHINGFOR I 12 | ||||
| FINANCIAL STATEMENTS | NOTES TO CONSOLIDATED FINANCIAL STATEMENTS | |||||||
and inputs (other than quoted prices) such as volatility, interest rates, and yield curves that are observable for the asset or liability, either directly or indirectly; and
•Level 3 inputs are unobservable data points for the asset or liability, and include situations where there is little, if any, market activity for the asset or liability.
FAIR VALUE METHODOLOGY
The following methods and assumptions are used to estimate the fair value of our financial instruments:
Derivative instruments
Our derivative instruments consist of foreign currency forward and option contracts, commodity swap contracts, cross-currency swap contracts, interest rate swap contracts, and Pre-issuance hedge contracts. The fair value is estimated based on quoted market prices from respective counterparties. Quotes are corroborated by using discounted cash flow calculations based upon forward interest-rate yield curves, which are obtained from independent pricing services (Level 2 fair value measurement).
Short-term borrowings
Our short-term borrowings consist of our commercial paper program and the revolving credit facility under our senior credit facility. The revolving credit facility is a variable interest rate bearing note with a fixed margin, adjustable based upon our debt rating (as defined in our senior credit facility). For these short-term borrowings, the carrying value approximates the fair value.
Long-term debt
The fair value of our fixed interest rate long-term debt is estimated by discounting cash flows using interest rates currently available for debt with similar terms and maturities (Level 2 fair value measurement). As of August 31, 2025, the carrying amount of long-term debt, including the current portion, was $10,292.4 million, compared with an estimated fair value of $9,677.9 million. As of February 28, 2025, the carrying amount of long-term debt, including the current portion, was $10,691.0 million, compared with an estimated fair value of $9,999.0 million.
The carrying amounts of certain of our financial instruments, including cash and cash equivalents, accounts receivable, and accounts payable, approximate fair value as of August 31, 2025, and February 28, 2025, due to the relatively short maturity of these instruments.
Recurring basis measurements
The following table presents our financial assets and liabilities measured at estimated fair value on a recurring basis:
| Fair Value Measurements Using | |||||||||||||||||||||||
| Quoted Prices in Active Markets (Level 1) | Significant Other Observable Inputs (Level 2) | Significant Unobservable Inputs (Level 3) | Total | ||||||||||||||||||||
| (in millions) | |||||||||||||||||||||||
| August 31, 2025 | |||||||||||||||||||||||
| Assets: | |||||||||||||||||||||||
| Foreign currency contracts | $ | $ | $ | $ | |||||||||||||||||||
| Commodity derivative contracts | $ | $ | $ | $ | |||||||||||||||||||
| Liabilities: | |||||||||||||||||||||||
| Foreign currency contracts | $ | $ | $ | $ | |||||||||||||||||||
| Commodity derivative contracts | $ | $ | $ | $ | |||||||||||||||||||
| Net investment hedge contracts | $ | $ | $ | $ | |||||||||||||||||||
| Constellation Brands, Inc. Q2 FY 2026 Form 10-Q | #WORTHREACHINGFOR I 13 | ||||
| FINANCIAL STATEMENTS | NOTES TO CONSOLIDATED FINANCIAL STATEMENTS | |||||||
| Fair Value Measurements Using | |||||||||||||||||||||||
| Quoted Prices in Active Markets (Level 1) | Significant Other Observable Inputs (Level 2) | Significant Unobservable Inputs (Level 3) | Total | ||||||||||||||||||||
| (in millions) | |||||||||||||||||||||||
| February 28, 2025 | |||||||||||||||||||||||
| Assets: | |||||||||||||||||||||||
| Foreign currency contracts | $ | $ | $ | $ | |||||||||||||||||||
| Commodity derivative contracts | $ | $ | $ | $ | |||||||||||||||||||
| Pre-issuance hedge contracts | $ | $ | $ | $ | |||||||||||||||||||
| Liabilities: | |||||||||||||||||||||||
| Foreign currency contracts | $ | $ | $ | $ | |||||||||||||||||||
| Commodity derivative contracts | $ | $ | $ | $ | |||||||||||||||||||
Nonrecurring basis measurements
The following table presents our assets and liabilities measured at estimated fair value on a nonrecurring basis for which an impairment assessment was performed for the period presented:
| Fair Value Measurements Using | ||||||||||||||||||||||||||
| Balance Sheet Classification | Quoted Prices in Active Markets (Level 1) | Significant Other Observable Inputs (Level 2) | Significant Unobservable Inputs (Level 3) | Total Losses | ||||||||||||||||||||||
| (in millions) | ||||||||||||||||||||||||||
| For the Six Months Ended August 31, 2025 | ||||||||||||||||||||||||||
| Assets held for sale and related net assets | Assets held for sale | $ | $ | $ | $ | |||||||||||||||||||||
Equity method investments | Other assets | |||||||||||||||||||||||||
| Total | $ | $ | $ | $ | ||||||||||||||||||||||
| For the Six Months Ended August 31, 2024 | ||||||||||||||||||||||||||
Goodwill | Goodwill | $ | $ | $ | $ | |||||||||||||||||||||
Equity method investments | Other assets | |||||||||||||||||||||||||
| Total | $ | $ | $ | $ | ||||||||||||||||||||||
Assets held for sale and related net assets
For the three months ended May 31, 2025, largely in connection with the 2025 Wine Divestitures, then-existing assets held for sale and related net assets were adjusted to their current estimated fair value of $897.7 million, less costs to sell, resulting in a $52.1 million net loss. This net loss was included in asset impairment and related expenses within our consolidated results for the six months ended August 31, 2025. Our estimated fair value of the then-existing assets held for sale was largely based on the expected proceeds from the 2025 Wine Divestitures as of May 31, 2025.
Goodwill
As of August 31, 2024, in connection with negative trends within our Wine and Spirits business primarily attributable to our U.S. wholesale market, driven by declines in both the overall wine market and in our then-owned mainstream and premium wine brands, management updated its Fiscal 2025 outlook for this reporting unit. The updated forecast indicated it was more likely than not the fair value of the Wine and Spirits reporting unit might be below its carrying value. Accordingly, we performed an interim quantitative assessment for goodwill impairment. This assessment indicated that the carrying value of the Wine and Spirits reporting unit exceeded its estimated fair value, resulting in a
| Constellation Brands, Inc. Q2 FY 2026 Form 10-Q | #WORTHREACHINGFOR I 14 | ||||
| FINANCIAL STATEMENTS | NOTES TO CONSOLIDATED FINANCIAL STATEMENTS | |||||||
$2,250.0
When performing a quantitative assessment for impairment of goodwill, we measure the amount of impairment by calculating the amount by which the carrying value of the reporting unit exceeds its estimated fair value. The estimated fair value is determined based on the discounted cash flow calculation. The most significant assumptions used in the discounted cash flow calculation were: (i) a 9 % discount rate, (ii) a 1.5 % expected long-term growth rate, and (iii) the annual cash flow projections.
Equity method investments
8. GOODWILL
The changes in the carrying amount of goodwill are as follows:
| Beer | Wine and Spirits | Consolidated | |||||||||||||||
| (in millions) | |||||||||||||||||
| Balance at February 29, 2024 | $ | $ | $ | ||||||||||||||
Purchase accounting allocations (1) | |||||||||||||||||
| Foreign currency translation adjustments | ( | ( | |||||||||||||||
Goodwill impairment (2) | ( | ( | |||||||||||||||
SVEDKA Divestiture (3) | ( | ( | |||||||||||||||
| Balance at February 28, 2025 | |||||||||||||||||
| Foreign currency translation adjustments | |||||||||||||||||
| Balance at August 31, 2025 | $ | $ | $ | ||||||||||||||
(1)Purchase accounting allocations associated with the Sea Smoke acquisition.
(2)In connection with continued negative trends within our Wine and Spirits business primarily attributable to our U.S. wholesale market, driven by declines in both the overall wine market and in our then-owned mainstream and premium wine brands, management updated its Fiscal 2025 outlook and financial projections for this reporting unit. Based on the aforementioned factors, we performed quantitative assessments that led to goodwill impairments which resulted in the carrying value being written down to zero.
(3)Amount was based on the relative fair value of the portion of the business sold and the remaining wine and spirits portfolio. The relative fair values were determined using the transaction price and the income approach based on assumptions, including projected revenue growth, terminal growth, and discount rates and other projected financial information.
| Constellation Brands, Inc. Q2 FY 2026 Form 10-Q | #WORTHREACHINGFOR I 15 | ||||
| FINANCIAL STATEMENTS | NOTES TO CONSOLIDATED FINANCIAL STATEMENTS | |||||||
9. INTANGIBLE ASSETS
The major components of intangible assets are as follows:
| August 31, 2025 | February 28, 2025 | ||||||||||||||||||||||
| Gross Carrying Amount | Net Carrying Amount | Gross Carrying Amount | Net Carrying Amount | ||||||||||||||||||||
| (in millions) | |||||||||||||||||||||||
| Amortizable intangible assets | |||||||||||||||||||||||
| Customer relationships | $ | $ | $ | $ | |||||||||||||||||||
| Other | |||||||||||||||||||||||
| Total | $ | $ | |||||||||||||||||||||
| Nonamortizable intangible assets | |||||||||||||||||||||||
Trademarks | |||||||||||||||||||||||
| Total intangible assets | $ | $ | |||||||||||||||||||||
We did not incur costs to renew or extend the term of acquired intangible assets for the six months and three months ended August 31, 2025, and August 31, 2024. Net carrying amount represents the gross carrying value net of accumulated amortization.
10. OTHER ASSETS
The major components of other assets are as follows:
| August 31, 2025 | February 28, 2025 | ||||||||||
| (in millions) | |||||||||||
| Operating lease right-of-use asset | $ | $ | |||||||||
Income taxes receivable | |||||||||||
| Equity method investments | |||||||||||
| Derivative assets | |||||||||||
| Other investments in debt and equity securities | |||||||||||
| Exchangeable Shares | |||||||||||
| Other | |||||||||||
| $ | $ | ||||||||||
Equity method investments
We acquired several investments which are being accounted for under the equity method, largely in connection with prior Wine and Spirits segment acquisitions. The primary investment consists of Opus One Winery, a 50 % owned joint venture arrangement.
Other investments in debt and equity securities
We have multiple investments through our corporate venture capital function in debt and equity securities. As of August 31, 2025, and February 28, 2025, we evaluated certain investments, primarily driven by business underperformance and solvency concerns, and concluded they should be written down to zero .
Exchangeable Shares
Following the April 2024 conversion of our Canopy common shares and exchange a portion of the principal amount of a promissory note issued to us by Canopy, we (i) have 26.3 million Exchangeable Shares and (ii) recognized an
| Constellation Brands, Inc. Q2 FY 2026 Form 10-Q | #WORTHREACHINGFOR I 16 | ||||
| FINANCIAL STATEMENTS | NOTES TO CONSOLIDATED FINANCIAL STATEMENTS | |||||||
$83.3 million net gain in income (loss) from unconsolidated investments within our consolidated results for the six months ended August 31, 2024. The fair value of Exchangeable Shares on the date of the conversion and exchange was estimated using a valuation model based primarily on the following inputs: (i) Canopy’s common share price, (ii) the expected volatility of Canopy’s common shares, and (iii) the probability and timing of U.S. federal legalization of recreational cannabis. As the Exchangeable Shares are an equity security without a readily determinable fair value, we elected to account for the Exchangeable Shares under the measurement alternative method. As of February 28, 2025, we evaluated the Exchangeable Shares for impairment primarily due to the continued decline in Canopy’s common share price. We concluded that an impairment did exist, and accordingly, the Exchangeable Shares were written down to their estimated fair value of $21.2 million. The estimated fair value was determined using the same valuation model as of the date of conversion and exchange as noted above. Future impairments, if any, will also be reported in income (loss) from unconsolidated investments within our consolidated results.
11. BORROWINGS
Borrowings consist of the following:
| August 31, 2025 | February 28, 2025 | ||||||||||||||||||||||
| Current | Long-term | Total | Total | ||||||||||||||||||||
| (in millions) | |||||||||||||||||||||||
| Short-term borrowings | |||||||||||||||||||||||
| Commercial paper | $ | $ | |||||||||||||||||||||
| $ | $ | ||||||||||||||||||||||
| Long-term debt | |||||||||||||||||||||||
| Senior notes | $ | $ | $ | $ | |||||||||||||||||||
| Other | |||||||||||||||||||||||
| $ | $ | $ | $ | ||||||||||||||||||||
BANK FACILITIES
2025 Credit Agreement
In April 2025, the Company, CB International, the Administrative Agent, and certain other lenders entered into the 2025 Restatement Agreement that amended and restated our then-existing credit facility (as amended and restated by the 2025 Restatement Agreement, the 2025 Credit Agreement). The principal changes effected by the 2025 Restatement Agreement were (i) refinancing the existing $2.25 billion revolving credit facility, (ii) extending its maturity to April 28, 2030, and (iii) refining certain negative covenants.
2025 Term Credit Agreement
In May 2025, the Company, the Administrative Agent, and certain other lenders entered into the 2025 Term Credit Agreement. The 2025 Term Credit Agreement provides for a six-month delayed draw $500.0 million term loan facility, available in up to two draws. The balance is due and payable two years after the initial funding date, if any, occurs. The proceeds, if drawn, from the 2025 Term Credit Agreement are intended to be used for general corporate purposes, including the repayment of debt.
| Constellation Brands, Inc. Q2 FY 2026 Form 10-Q | #WORTHREACHINGFOR I 17 | ||||
| FINANCIAL STATEMENTS | NOTES TO CONSOLIDATED FINANCIAL STATEMENTS | |||||||
Information with respect to borrowings under our bank facilities is as follows:
| Outstanding borrowings | Interest rate | SOFR margin | Outstanding letters of credit | Remaining borrowing capacity | |||||||||||||||||||||||||
| (in millions) | |||||||||||||||||||||||||||||
| August 31, 2025 | |||||||||||||||||||||||||||||
Revolving credit facility (1) (2) (3) | $ | % | % | $ | $ | ||||||||||||||||||||||||
| February 28, 2025 | |||||||||||||||||||||||||||||
Revolving credit facility (2) (3) (4) | $ | % | % | $ | $ | ||||||||||||||||||||||||
(1)Net of outstanding revolving credit facility borrowings and outstanding letters of credit under the 2025 Credit Agreement, and outstanding borrowings under our commercial paper program of $252.7 million (excluding unamortized discount) (see “Commercial paper program” below).
(2)Contractual interest rate varies based on our debt rating (as defined in the agreement) and is a function of SOFR plus a margin and a credit spread adjustment, or the base rate plus a margin, or, in certain circumstances where SOFR cannot be adequately ascertained or available, an alternative benchmark rate plus a margin.
(3)We and/or CB International are the borrower under the $2,250.0 million revolving credit facility. Includes a sub-facility for letters of credit of up to $200.0 million.
(4)Net of outstanding revolving credit facility borrowings and outstanding letters of credit under our then-existing senior credit facility, and outstanding borrowings under our commercial paper program of $808.0 million (excluding unamortized discount) (see “Commercial paper program” below).
We and our subsidiaries are subject to covenants that are contained in the 2025 Credit Agreement and the 2025 Term Credit Agreement, including those restricting the incurrence of additional subsidiary indebtedness, additional liens, mergers and consolidations, transactions with affiliates, and sale and leaseback transactions, in each case subject to numerous conditions, exceptions, and thresholds. The financial covenants are limited to a minimum interest coverage ratio and a maximum net leverage ratio.
Commercial paper program
We have a commercial paper program which provides for the issuance of up to an aggregate principal amount of $2.25 billion of commercial paper. Our commercial paper program is backed by unused commitments under our revolving credit facility under our 2025 Credit Agreement. Accordingly, outstanding borrowings under our commercial paper program reduce the amount available under our revolving credit facility. Information with respect to our outstanding commercial paper borrowings is as follows:
| August 31, 2025 | February 28, 2025 | ||||||||||
| (in millions) | |||||||||||
Outstanding borrowings (1) | $ | $ | |||||||||
| Weighted average annual interest rate | % | % | |||||||||
| Weighted average remaining term | |||||||||||
(1)Outstanding commercial paper borrowings are net of unamortized discount.
Senior notes
In May 2025, we issued $500.0 million aggregate principal amount of 4.80 % senior notes due May 2030. Proceeds from this offering, net of discount and debt issuance costs, were $496.0 million. Interest on the 4.80 % May 2025 Senior Notes is payable semiannually on May 1 and November 1 of each year, beginning November 1, 2025. The 4.80 % May 2025 Senior Notes are redeemable, in whole or in part, at our option at any time prior to April 1, 2030, at a redemption price equal to 100 % of the outstanding principal amount, plus accrued and unpaid interest and a make-
| Constellation Brands, Inc. Q2 FY 2026 Form 10-Q | #WORTHREACHINGFOR I 18 | ||||
| FINANCIAL STATEMENTS | NOTES TO CONSOLIDATED FINANCIAL STATEMENTS | |||||||
whole payment based on the present value of the future payments at the adjusted treasury rate, as defined in the applicable indenture, plus 20 basis points. On or after April 1, 2030, we may redeem the 4.80 % May 2025 Senior Notes, in whole or in part, at our option at any time at a redemption price equal to 100 % of the outstanding principal amount, plus accrued and unpaid interest. The 4.80 % May 2025 Senior Notes are senior unsecured obligations which rank equally in right of payment to all of our existing and future senior unsecured indebtedness.
On July 2, 2025, we repaid in full $400.0 million aggregate principal amount of 4.75 % December 2015 Senior Notes, using proceeds from the 2025 Wine Divestitures and cash on hand. On June 12, 2025, we repaid in full $500.0 million aggregate principal amount of 5.00 % February 2023 Senior Notes, using proceeds from the 2025 Wine Divestitures. Each of these notes were redeemed prior to maturity at a redemption price equal to 100 % of the outstanding principal amount plus accrued and unpaid interest.
Debt payments
As of August 31, 2025, the required principal repayments under long-term debt obligations (excluding unamortized debt issuance costs and unamortized discounts of $44.9 million and $20.0 million, respectively) for the remaining six months of Fiscal 2026 and for each of the five succeeding fiscal years and thereafter are as follows:
| (in millions) | |||||
| Fiscal 2026 | $ | ||||
| Fiscal 2027 | |||||
| Fiscal 2028 | |||||
| Fiscal 2029 | |||||
| Fiscal 2030 | |||||
| Fiscal 2031 | |||||
| Thereafter | |||||
| $ | |||||
12. INCOME TAXES
Overview
Our effective tax rate for the six months ended August 31, 2025, was 27.6 % of tax expense compared with 30.0 % of tax benefit for the six months ended August 31, 2024. Our effective tax rate for the three months ended August 31, 2025, was 37.9 % of tax expense compared with 11.4 % of tax benefit for the three months ended August 31, 2024.
For the six months and three months ended August 31, 2025, our effective tax rate was higher than the federal statutory rate of 21% largely due to changes in valuation allowances related to net operating losses and tax legislation updates, partially offset by (i) a net income tax benefit recognized as a result of the resolution of various tax examinations and assessments related to prior periods and (ii) the benefit of lower effective tax rates applicable to our foreign businesses.
For the six months ended August 31, 2024, our effective tax rate did not approximate the federal statutory rate of 21% largely due to (i) a net income tax benefit recognized as a result of the resolution of various tax examinations and assessments related to prior periods and (ii) the benefit of lower effective tax rates applicable for foreign businesses, partially offset by a net income tax impact resulting from the non-deductible portion of the Wine and Spirits goodwill impairment.
For the three months ended August 31, 2024, our effective tax rate did not approximate the federal statutory rate of 21% largely due to a net income tax impact resulting from the non-deductible portion of the Wine and Spirits goodwill impairment.
| Constellation Brands, Inc. Q2 FY 2026 Form 10-Q | #WORTHREACHINGFOR I 19 | ||||
| FINANCIAL STATEMENTS | NOTES TO CONSOLIDATED FINANCIAL STATEMENTS | |||||||
Tax Legislation
OB3 Act
On July 4, 2025, the OB3 Act was signed into U.S. law. The OB3 Act extends and modifies several provisions originally introduced under the Tax Cuts and Jobs Act of 2017, while also implementing additional changes to U.S. federal tax law. Key provisions of the OB3 Act include (i) the permanent extension of 100% bonus depreciation for qualifying assets, (ii) the elimination of the requirement to capitalize and amortize U.S.-based research and experimental expenditures, allowing for immediate expensing, (iii) changes to the limitation on the deductibility of interest expense, and (iv) modifications to the taxation of foreign earnings and other international income tax provisions. The OB3 Act contains multiple effective dates, with certain provisions taking effect beginning in calendar year 2025 and others phased in through calendar year 2027.
We have performed an initial evaluation of the impact of the OB3 Act on our consolidated financial statements, including the effects on our annual effective tax rate, deferred tax assets and liabilities, and cash flows. Based on this initial analysis and activities performed in response to the legislation, we believe there will be a negative impact on our effective tax rate for Fiscal 2026, primarily driven by the changes to the limitation on the deductibility of interest expense.
Additionally, for the six months and three months ended August 31, 2025, we recognized a valuation allowance against our deferred tax asset related to prior year interest expense limitations. We will continue to assess the implications of the OB3 Act, and our income tax provision may continue to be impacted as additional clarifications or interpretive guidance related to the OB3 Act is released.
Pillar Two
The OECD introduced a framework under Pillar Two which includes a 15% global minimum tax rate. Many jurisdictions in which we do business have started to enact laws implementing Pillar Two. We are monitoring these developments and currently do not believe these rules will have a material impact on our financial condition and/or consolidated results.
13. STOCKHOLDERS’ EQUITY
Common stock
The number of shares of common stock issued and treasury stock, and associated share activity, are as follows:
| Class A Stock | Class 1 Stock | Class A Stock in Treasury | |||||||||||||||
| Balance at February 28, 2025 | |||||||||||||||||
| Share repurchases | — | — | |||||||||||||||
| Exercise of stock options | — | ( | |||||||||||||||
Vesting of restricted stock units (1) | — | — | ( | ||||||||||||||
| Balance at May 31, 2025 | |||||||||||||||||
| Share repurchases | — | — | |||||||||||||||
| Exercise of stock options | — | — | ( | ||||||||||||||
| Employee stock purchases | — | — | ( | ||||||||||||||
Vesting of restricted stock units (1) | — | — | ( | ||||||||||||||
| Balance at August 31, 2025 | |||||||||||||||||
| Constellation Brands, Inc. Q2 FY 2026 Form 10-Q | #WORTHREACHINGFOR I 20 | ||||
| FINANCIAL STATEMENTS | NOTES TO CONSOLIDATED FINANCIAL STATEMENTS | |||||||
| Class A Stock | Class 1 Stock | Class A Stock in Treasury | |||||||||||||||
| Balance at February 29, 2024 | |||||||||||||||||
| Share repurchases | — | — | |||||||||||||||
| Exercise of stock options | — | ( | |||||||||||||||
Vesting of restricted stock units (1) | — | — | ( | ||||||||||||||
Vesting of performance share units (1) | — | — | ( | ||||||||||||||
| Balance at May 31, 2024 | |||||||||||||||||
| Share repurchases | — | — | |||||||||||||||
| Exercise of stock options | — | ( | |||||||||||||||
| Employee stock purchases | — | — | ( | ||||||||||||||
Vesting of restricted stock units (1) | — | — | ( | ||||||||||||||
| Balance at August 31, 2024 | |||||||||||||||||
(1)Net of the following shares withheld to satisfy tax withholding requirements:
| For the Three Months Ended May 31, | For the Three Months Ended August 31, | For the Six Months Ended August 31, | |||||||||||||||
| 2025 | |||||||||||||||||
| Restricted Stock Units | |||||||||||||||||
| 2024 | |||||||||||||||||
| Restricted Stock Units | |||||||||||||||||
| Performance Share Units | |||||||||||||||||
Stock repurchases
In April 2025, our Board of Directors authorized the repurchase of up to $4.0 billion of our publicly traded common stock under the 2025 Authorization, which expires in February 2028. Shares repurchased under this authorization become treasury shares. For the six months ended August 31, 2025, we repurchased 3,375,602 shares of Class A Stock pursuant to the 2025 Authorization through open market transactions at an aggregate cost of $604.0 million.
As of August 31, 2025, total shares repurchased under our board authorization is as follows:
| Class A Stock | |||||||||||||||||
| Repurchase Authorization | Dollar Value of Shares Repurchased | Number of Shares Repurchased | |||||||||||||||
| (in millions, except share data) | |||||||||||||||||
2025 Authorization (1) | $ | $ | |||||||||||||||
(1)As of August 31, 2025, $3,396.0 million remains available for future share repurchases, excluding the impact of Federal excise tax owed pursuant to the IRA.
| Constellation Brands, Inc. Q2 FY 2026 Form 10-Q | #WORTHREACHINGFOR I 21 | ||||
| FINANCIAL STATEMENTS | NOTES TO CONSOLIDATED FINANCIAL STATEMENTS | |||||||
14. NET INCOME (LOSS) PER COMMON SHARE ATTRIBUTABLE TO CBI
Net income (loss) per common share attributable to CBI (hereafter referred to as “net income (loss) per common share”) – basic for Class A Stock has been computed based on the weighted average shares of common stock outstanding during the period. Net income (loss) per common share – diluted for Class A Stock reflects the weighted average shares of common stock plus the effect of dilutive securities outstanding during the period using the treasury stock method. The effect of dilutive securities includes the impact of outstanding stock-based awards. The dilutive computation does not assume conversion, exercise, or contingent issuance of securities that would have an anti-dilutive effect on the net income (loss) per common share. The computation of basic and diluted net income (loss) per common share for Class A Stock are as follows:
| For the Six Months Ended August 31, | For the Three Months Ended August 31, | ||||||||||||||||||||||
| 2025 | 2024 | 2025 | 2024 | ||||||||||||||||||||
| (in millions, except per share data) | |||||||||||||||||||||||
| Net income (loss) attributable to CBI | $ | $ | ( | $ | $ | ( | |||||||||||||||||
| Weighted average common shares outstanding – basic | |||||||||||||||||||||||
Stock-based awards, primarily stock options (1) | |||||||||||||||||||||||
| Weighted average common shares outstanding – diluted | |||||||||||||||||||||||
| Net income (loss) per common share attributable to CBI – basic | $ | $ | ( | $ | $ | ( | |||||||||||||||||
| Net income (loss) per common share attributable to CBI – diluted | $ | $ | ( | $ | $ | ( | |||||||||||||||||
(1)We have excluded the following weighted average common shares outstanding from the calculation of diluted net loss per common share, as the effect of including these would have been anti-dilutive, in millions:
For the Six Months Ended August 31, 2024 | For the Three Months Ended August 31, 2024 | ||||||||||
| Stock-based awards, primarily stock options | |||||||||||
15. COMPREHENSIVE INCOME (LOSS) ATTRIBUTABLE TO CBI
Comprehensive income (loss) consists of net income (loss), foreign currency translation adjustments, unrealized net gain (loss) on derivative instruments, including cash flow and net investment hedges, pension/postretirement adjustments, and our share of OCI of equity method investments. The reconciliation of net income (loss) attributable to CBI to comprehensive income (loss) attributable to CBI is as follows:
| Before Tax Amount | Tax (Expense) Benefit | Net of Tax Amount | |||||||||||||||
| (in millions) | |||||||||||||||||
| For the Six Months Ended August 31, 2025 | |||||||||||||||||
| Net income (loss) attributable to CBI | $ | ||||||||||||||||
| Other comprehensive income (loss) attributable to CBI: | |||||||||||||||||
| Foreign currency translation adjustments: | |||||||||||||||||
| Net gain (loss) | $ | $ | |||||||||||||||
| Amounts reclassified | |||||||||||||||||
| Net gain (loss) recognized in other comprehensive income (loss) | |||||||||||||||||
| Constellation Brands, Inc. Q2 FY 2026 Form 10-Q | #WORTHREACHINGFOR I 22 | ||||
| FINANCIAL STATEMENTS | NOTES TO CONSOLIDATED FINANCIAL STATEMENTS | |||||||
| Before Tax Amount | Tax (Expense) Benefit | Net of Tax Amount | |||||||||||||||
| (in millions) | |||||||||||||||||
| Unrealized gain (loss) on cash flow hedges: | |||||||||||||||||
Net cash flow hedge gain (loss) | ( | ||||||||||||||||
| Amounts reclassified | ( | ( | |||||||||||||||
| Net gain (loss) recognized in other comprehensive income (loss) | ( | ||||||||||||||||
Unrealized gain (loss) on net investment hedges: | |||||||||||||||||
Net investment hedge gain (loss) | ( | ( | |||||||||||||||
Amounts reclassified | |||||||||||||||||
| Net gain (loss) recognized in other comprehensive income (loss) | ( | ( | |||||||||||||||
| Pension/postretirement adjustments: | |||||||||||||||||
| Net actuarial gain (loss) | ( | ( | |||||||||||||||
| Amounts reclassified | |||||||||||||||||
| Net gain (loss) recognized in other comprehensive income (loss) | ( | ( | |||||||||||||||
| Share of OCI of equity method investments: | |||||||||||||||||
| Net gain (loss) | |||||||||||||||||
| Amounts reclassified | ( | ( | |||||||||||||||
| Net gain (loss) recognized in other comprehensive income (loss) | ( | ( | |||||||||||||||
| Other comprehensive income (loss) attributable to CBI | $ | $ | ( | ||||||||||||||
| Comprehensive income (loss) attributable to CBI | $ | ||||||||||||||||
| For the Six Months Ended August 31, 2024 | |||||||||||||||||
| Net income (loss) attributable to CBI | $ | ( | |||||||||||||||
| Other comprehensive income (loss) attributable to CBI: | |||||||||||||||||
| Foreign currency translation adjustments: | |||||||||||||||||
| Net gain (loss) | $ | ( | $ | ( | |||||||||||||
| Amounts reclassified | |||||||||||||||||
| Net gain (loss) recognized in other comprehensive income (loss) | ( | ( | |||||||||||||||
| Unrealized gain (loss) on cash flow hedges: | |||||||||||||||||
Net cash flow hedge gain (loss) | ( | ( | |||||||||||||||
| Amounts reclassified | ( | ( | |||||||||||||||
| Net gain (loss) recognized in other comprehensive income (loss) | ( | ( | |||||||||||||||
| Pension/postretirement adjustments: | |||||||||||||||||
| Net actuarial gain (loss) | ( | ||||||||||||||||
| Amounts reclassified | |||||||||||||||||
| Net gain (loss) recognized in other comprehensive income (loss) | ( | ||||||||||||||||
Share of OCI of equity method investments: | |||||||||||||||||
| Net gain (loss) | |||||||||||||||||
| Amounts reclassified | ( | ( | ( | ||||||||||||||
| Net gain (loss) recognized in other comprehensive income (loss) | ( | ( | ( | ||||||||||||||
| Other comprehensive income (loss) attributable to CBI | $ | ( | $ | ( | |||||||||||||
| Comprehensive income (loss) attributable to CBI | $ | ( | |||||||||||||||
| Constellation Brands, Inc. Q2 FY 2026 Form 10-Q | #WORTHREACHINGFOR I 23 | ||||
| FINANCIAL STATEMENTS | NOTES TO CONSOLIDATED FINANCIAL STATEMENTS | |||||||
| Before Tax Amount | Tax (Expense) Benefit | Net of Tax Amount | |||||||||||||||
| (in millions) | |||||||||||||||||
| For the Three Months Ended August 31, 2025 | |||||||||||||||||
| Net income (loss) attributable to CBI | $ | ||||||||||||||||
| Other comprehensive income (loss) attributable to CBI: | |||||||||||||||||
| Foreign currency translation adjustments: | |||||||||||||||||
| Net gain (loss) | $ | $ | |||||||||||||||
| Amounts reclassified | |||||||||||||||||
| Net gain (loss) recognized in other comprehensive income (loss) | |||||||||||||||||
| Unrealized gain (loss) on cash flow hedges: | |||||||||||||||||
| Net derivative gain (loss) | ( | ||||||||||||||||
| Amounts reclassified | ( | ( | |||||||||||||||
| Net gain (loss) recognized in other comprehensive income (loss) | ( | ||||||||||||||||
Unrealized gain (loss) on net investment hedges: | |||||||||||||||||
Net investment hedge gain (loss) | ( | ( | |||||||||||||||
Amounts reclassified | |||||||||||||||||
| Net gain (loss) recognized in other comprehensive income (loss) | ( | ( | |||||||||||||||
| Pension/postretirement adjustments: | |||||||||||||||||
| Net actuarial gain (loss) | ( | ( | |||||||||||||||
| Amounts reclassified | |||||||||||||||||
| Net gain (loss) recognized in other comprehensive income (loss) | ( | ( | |||||||||||||||
Share of OCI of equity method investments: | |||||||||||||||||
| Net gain (loss) | |||||||||||||||||
| Amounts reclassified | ( | ( | |||||||||||||||
| Net gain (loss) recognized in other comprehensive income (loss) | ( | ( | |||||||||||||||
| Other comprehensive income (loss) attributable to CBI | $ | $ | ( | ||||||||||||||
| Comprehensive income (loss) attributable to CBI | $ | ||||||||||||||||
| For the Three Months Ended August 31, 2024 | |||||||||||||||||
| Net income (loss) attributable to CBI | $ | ( | |||||||||||||||
| Other comprehensive income (loss) attributable to CBI: | |||||||||||||||||
| Foreign currency translation adjustments: | |||||||||||||||||
| Net gain (loss) | $ | ( | $ | ( | |||||||||||||
| Amounts reclassified | |||||||||||||||||
| Net gain (loss) recognized in other comprehensive income (loss) | ( | ( | |||||||||||||||
| Unrealized gain (loss) on cash flow hedges: | |||||||||||||||||
| Net derivative gain (loss) | ( | ( | |||||||||||||||
| Amounts reclassified | ( | ( | |||||||||||||||
| Net gain (loss) recognized in other comprehensive income (loss) | ( | ( | |||||||||||||||
| Pension/postretirement adjustments: | |||||||||||||||||
| Net actuarial gain (loss) | ( | ||||||||||||||||
| Amounts reclassified | |||||||||||||||||
| Net gain (loss) recognized in other comprehensive income (loss) | ( | ||||||||||||||||
| Constellation Brands, Inc. Q2 FY 2026 Form 10-Q | #WORTHREACHINGFOR I 24 | ||||
| FINANCIAL STATEMENTS | NOTES TO CONSOLIDATED FINANCIAL STATEMENTS | |||||||
| Before Tax Amount | Tax (Expense) Benefit | Net of Tax Amount | |||||||||||||||
| (in millions) | |||||||||||||||||
Share of OCI of equity method investments: | |||||||||||||||||
| Net gain (loss) | |||||||||||||||||
| Amounts reclassified | ( | ||||||||||||||||
| Net gain (loss) recognized in other comprehensive income (loss) | ( | ||||||||||||||||
| Other comprehensive income (loss) attributable to CBI | $ | ( | $ | ( | |||||||||||||
| Comprehensive income (loss) attributable to CBI | $ | ( | |||||||||||||||
Accumulated other comprehensive income (loss), net of income tax effect, includes the following components:
| Foreign Currency Translation Adjustments | Unrealized Net Gain (Loss) on Derivative Instruments | Pension/ Postretirement Adjustments | Share of OCI of Equity Method Investments | Accumulated Other Comprehensive Income (Loss) | |||||||||||||||||||||||||
| (in millions) | |||||||||||||||||||||||||||||
| Balance at February 28, 2025 | $ | ( | $ | $ | ( | $ | ( | $ | ( | ||||||||||||||||||||
| Other comprehensive income (loss): | |||||||||||||||||||||||||||||
| Other comprehensive income (loss) before reclassification adjustments | ( | ||||||||||||||||||||||||||||
| Amounts reclassified from accumulated other comprehensive income (loss) | ( | ( | ( | ||||||||||||||||||||||||||
| Other comprehensive income (loss) | ( | ( | |||||||||||||||||||||||||||
| Balance at August 31, 2025 | $ | ( | $ | $ | ( | $ | ( | $ | ( | ||||||||||||||||||||
16. BUSINESS SEGMENT INFORMATION
Our internal management financial reporting consists of two business divisions: (i) Beer and (ii) Wine and Spirits and we report our operating results in three segments: (i) Beer, (ii) Wine and Spirits, and (iii) Corporate Operations and Other. In the Beer segment, our portfolio consists of high-end imported beer brands and ABAs. We have an exclusive perpetual brand license to produce our Mexican beer portfolio and to import, market, and sell such portfolio in the U.S. In the Wine and Spirits segment, we sell a portfolio comprised of exclusively higher-end wine and spirits brands. Amounts included in the Corporate Operations and Other segment consist of costs of corporate communications, corporate development, corporate finance, corporate strategy, executive management, human resources, internal audit, investor relations, IT, legal, and public affairs, as well as our investments such as those made through our corporate venture capital function. All costs included in the Corporate Operations and Other segment are general costs that are applicable to the consolidated group and are, therefore, not allocated to the other reportable segments. All costs reported within the Corporate Operations and Other segment are not included in our CODM’s evaluation of the operating income (loss) performance of the other reportable segments. Our CODM is our President and Chief Executive Officer. The business segments reflect how our operations are managed, how resources are allocated, how operating performance is evaluated by senior management, and the structure of our internal financial reporting. Long-lived tangible assets and total asset information by segment is not provided to, or reviewed by, our CODM as it is not used to make strategic decisions, allocate resources, or assess performance. Our CODM utilizes segment comparable operating income (loss) performance in deciding how to deploy capital in line with disciplined and balanced priorities. These priorities largely include investing in our people and our brands, making capital investments
| Constellation Brands, Inc. Q2 FY 2026 Form 10-Q | #WORTHREACHINGFOR I 25 | ||||
| FINANCIAL STATEMENTS | NOTES TO CONSOLIDATED FINANCIAL STATEMENTS | |||||||
and strategic acquisitions, providing a cash dividend program, and from time-time time, repurchasing shares of our common stock. Our CODM also monitors budgeted versus actual results in assessing segment operating performance and understanding underlying business trends.
Management excludes Comparable Adjustments from its evaluation of the results of each operating segment as these Comparable Adjustments are not reflective of core operations of the segments. Segment operating performance and the incentive compensation of segment management are evaluated based on core segment operating income (loss) which does not include the impact of these Comparable Adjustments, collectively referred to as comparable operating income (loss). We evaluate segment operating performance based on comparable operating income (loss) of the respective business units.
The accounting policies of the segments are the same as those described for the Company in Note 1 of our consolidated financial statements included in our 2025 Annual Report. Segment information is as follows:
| Beer | Wine and Spirits | Corporate Operations and Other | Consolidated | ||||||||||||||||||||
| (in millions) | |||||||||||||||||||||||
| For the Six Months Ended August 31, 2025 | |||||||||||||||||||||||
| Net sales | $ | $ | $ | $ | |||||||||||||||||||
Cost of product sold (1) | ( | ( | |||||||||||||||||||||
| Marketing | ( | ( | |||||||||||||||||||||
| % Net sales | % | % | |||||||||||||||||||||
General and administrative expenses (1) | ( | ( | ( | ||||||||||||||||||||
Comparable operating income (loss) (1) | ( | ( | |||||||||||||||||||||
| Operating margin | % | ( | % | ||||||||||||||||||||
Comparable adjustments (2) | ( | ||||||||||||||||||||||
| Operating income (loss) | |||||||||||||||||||||||
Income (loss) from unconsolidated investments (3) | ( | ||||||||||||||||||||||
Interest expense, net (4) | ( | ||||||||||||||||||||||
| Income (loss) before income taxes | $ | ||||||||||||||||||||||
| Capital expenditures | $ | $ | $ | $ | |||||||||||||||||||
| Depreciation and amortization | $ | $ | $ | $ | |||||||||||||||||||
| % Net sales | % | % | |||||||||||||||||||||
| For the Six Months Ended August 31, 2024 | |||||||||||||||||||||||
| Net sales | $ | $ | $ | $ | |||||||||||||||||||
Cost of product sold (1) | ( | ( | |||||||||||||||||||||
| Marketing | ( | ( | |||||||||||||||||||||
| % Net sales | % | % | |||||||||||||||||||||
General and administrative expenses (1) | ( | ( | ( | ||||||||||||||||||||
Comparable operating income (loss) (1) | ( | ||||||||||||||||||||||
| Operating margin | % | % | |||||||||||||||||||||
Comparable adjustments (2) | ( | ||||||||||||||||||||||
| Operating income (loss) | ( | ||||||||||||||||||||||
Income (loss) from unconsolidated investments (3) | |||||||||||||||||||||||
Interest expense, net (4) | ( | ||||||||||||||||||||||
| Income (loss) before income taxes | $ | ( | |||||||||||||||||||||
| Constellation Brands, Inc. Q2 FY 2026 Form 10-Q | #WORTHREACHINGFOR I 26 | ||||
| FINANCIAL STATEMENTS | NOTES TO CONSOLIDATED FINANCIAL STATEMENTS | |||||||
| Beer | Wine and Spirits | Corporate Operations and Other | Consolidated | ||||||||||||||||||||
| (in millions) | |||||||||||||||||||||||
| Capital expenditures | $ | $ | $ | $ | |||||||||||||||||||
| Depreciation and amortization | $ | $ | $ | $ | |||||||||||||||||||
| % Net sales | % | % | |||||||||||||||||||||
| For the Three Months Ended August 31, 2025 | |||||||||||||||||||||||
| Net sales | $ | $ | $ | $ | |||||||||||||||||||
Cost of product sold (1) | ( | ( | |||||||||||||||||||||
| Marketing | ( | ( | |||||||||||||||||||||
| % Net sales | % | % | |||||||||||||||||||||
General and administrative expenses (1) | ( | ( | ( | ||||||||||||||||||||
Comparable operating income (loss) (1) | ( | ( | |||||||||||||||||||||
| Operating margin | % | ( | % | ||||||||||||||||||||
Comparable adjustments (2) | ( | ||||||||||||||||||||||
| Operating income (loss) | |||||||||||||||||||||||
Income (loss) from unconsolidated investments (3) | ( | ||||||||||||||||||||||
Interest expense, net (4) | ( | ||||||||||||||||||||||
| Income (loss) before income taxes | $ | ||||||||||||||||||||||
| Capital expenditures | $ | $ | $ | $ | |||||||||||||||||||
| Depreciation and amortization | $ | $ | $ | $ | |||||||||||||||||||
| % Net sales | % | % | |||||||||||||||||||||
| For the Three Months Ended August 31, 2024 | |||||||||||||||||||||||
| Net sales | $ | $ | $ | $ | |||||||||||||||||||
Cost of product sold (1) | ( | ( | |||||||||||||||||||||
| Marketing | ( | ( | |||||||||||||||||||||
| % Net sales | % | % | |||||||||||||||||||||
General and administrative expenses (1) | ( | ( | ( | ||||||||||||||||||||
Comparable operating income (loss) (1) | ( | ||||||||||||||||||||||
| Operating margin | % | % | |||||||||||||||||||||
Comparable adjustments (2) | ( | ||||||||||||||||||||||
| Operating income (loss) | ( | ||||||||||||||||||||||
Income (loss) from unconsolidated investments (3) | ( | ||||||||||||||||||||||
Interest expense, net (4) | ( | ||||||||||||||||||||||
| Income (loss) before income taxes | $ | ( | |||||||||||||||||||||
| Capital expenditures | $ | $ | $ | $ | |||||||||||||||||||
| Depreciation and amortization | $ | $ | $ | $ | |||||||||||||||||||
| % Net sales | % | % | |||||||||||||||||||||
(1)Amounts are determined and presented on a non-GAAP basis and are intended to reflect our core operations.
| Constellation Brands, Inc. Q2 FY 2026 Form 10-Q | #WORTHREACHINGFOR I 27 | ||||
| FINANCIAL STATEMENTS | NOTES TO CONSOLIDATED FINANCIAL STATEMENTS | |||||||
(2)Comparable Adjustments that impacted comparability in our segment operating income (loss) for each period are as follows:
| For the Six Months Ended August 31, | For the Three Months Ended August 31, | ||||||||||||||||||||||
| 2025 | 2024 | 2025 | 2024 | ||||||||||||||||||||
| (in millions) | |||||||||||||||||||||||
| Cost of product sold | |||||||||||||||||||||||
| Net gain (loss) on undesignated commodity derivative contracts | $ | ( | $ | ( | $ | $ | ( | ||||||||||||||||
| Flow through of inventory step-up | ( | ( | ( | ( | |||||||||||||||||||
| Strategic business development costs | ( | ( | |||||||||||||||||||||
| Settlements of undesignated commodity derivative contracts | |||||||||||||||||||||||
| Comparable Adjustments, Cost of product sold | ( | ( | |||||||||||||||||||||
| Selling, general, and administrative expenses | |||||||||||||||||||||||
2025 Restructuring Initiative | ( | ( | |||||||||||||||||||||
| Transition services agreements activity | ( | ( | ( | ( | |||||||||||||||||||
| Strategic business reconfiguration costs | ( | ( | ( | ||||||||||||||||||||
| Gain (loss) on sale of business | ( | ( | |||||||||||||||||||||
Other gains (losses) (i) | ( | ( | |||||||||||||||||||||
| Comparable Adjustments, selling, general, and administrative expenses | ( | ( | ( | ( | |||||||||||||||||||
| Goodwill impairment | ( | ( | |||||||||||||||||||||
Asset impairment and related expenses | ( | ||||||||||||||||||||||
| Comparable Adjustments, Operating income (loss) | $ | ( | $ | ( | $ | ( | $ | ( | |||||||||||||||
(i)Primarily includes the following:
| For the Six Months Ended August 31, | For the Three Months Ended August 31, | ||||||||||||||||||||||
| 2025 | 2024 | 2025 | 2024 | ||||||||||||||||||||
| (in millions) | |||||||||||||||||||||||
Gain (loss) on sale of assets | $ | $ | $ | $ | |||||||||||||||||||
| Net loss on foreign currency as a result of the resolution of various tax examinations and assessments | $ | $ | ( | $ | $ | ( | |||||||||||||||||
(3)Income (loss) from unconsolidated investments consists of:
| For the Six Months Ended August 31, | For the Three Months Ended August 31, | ||||||||||||||||||||||
| 2025 | 2024 | 2025 | 2024 | ||||||||||||||||||||
| (in millions) | |||||||||||||||||||||||
Equity in earnings (losses) from equity method investees and related activities | $ | ( | $ | $ | $ | ||||||||||||||||||
| Net gain in connection with Exchangeable Shares | |||||||||||||||||||||||
| Impairment of equity method investments | ( | ( | ( | ( | |||||||||||||||||||
Unrealized net gain (loss) on securities measured at fair value | ( | ( | ( | ( | |||||||||||||||||||
| $ | ( | $ | $ | ( | $ | ( | |||||||||||||||||
| Constellation Brands, Inc. Q2 FY 2026 Form 10-Q | #WORTHREACHINGFOR I 28 | ||||
| FINANCIAL STATEMENTS | NOTES TO CONSOLIDATED FINANCIAL STATEMENTS | |||||||
(4)Interest expense, net consists of:
| For the Six Months Ended August 31, | For the Three Months Ended August 31, | ||||||||||||||||||||||
| 2025 | 2024 | 2025 | 2024 | ||||||||||||||||||||
| (in millions) | |||||||||||||||||||||||
| Interest expense | $ | ( | $ | ( | $ | ( | $ | ( | |||||||||||||||
| Interest income | |||||||||||||||||||||||
| Loss on extinguishment of debt | ( | ( | |||||||||||||||||||||
| $ | ( | $ | ( | $ | ( | $ | ( | ||||||||||||||||
17. ACCOUNTING GUIDANCE NOT YET ADOPTED
Income taxes
In December 2023, the FASB issued a standard to enhance the transparency and decision usefulness of income tax disclosures. This standard requires public companies to disclose (i) specific categories in the rate reconciliation and provide additional information for reconciling items that meet a quantitative threshold, (ii) the amount of income taxes paid disaggregated by federal, state, and foreign taxes and disaggregated by material individual jurisdictions, and (iii) income from continuing operations before income tax expense disaggregated between domestic and foreign and income tax expense from continuing operations disaggregated by federal, state, and foreign. We are required to adopt these disclosures for our annual period ending February 28, 2026, with early adoption permitted and this standard may be applied retrospectively. We expect this standard to impact our disclosures with no material impacts to our results of operations, cash flows, or financial condition.
Disaggregation of income statement expenses
In November 2024, the FASB issued a standard requiring disaggregated information about certain income statement expense line items to be disclosed on an annual and interim basis. We are required to adopt these disclosures for our annual period ending February 29, 2028, with early adoption permitted and this standard may be applied retrospectively. We expect this standard to impact our disclosures with no material impacts to our results of operations, cash flows, or financial condition.
| Constellation Brands, Inc. Q2 FY 2026 Form 10-Q | #WORTHREACHINGFOR I 29 | ||||
ITEM 2. MANAGEMENT’S DISCUSSION AND ANALYSIS OF FINANCIAL CONDITION AND RESULTS OF OPERATIONS.
INTRODUCTION
This MD&A provides additional information on our businesses, current developments, financial condition, cash flows, and results of operations. It should be read in conjunction with our Financial Statements and with our consolidated financial statements and notes included in our 2025 Annual Report. This MD&A is organized as follows:
Overview
This section provides a general description of our business, which we believe is important in understanding the results of our operations, financial condition, and potential future trends.
Strategy
This section provides a description of our strategy, including our 2025 Restructuring Initiative, and significant divestitures, acquisitions, and investments.
Results of operations
This section provides an analysis of our results of operations presented on a business segment basis for the three months ended August 31, 2025, and August 31, 2024, and six months ended August 31, 2025, and August 31, 2024. In addition, a brief description of significant transactions and other items that affect the comparability of the results is provided.
Liquidity and capital resources
This section provides an analysis of our cash flows, outstanding debt, and liquidity position. Included in the analysis of outstanding debt is a discussion of the financial capacity available to fund our on-going operations and future commitments, as well as a discussion of other financing arrangements.
OVERVIEW
We are an international producer and marketer of beer, wine, and spirits with operations in the U.S., Mexico, New Zealand, and Italy with powerful, consumer-connected, high-quality brands like Modelo Especial, Corona Extra, Pacifico, Robert Mondavi Winery, Kim Crawford, The Prisoner Wine Company, High West, Casa Noble, and Mi CAMPO. In the U.S., we are one of the top growth contributors at retail among beverage alcohol suppliers. We are also the second-largest beer company and have the #1 beer brand, Modelo Especial, in dollar sales in the U.S. We continued to strengthen our leadership position in the U.S. beer market as the #1 dollar share gainer in the high-end and the overall
| Constellation Brands, Inc. Q2 FY 2026 Form 10-Q | #WORTHREACHINGFOR I 30 | ||||
U.S. beer market. Within wine and spirits, we have implemented a multi-year strategy that repositioned this business to a portfolio of exclusively higher-end brands that we believe will generate higher growth and higher margins, aligned to our focus on consumer-led premiumization trends, and we continue to progressively expand our supply channels through DTC and international markets. The strength of our brands makes us a supplier of choice to many of our consumers and our customers, which include wholesale distributors, retailers, and on-premise locations. We conduct our business through entities we wholly own as well as through a variety of joint ventures and other entities.
Our internal management financial reporting consists of two business divisions: (i) Beer and (ii) Wine and Spirits and we report our operating results in three segments: (i) Beer, (ii) Wine and Spirits, and (iii) Corporate Operations and Other. In the Beer segment, our portfolio consists of high-end imported beer brands and ABAs. We have an exclusive perpetual brand license to produce our Mexican beer portfolio and to import, market, and sell such portfolio in the U.S. In the Wine and Spirits segment, we sell a portfolio comprised of exclusively higher-end wine and spirits brands. Amounts included in the Corporate Operations and Other segment consist of costs of corporate communications, corporate development, corporate finance, corporate strategy, executive management, human resources, internal audit, investor relations, IT, legal, and public affairs, as well as our investments such as those made through our corporate venture capital function. All costs included in the Corporate Operations and Other segment are general costs that are applicable to the consolidated group and are, therefore, not allocated to the other reportable segments. All costs reported within the Corporate Operations and Other segment are not included in our CODM’s evaluation of the operating income (loss) performance of the other reportable segments. The business segments reflect how our operations are managed, how resources are allocated, how operating performance is evaluated by senior management, and the structure of our internal financial reporting.
Goodwill impairment
As of August 31, 2024, in connection with negative trends within our Wine and Spirits business primarily attributable to our U.S. wholesale market, driven by declines in both the overall wine market and in our then-owned mainstream and premium wine brands, management updated its Fiscal 2025 outlook for this reporting unit. Based on the aforementioned factors, we performed an interim quantitative assessment for goodwill impairment which indicated that the carrying value of the Wine and Spirits reporting unit exceeded its estimated fair value, resulting in a $2,250.0 million goodwill impairment. This loss from impairment was included in goodwill impairment within our consolidated results for Second Quarter 2025 and Six Months 2025. See Notes 7, 8, and 12 for further discussion.
STRATEGY
Our overall strategic vision is to consistently deliver industry-leading total stockholder returns over the long-term through a focus on these key pillars:
•continue building strong brands people love with advantaged routes to market;
•build a culture that is consumer-obsessed and leverages robust innovation capabilities to stay on the forefront of consumer trends;
•deploy capital in line with disciplined and balanced priorities;
•deliver on impactful environmental, social, and governance initiatives that we believe are not only good business, but also good for the world; and
•empower the whole enterprise to achieve best-in-class operational efficiency.
We will continue to strive for success by ensuring consumer-led decision making drives all aspects of our business; building a strong talent pipeline with best-in-class people development; investing in infrastructure that supports and enables our business, including data systems and architecture; and exemplifying intentional and proactive fiscal management. We place focus on positioning our portfolio on higher-margin, higher-growth categories of the beverage alcohol industry to align with our strategy to address consumer-led premiumization, product, and purchasing trends, which we anticipate will continue to drive faster growth rates relative to the industry. To continue capitalizing on
| Constellation Brands, Inc. Q2 FY 2026 Form 10-Q | #WORTHREACHINGFOR I 31 | ||||
consumer-led premiumization trends, become more competitive, and grow our business, we have employed a strategy dedicated to organic growth and supplemented by targeted investments and acquisitions. Our ongoing digital acceleration initiatives are aimed at driving results by enhancing our technology capabilities in key areas. In Fiscal 2026, we continue to focus on end-to-end digital supply chain planning, logistics, procurement, revenue growth management, and consumer insights and analytics. Additionally, we believe our continued focus on maintaining a strong balance sheet provides a solid financial foundation to support our broader strategic initiatives.
Our business strategy for the Beer segment focuses on upholding our leadership position in the U.S. beer market, including as a leader in the high-end segment, and continuing to grow our high-end imported beer brands through maintenance of leading margins, enhancements to our results of operations and operating cash flow, and exploring new avenues for growth. In Fiscal 2026, we intend to increase distribution for key brands, optimize growth through differentiated brand positioning, price pack architecture, and market prioritization as well as continue to invest in the next phase of modular capacity additions necessary to support our anticipated future growth expectations. Expansion, optimization, and/or construction activities continue under our Mexico Beer Projects. Additionally, we continue to focus on consumer-led innovation by creating new line extensions behind celebrated, trusted brands and package formats, as well as new to world brands, that are intended to meet emerging needs.
Our business strategy for the Wine and Spirits segment continues to focus on delivering growth and improving margins beyond Fiscal 2026 by driving our higher-end brands and operating efficiencies. We have repositioned this business to a portfolio of exclusively higher-end wine and spirits brands that we believe will generate higher growth and higher margins. We remain a key supplier in U.S. 3-tier brick-and-mortar distribution. In addition, we are advancing our aim to become a global, omni-channel competitor in line with evolving consumer preferences as we continue our efforts to progressively expand into international markets, DTC channels (including hospitality), and 3-tier eCommerce.
Marketing, sales, and distribution of our products are primarily managed on a geographic basis allowing us to leverage leading market positions. In addition, market dynamics and consumer trends vary across each of our markets. Within our primary market in the U.S., we offer a range of beverage alcohol products across the imported beer, ABA, and branded wine and spirits categories, with generally separate distribution networks utilized for (i) our beer portfolio and (ii) our wine and spirits portfolio. The environment for our products is competitive in each of our markets.
We remain committed to our long-term financial model of: growing sales, expanding margins, and increasing cash flow in order to continue to achieve comparable earnings per share growth as well as our target ratios for (i) comparable net leverage and (ii) dividend payout; investing to support the growth of our business; and delivering additional returns to stockholders through periodic share repurchases. Our results of operations and financial condition have been and may continue to be affected by the evolving consumer demand environment largely driven by what we believe to be ongoing socioeconomic factors. These factors may include subdued spend, depressed sentiment, value-seeking behaviors, and reductions in the discretionary income available to purchase our products among consumers, elevated unemployment, changing prices, inflation, other unfavorable global and regional economic conditions, demographic trends in the U.S., global supply chain disruptions and constraints, and geopolitical events, including the impact of military conflicts.
Recent developments in international trade relations, including significant changes in U.S. trade policy and actions which include threatened, new, and increased tariffs on other countries and retaliatory tariffs and actions imposed on certain U.S. goods have produced heightened uncertainty with respect to trade and tariff policies and regulations affecting trade between the U.S. and other countries, which could continue to alter the global trade environment. For example, the U.S. government has imposed tariffs on product imports, including on raw and packaging materials, from certain countries (such as Mexico, the European Union including Italy, and New Zealand) and certain other countries have implemented tariffs on U.S. goods, such as the tariffs on certain product imports originating from the U.S. imposed by the Canadian government, although some of these tariffs were subsequently modified or delayed.
| Constellation Brands, Inc. Q2 FY 2026 Form 10-Q | #WORTHREACHINGFOR I 32 | ||||
We expect some or all of these market conditions and their impacts to continue in Fiscal 2026 which could have a material impact on our results of operations and financial condition. We intend to continue to monitor the evolving consumer demand and socioeconomic environments and their impacts on our business. In addition, we have implemented the 2025 Restructuring Initiative, which is an enterprise-wide cost savings and restructuring initiative designed to help optimize the performance of our business, including through enhanced organizational efficiency and optimized expenditures across our organization. We also intend to continue our commodity and foreign exchange hedging programs. However, there can be no assurance that we will be able to adequately respond to softer consumer demand trends or fully mitigate rising costs, including as a result of new or increased tariffs, through increased selling prices, cost, productivity, efficiency, and inventory management initiatives, optimized marketing plans, and/or our commodity and foreign exchange hedging programs. Furthermore, to the extent severe weather events that impact our business, such as wildfires, droughts, floods, extreme heat, and/or late frosts, or other weather conditions that constrain purchasing occasions for our consumers, continue to occur or accelerate in future periods, it could have a material impact on our results of operations and financial condition.
2025 Restructuring Initiative
We have implemented the 2025 Restructuring Initiative which is expected to yield over $200 million in net annualized cost savings by Fiscal 2028. The majority of the work associated with the 2025 Restructuring Initiative is expected to be completed within Fiscal 2026 and is estimated to result in $80 million to $100 million of cumulative pre-tax costs once all phases are fully implemented. In connection with the 2025 Restructuring Initiative, we recognized $21.6 million of pre-tax restructuring costs in Six Months 2026 and $71.3 million of cumulative pre-tax costs since the inception of this initiative. These costs were included in selling, general, and administrative costs within our consolidated results. For additional information on the 2025 Restructuring Initiative, refer to Note 3.
Divestitures, Acquisitions, and Investments
Beer segment
Mexicali Brewery sale
In July 2024, we sold the remaining assets classified as held for sale at the canceled Mexicali Brewery.
Wine and Spirits segment
2025 Wine Divestitures
On June 2, 2025, we sold and, in certain instances, exclusively licensed the trademarks of a portion of our wine and spirits business, primarily centered around our then-owned mainstream wine brands and associated inventory, wineries, vineyards, offices, and facilities for $846.5 million, subject to certain post-closing adjustments. The net cash proceeds from the 2025 Wine Divestitures were used for the repayment of debt. Prior to the completion of the 2025 Wine Divestitures, we recorded the results of operations of the divested and exclusively licensed brands in the Wine and Spirits segment.
SVEDKA Divestiture
On January 6, 2025, we sold the SVEDKA brand and related assets, primarily including inventory and equipment. The net cash proceeds were used for general corporate purposes, including funding share repurchases, capital expenditures, and repayment of debt. Prior to the completion of the SVEDKA Divestiture, we recorded the results of operations of the SVEDKA brand in the Wine and Spirits segment.
Nelson’s Green Brier investment
In October 2024, we purchased the remaining 25% noncontrolling interest in Nelson’s Green Brier, a portfolio of Tennessee-based craft bourbon and whiskey products.
| Constellation Brands, Inc. Q2 FY 2026 Form 10-Q | #WORTHREACHINGFOR I 33 | ||||
Sea Smoke acquisition
In June 2024, we acquired the Sea Smoke business, including a California-based luxury wine brand, vineyards, and a production facility. This transaction also included the acquisition of goodwill, inventory, and a trademark. The results of operations of Sea Smoke are reported in the Wine and Spirits segment and have been included in our consolidated results of operations from the date of acquisition.
These Wine and Spirits segment activities support our strategic focus on consumer-led premiumization trends and meeting the evolving needs of our consumers.
Corporate Operations and Other segment
Corporate ventures investments
As of August 31, 2025, and August 31, 2024, we evaluated certain equity method investments, made through our corporate venture capital function, and determined there were other-than-temporary impairments due to business underperformance, for the respective periods.
Canopy investment
We have an investment in Canopy, a North American cannabis and CPG company providing medical and adult-use cannabis products, which expands our portfolio into adjacent categories.
Exchangeable Shares
In April 2024, we elected to convert our Canopy common shares and exchange a portion of the principal amount of a promissory note issued to us by Canopy. As a result of these transactions, we (i) have 26.3 million Exchangeable Shares and (ii) recognized an $83.3 million net gain based on the fair value of Exchangeable Shares on the date of the conversion and exchange. This net gain is included in income (loss) from unconsolidated investments within our consolidated results for Six Months 2025.
As of February 28, 2025, we evaluated the Exchangeable Shares for impairment primarily due to the continued decline in Canopy’s common share price. We concluded that an impairment did exist, and accordingly, the Exchangeable Shares were written down to their estimated fair value of $21.2 million.
For additional information on these divestitures, acquisitions, and investments refer to Notes 2, 10, and 11.
RESULTS OF OPERATIONS
Financial Highlights
References to organic throughout the following discussion exclude the impacts of the 2025 Wine Divestitures and the SVEDKA Divestiture, collectively referred to as the “Wine and Spirits Divestitures,” where appropriate.
Second Quarter 2026 compared to Second Quarter 2025
Net sales decreased 15% due to (i) the loss of net sales as a result of the Wine and Spirits Divestitures, (ii) a decrease in Beer net sales driven primarily by a shipment volume decline, partially offset by a favorable impact from pricing, and (iii) a decline in organic Wine and Spirits net sales driven by changes in financial and volume related contractual obligations with distributors.
Operating income increased 171% largely due to a Second Quarter 2025 Wine and Spirits goodwill impairment and a successful execution of efficiency and cost optimization initiatives within the Beer segment, partially offset by the (i) loss of net sales as a result of the Wine and Spirits Divestitures and (ii) declines in Beer and organic Wine and Spirits segments net sales.
| Constellation Brands, Inc. Q2 FY 2026 Form 10-Q | #WORTHREACHINGFOR I 34 | ||||
Net income attributable to CBI and diluted net income per common share attributable to CBI increased 139% and 140%, respectively, largely due to the items discussed above, partially offset by a Second Quarter 2026 provision for income taxes as compared to a benefit from income taxes for Second Quarter 2025.
Six Months 2026 compared to Six Months 2025
Net sales decreased 10% due to (i) the loss of net sales as a result of the Wine and Spirits Divestitures, (ii) a decrease in Beer net sales driven primarily by a shipment volume decline, partially offset by a favorable impact from pricing, and (iii) a decline in organic Wine and Spirits net sales driven by changes in financial and volume related contractual obligations with distributors.
Operating income increased 652% largely due to the Six Months 2025 Wine and Spirits goodwill impairment and a successful execution of efficiency and cost optimization initiatives within the Beer segment, partially offset by the (i) loss of net sales as a result of the Wine and Spirits Divestitures, (ii) declines in Beer and organic Wine and Spirits segments net sales, and (iii) losses associated with asset impairment and related expenses.
Net income attributable to CBI and diluted net income per common share attributable to CBI increased 405% and 414%, respectively, largely due to the items discussed above, partially offset by (i) a Six Months 2026 provision for income taxes as compared to a benefit from income taxes for Six Months 2025 and (ii) a Six Months 2025 net gain in connection with Exchangeable Shares.
Comparable Adjustments
Management excludes items that affect comparability from its evaluation of the results of each operating segment as these Comparable Adjustments are not reflective of core operations of the segments. Segment operating performance and the incentive compensation of segment management are evaluated based on core segment operating income (loss) which does not include the impact of these Comparable Adjustments.
As more fully described herein and in the related Notes, the Comparable Adjustments that impacted comparability in our segment results for each period are as follows:
| Second Quarter 2026 | Second Quarter 2025 | Six Months 2026 | Six Months 2025 | ||||||||||||||||||||
| (in millions) | |||||||||||||||||||||||
| Cost of product sold | |||||||||||||||||||||||
| Net gain (loss) on undesignated commodity derivative contracts | $ | 13.0 | $ | (24.3) | $ | (4.7) | $ | (9.7) | |||||||||||||||
| Settlements of undesignated commodity derivative contracts | 4.2 | 7.0 | 6.7 | 15.5 | |||||||||||||||||||
Strategic business reconfiguration costs | (1.2) | — | (1.6) | — | |||||||||||||||||||
| Flow through of inventory step-up | (0.8) | (1.3) | (1.7) | (2.4) | |||||||||||||||||||
| Comparable Adjustments, Cost of product sold | 15.2 | (18.6) | (1.3) | 3.4 | |||||||||||||||||||
| Selling, general, and administrative expenses | |||||||||||||||||||||||
Gain (loss) on sale of business | (14.9) | — | (16.3) | — | |||||||||||||||||||
| Transition services agreements activity | (10.0) | (4.8) | (15.5) | (7.6) | |||||||||||||||||||
| 2025 Restructuring Initiative | (8.3) | — | (21.6) | — | |||||||||||||||||||
| Strategic business reconfiguration costs | — | (24.5) | (5.2) | (26.3) | |||||||||||||||||||
| Other gains (losses) | 5.8 | (21.3) | 3.7 | (21.1) | |||||||||||||||||||
| Comparable Adjustments, Selling, general, and administrative expenses | (27.4) | (50.6) | (54.9) | (55.0) | |||||||||||||||||||
| Goodwill impairment | — | (2,250.0) | — | (2,250.0) | |||||||||||||||||||
| Constellation Brands, Inc. Q2 FY 2026 Form 10-Q | #WORTHREACHINGFOR I 35 | ||||
| Second Quarter 2026 | Second Quarter 2025 | Six Months 2026 | Six Months 2025 | ||||||||||||||||||||
| (in millions) | |||||||||||||||||||||||
Asset impairment and related expenses | — | — | (52.1) | — | |||||||||||||||||||
| Comparable Adjustments, Operating income (loss) | $ | (12.2) | $ | (2,319.2) | $ | (108.3) | $ | (2,301.6) | |||||||||||||||
| Comparable Adjustments, Income (loss) from unconsolidated investments | $ | (10.1) | $ | (4.5) | $ | (10.1) | $ | 78.8 | |||||||||||||||
Cost of product sold
Undesignated commodity derivative contracts
Net gain (loss) on undesignated commodity derivative contracts represents a net gain (loss) from the changes in fair value of undesignated commodity derivative contracts. The net gain (loss) is reported outside of segment operating results until such time that the underlying exposure is recognized in the segment operating results. At settlement, the net gain (loss) from the changes in fair value of the undesignated commodity derivative contracts is reported in the appropriate operating segment, allowing the results of our operating segments to reflect the economic effects of the commodity derivative contracts without the resulting unrealized mark to fair value volatility.
Strategic business reconfiguration costs
We recognized costs primarily in connection with losses on write-downs of excess inventory resulting from our initiatives to streamline, increase efficiencies, and reduce our cost structure primarily within our Wine and Spirits segment (Second Quarter 2026, Six Months 2026).
Flow through of inventory step-up
In connection with acquisitions, the allocation of purchase price in excess of book value for certain inventories on hand at the date of acquisition is referred to as inventory step-up. Inventory step-up represents an assumed manufacturing profit attributable to the acquired business prior to acquisition.
Selling, general, and administrative expenses
Gain (loss) on sale of business
We recognized a net loss from the sales of businesses largely in connection with the 2025 Wine Divestitures (Second Quarter 2026, Six Months 2026).
Transition services agreements activity
We recognized costs in connection with transition services agreements related to the previous sales of portions of our wine and spirits business.
2025 Restructuring Initiative
We recognized costs in connection with an enterprise-wide cost savings and restructuring initiative designed to help optimize the performance of our business (Second Quarter 2026, Six Months 2026).
Strategic business reconfiguration costs
We recognized costs in connection with certain activities which are intended to streamline, increase efficiencies, and reduce our cost structure.
Other gains (losses)
We recognized other gains (losses) primarily from (i) a net gain from the sale of assets (Second Quarter 2026, Six Months 2026) and (ii) a net loss on foreign currency as a result of the resolution of various tax examinations and assessments (Second Quarter 2025, Six Months 2025).
| Constellation Brands, Inc. Q2 FY 2026 Form 10-Q | #WORTHREACHINGFOR I 36 | ||||
Goodwill impairment
We recognized a goodwill impairment in connection with negative trends within our Wine and Spirits business (Second Quarter 2025, Six Months 2025). For additional information, refer to Notes 7, 8, and 12.
Asset impairment and related expenses
Largely in connection with the 2025 Wine Divestitures we recognized contract liabilities and inventory obsolescence expenses, partially offset by changes in then-existing net assets held for sale (Six Months 2026). For additional information, refer to Note 7.
Income (loss) from unconsolidated investments
We recognized income (loss) from (i) unrealized net losses from the changes in fair value of our securities measured at fair value, (ii) impairments of equity method investments, and (iii) a net gain in connection with Exchangeable Shares (Six Months 2025) For additional information, refer to Note 10.
Business Segments
Second Quarter 2026 compared to Second Quarter 2025
Net sales
| Second Quarter 2026 | Second Quarter 2025 | Dollar Change | Percent Change | ||||||||||||||||||||
| (in millions) | |||||||||||||||||||||||
| Beer | $ | 2,345.0 | $ | 2,530.2 | $ | (185.2) | (7 | %) | |||||||||||||||
| Wine and Spirits: | |||||||||||||||||||||||
| Wine | 112.5 | 336.2 | (223.7) | (67 | %) | ||||||||||||||||||
| Spirits | 23.5 | 52.5 | (29.0) | (55 | %) | ||||||||||||||||||
| Total Wine and Spirits | 136.0 | 388.7 | (252.7) | (65 | %) | ||||||||||||||||||
| Consolidated net sales | $ | 2,481.0 | $ | 2,918.9 | $ | (437.9) | (15 | %) | |||||||||||||||
 | Beer segment | Second Quarter 2026 | Second Quarter 2025 | Dollar Change | Percent Change | |||||||||||||||||||||
| (in millions, branded product, 24-pack, 12-ounce case equivalents) | ||||||||||||||||||||||||||
| Net sales | $ | 2,345.0 | $ | 2,530.2 | $ | (185.2) | (7 | %) | ||||||||||||||||||
| Shipments | 117.4 | 128.6 | (8.7 | %) | ||||||||||||||||||||||
| Depletions | (2.7 | %) | ||||||||||||||||||||||||
The decrease in Beer net sales is largely due to a $219.3 million decrease in shipment volume, partially offset by $40.6 million of favorable impact from pricing in select markets. We believe our net sales continue to be suppressed by the socioeconomic factors discussed above. Additionally, shipments trailed depletions as distributors rebalanced inventory levels during Second Quarter 2026.
| Constellation Brands, Inc. Q2 FY 2026 Form 10-Q | #WORTHREACHINGFOR I 37 | ||||
 | Wine and Spirits segment | Second Quarter 2026 | Second Quarter 2025 | Dollar Change | Percent Change | |||||||||||||||||||||
| (in millions, branded product, 9-liter case equivalents) | ||||||||||||||||||||||||||
| Net sales | $ | 136.0 | $ | 388.7 | $ | (252.7) | (65 | %) | ||||||||||||||||||
| Shipments | ||||||||||||||||||||||||||
Total | 1.3 | 5.5 | (76.4 | %) | ||||||||||||||||||||||
Organic (1) (2) | 1.3 | 1.4 | (7.1 | %) | ||||||||||||||||||||||
U.S. Wholesale | 0.8 | 4.9 | (83.7 | %) | ||||||||||||||||||||||
Organic U.S. Domestic (1) (2) | 0.8 | 1.0 | (20.0 | %) | ||||||||||||||||||||||
| Depletions | 2.0 | % | ||||||||||||||||||||||||
(1)Includes adjustments to remove volumes associated with the SVEDKA Divestiture for the period June 1, 2024, through August 31, 2024.
(2)Includes adjustments to remove volumes associated with the 2025 Wine Divestitures for the period June 2, 2024, through August 31, 2024.
The decrease in Wine and Spirits net sales is due to $220.5 million from the Wine and Spirits Divestitures that are no longer part of our business and a $32.2 million decrease in organic net sales. The decrease in organic net sales is largely driven by (i) $12.3 million of unfavorable product mix, (ii) a $12.1 million decrease in branded wine and spirits shipment volume, and (iii) an $8.7 million decrease in contractual distributor payments as compared to Second Quarter 2025. The decrease in unfavorable product mix and branded wine and spirits shipment volume are both attributable to our U.S. wholesale and international markets driven by the continued change in cadence of shipments to better align with ongoing weaker consumer demand. Additionally, we believe our branded wine and spirits shipment volume was negatively impacted by both tariffs imposed by the U.S. government and by retaliatory tariffs and actions in certain international markets.
Gross profit
| Second Quarter 2026 | Second Quarter 2025 | Dollar Change | Percent Change | ||||||||||||||||||||
| (in millions) | |||||||||||||||||||||||
| Beer | $ | 1,240.0 | $ | 1,366.4 | $ | (126.4) | (9 | %) | |||||||||||||||
| Wine and Spirits | 54.8 | 164.0 | (109.2) | (67 | %) | ||||||||||||||||||
| Comparable Adjustments | 15.2 | (18.6) | 33.8 | NM | |||||||||||||||||||
| Consolidated gross profit | $ | 1,310.0 | $ | 1,511.8 | $ | (201.8) | (13 | %) | |||||||||||||||
| The decrease in Beer gross profit is largely due to (i) a $118.3 million decline in shipment volume and (ii) $42.9 million of increased cost of product sold, partially offset by the $35.8 million favorable impact from pricing. The increase in cost of product sold is primarily due to (i) $22.6 million in tariffs on aluminum cans, (ii) $10.0 million of unfavorable fixed cost absorption related to decreased production levels as compared to Second Quarter 2025, (iii) $8.0 million of increased transportation costs, and (iv) $6.7 million of higher depreciation resulting from the Mexico Beer Projects. To partially offset the increase in cost of product sold we are executing efficiency and cost optimization initiatives focused largely on procurement and logistics that resulted in nearly $65 million of net benefit for Second Quarter 2026. | ||||
| Constellation Brands, Inc. Q2 FY 2026 Form 10-Q | #WORTHREACHINGFOR I 38 | ||||
| The decrease in Wine and Spirits gross profit is due to $83.4 million from the Wine and Spirits Divestitures that is no longer part of our business and a $25.8 million decrease in organic gross profit. The decrease in organic gross profit is largely attributable to (i) $10.1 million of unfavorable product mix, (ii) the $8.7 million decrease in contractual distributor payments, (iii) a $5.2 million decline in branded wine and spirits shipment volume, and (iv) a $2.4 million increase in cost of product sold. The increase in cost of product sold is largely attributable to higher Second Quarter 2026 short-term incentive accruals and unfavorable fixed cost absorption related to decreased production levels as compared to Second Quarter 2025. | ||||
Gross profit as a percent of net sales increased to 52.8% for Second Quarter 2026 compared with 51.8% for Second Quarter 2025. This increase was largely driven by rate growth from (i) a change in Comparable Adjustments, contributing approximately 130 basis points, (ii) 125 basis points driven by divestitures of lower-margin brands, and (iii) Beer pricing, which contributed rate growth of approximately 70 basis points. These increases were partially offset by (i) approximately 160 basis points of rate decline from higher cost of product sold within the Beer segment, (ii) approximately 20 basis points from shipment volume decline within the Beer segment, and (iii) approximately 15 basis points each of unfavorable product mix shift and lower contractual distributor payments both within the Wine and Spirits segment.
Selling, general, and administrative expenses
| Second Quarter 2026 | Second Quarter 2025 | Dollar Change | Percent Change | ||||||||||||||||||||
| (in millions) | |||||||||||||||||||||||
| Beer | $ | 288.4 | $ | 288.7 | $ | (0.3) | — | % | |||||||||||||||
| Wine and Spirits | 74.6 | 93.5 | (18.9) | (20 | %) | ||||||||||||||||||
| Corporate Operations and Other | 45.6 | 58.4 | (12.8) | (22 | %) | ||||||||||||||||||
| Comparable Adjustments | 27.4 | 50.6 | (23.2) | NM | |||||||||||||||||||
| Consolidated selling, general, and administrative expenses | $ | 436.0 | $ | 491.2 | $ | (55.2) | (11 | %) | |||||||||||||||
| Beer selling, general, and administrative expenses remained relatively flat as $2.8 million of decreased marketing spend was offset by $2.5 million of increased general and administrative expenses. Marketing as a percentage of net sales increased year-over-year to support our high-end imported beer brands. The increase in general and administrative expenses was driven largely by unfavorable foreign currency impact. | ||||
| The decrease in Wine and Spirits selling, general, and administrative expenses is largely due to $16.0 million and $2.2 million of decreased marketing spend and general and administrative expenses, respectively. The decrease in marketing spend is primarily driven by our smaller portfolio of exclusively higher-end wine and spirits brands, however, as a percentage of net sales, it increased year-over-year driven by support of our largest brands. The decrease in general and administrative expenses was largely driven by cost savings measures as a result of the 2025 Restructuring Initiative. | ||||
 | The decrease in Corporate Operations and Other selling, general, and administrative expenses is largely due to a decrease in compensation and benefits, driven by lower (i) short-term incentive accruals, (ii) headcount resulting from the 2025 Restructuring Initiative, and (iii) stock-based compensation expense as compared to Second Quarter 2025, partially offset by a Second Quarter 2025 tax credit related to our June 2024 corporate headquarters relocation. | ||||
Selling, general, and administrative expenses as a percent of net sales increased to 17.6% for Second Quarter 2026 as compared to 16.8% for Second Quarter 2025. The increase is driven by (i) approximately 125 basis points of unfavorable impact from the Wine and Spirits Divestitures and (ii) approximately 105 basis points of rate growth as the decline in Beer net sales exceeded the decrease in selling, general, and administrative expenses, partially offset by (i) a favorable change in Comparable Adjustments, contributing approximately 75 basis points of rate decline and
| Constellation Brands, Inc. Q2 FY 2026 Form 10-Q | #WORTHREACHINGFOR I 39 | ||||
(ii) approximately 40 basis points of rate decline from lower selling, general, and administrative expenses in both the Wine and Spirits and Corporate Operations and Other segments.
Operating income (loss)
| Second Quarter 2026 | Second Quarter 2025 | Dollar Change | Percent Change | ||||||||||||||||||||
| (in millions) | |||||||||||||||||||||||
| Beer | $ | 951.6 | $ | 1,077.7 | $ | (126.1) | (12 | %) | |||||||||||||||
| Wine and Spirits | (19.8) | 70.5 | (90.3) | (128 | %) | ||||||||||||||||||
| Corporate Operations and Other | (45.6) | (58.4) | 12.8 | 22 | % | ||||||||||||||||||
| Comparable Adjustments | (12.2) | (2,319.2) | 2,307.0 | NM | |||||||||||||||||||
| Consolidated operating income (loss) | $ | 874.0 | $ | (1,229.4) | $ | 2,103.4 | 171 | % | |||||||||||||||
| The decrease in Beer operating income is largely attributable to the decline in shipment volume and the unfavorable impacts from tariffs on aluminum cans and fixed cost absorption, partially offset by the favorable impacts from pricing and efficiency and cost optimization initiatives, as described above. | ||||
| The decrease in Wine and Spirits operating income is largely attributable to the (i) Wine and Spirits Divestitures, (ii) unfavorable product mix, (iii) decline in contractual distributor payments, and (iv) decline in organic branded wine and spirits shipment volume, partially offset by lower marketing spend, as described above. | ||||
| As previously discussed, the decrease in Corporate Operations and Other operating loss is largely due to the decrease in compensation and benefits, partially offset by the Second Quarter 2025 tax credit. | ||||
Income (loss) from unconsolidated investments
| Second Quarter 2026 | Second Quarter 2025 | Dollar Change | Percent Change | ||||||||||||||||||||
| (in millions) | |||||||||||||||||||||||
Equity in earnings (losses) from equity method investees and related activities | $ | 3.0 | $ | 3.4 | $ | (0.4) | (12 | %) | |||||||||||||||
| Impairment of equity method investments | (1.5) | (2.1) | 0.6 | 29 | % | ||||||||||||||||||
| Unrealized net gain (loss) on securities measured at fair value | (5.0) | (2.5) | (2.5) | (100 | %) | ||||||||||||||||||
Income (loss) from unconsolidated investments | $ | (3.5) | $ | (1.2) | $ | (2.3) | (192 | %) | |||||||||||||||
Interest expense, net
Interest expense, net decreased to $87.6 million for Second Quarter 2026 as compared to $104.0 million for Second Quarter 2025. This decrease of $16.4 million, or 16%, is due to approximately $1.1 billion of lower average borrowings and approximately 15 basis points of lower weighted average interest rates. For additional information, refer to Note 11.
| Constellation Brands, Inc. Q2 FY 2026 Form 10-Q | #WORTHREACHINGFOR I 40 | ||||
(Provision for) benefit from income taxes
The (provision for) benefit from income taxes increased to $(296.8) million for Second Quarter 2026 from $152.2 million for Second Quarter 2025. Our effective tax rate for Second Quarter 2026 was 37.9% as compared with 11.4% for Second Quarter 2025. In comparison to prior year, our effective tax rate was largely impacted by:
•net income tax impacts resulting from (i) changes to valuation allowances related to net operating losses and tax legislation updates and (ii) effective tax rates applicable for foreign businesses; partially offset by
•a net income tax benefit resulting from the resolution of various tax examinations and assessments related to prior periods; and
•net income tax impacts from the (i) Second Quarter 2025 non-deductible portion of the Wine and Spirits goodwill impairment and (ii) Second Quarter 2025 sale of remaining assets at the canceled Mexicali Brewery.
For additional information, refer to Note 12.
Net income (loss) attributable to CBI
Net income attributable to CBI increased to $466.0 million for Second Quarter 2026 from $(1,199.0) million for Second Quarter 2025. This increase of $1,665.0 million, or 139%, is largely attributable to the Second Quarter 2025 Wine and Spirits goodwill impairment, partially offset by the (i) net sales declines in both the Wine and Spirits and Beer segments, (ii) Second Quarter 2026 provision for income taxes as compared to a benefit from income taxes for Second Quarter 2025, and (iii) Second Quarter 2025 net gain in connection with Exchangeable Shares.
Six Months 2026 compared to Six Months 2025
Net sales
| Six Months 2026 | Six Months 2025 | Dollar Change | Percent Change | ||||||||||||||||||||
| (in millions) | |||||||||||||||||||||||
| Beer | $ | 4,579.5 | $ | 4,803.0 | $ | (223.5) | (5 | %) | |||||||||||||||
| Wine and Spirits: | |||||||||||||||||||||||
| Wine | 371.0 | 665.5 | (294.5) | (44 | %) | ||||||||||||||||||
| Spirits | 45.5 | 112.2 | (66.7) | (59 | %) | ||||||||||||||||||
| Total Wine and Spirits | 416.5 | 777.7 | (361.2) | (46 | %) | ||||||||||||||||||
| Consolidated net sales | $ | 4,996.0 | $ | 5,580.7 | $ | (584.7) | (10 | %) | |||||||||||||||
| Beer segment | Six Months 2026 | Six Months 2025 | Dollar Change | Percent Change | |||||||||||||||||||||
| (in millions, branded product, 24-pack, 12-ounce case equivalents) | ||||||||||||||||||||||||||
| Net sales | $ | 4,579.5 | $ | 4,803.0 | $ | (223.5) | (5%) | |||||||||||||||||||
| Shipments | 228.7 | 243.7 | (6.2%) | |||||||||||||||||||||||
Depletions | (2.6%) | |||||||||||||||||||||||||
The decrease in Beer net sales is largely due to a (i) $295.1 million decrease in shipment volume and (ii) $14.0 million of unfavorable product mix primarily from a shift in package types, partially offset by $85.6 million of favorable impact from pricing in select markets. We believe our net sales continue to be suppressed by the socioeconomic factors discussed above. Additionally, shipments trailed depletions as distributors rebalanced inventory levels during Second Quarter 2026. We expect shipment volume to generally align with depletion volume for Fiscal 2026.
| Constellation Brands, Inc. Q2 FY 2026 Form 10-Q | #WORTHREACHINGFOR I 41 | ||||
| Wine and Spirits segment | Six Months 2026 | Six Months 2025 | Dollar Change | Percent Change | |||||||||||||||||||||
| (in millions, branded product, 9-liter case equivalents) | ||||||||||||||||||||||||||
| Net sales | $ | 416.5 | $ | 777.7 | $ | (361.2) | (46 | %) | ||||||||||||||||||
| Shipments | ||||||||||||||||||||||||||
Total | 5.2 | 11.1 | (53.2 | %) | ||||||||||||||||||||||
Organic (1) (2) | 5.2 | 5.9 | (11.9 | %) | ||||||||||||||||||||||
| U.S. Wholesale shipments | 4.1 | 9.8 | (58.2 | %) | ||||||||||||||||||||||
Organic U.S. Domestic (1) (2) | 4.1 | 4.8 | (14.6 | %) | ||||||||||||||||||||||
| Depletions | (6.3 | %) | ||||||||||||||||||||||||
(1)Includes adjustments to remove volumes associated with the SVEDKA Divestiture for the period March 1, 2024, through August 31, 2024.
(2)Includes adjustments to remove volumes associated with the 2025 Wine Divestitures for the period June 2, 2024, through August 31, 2024.
The decrease in Wine and Spirits net sales is due to $256.5 million from the Wine and Spirits Divestitures that are no longer part of our business and a $104.7 million decrease in organic net sales. The decrease in organic net sales is largely driven by (i) a $66.8 million decrease in branded wine and spirits shipment volume, (ii) a $17.7 million decrease from pricing actions in certain markets, (iii) $12.5 million in lower contractual distributor payments as compared to Six Months 2025, and (iv) $9.7 million of unfavorable product mix. The decrease in branded wine and spirits shipment volume and unfavorable product mix are primarily attributable to our U.S. wholesale market, including the continued change in cadence of shipments to better align with ongoing weaker consumer demand particularly affecting the overall mainstream price segments prior to the 2025 Wine Divestitures. Additionally, we believe our branded wine and spirits shipment volume was negatively impacted by both tariffs imposed by the U.S. government and by retaliatory tariffs and actions in certain international markets. We also continue to expect depletion volume to outpace shipment volume for Fiscal 2026.
Gross profit
| Six Months 2026 | Six Months 2025 | Dollar Change | Percent Change | ||||||||||||||||||||
| (in millions) | |||||||||||||||||||||||
| Beer | $ | 2,427.0 | $ | 2,579.5 | $ | (152.5) | (6 | %) | |||||||||||||||
| Wine and Spirits | 150.9 | 332.7 | (181.8) | (55 | %) | ||||||||||||||||||
| Comparable Adjustments | (1.3) | 3.4 | (4.7) | NM | |||||||||||||||||||
| Consolidated gross profit | $ | 2,576.6 | $ | 2,915.6 | $ | (339.0) | (12 | %) | |||||||||||||||
| The decrease in Beer gross profit is primarily due to (i) a $157.7 million decrease in shipment volume and (ii) $79.0 million of increased cost of product sold, partially offset by the $85.6 million of favorable impact from pricing. The increased cost of product sold is primarily due to (i) $37.1 million of unfavorable fixed cost absorption related to decreased production levels as compared to Six Months 2025, (ii) $29.5 million in tariffs on aluminum cans, (iii) an $8.7 million increase in brewery costs, including maintenance and utilities, and (iv) $5.1 million of higher depreciation resulting from the Mexico Beer Projects. To partially offset the increase in cost of product sold we are executing efficiency and cost optimization initiatives focused largely on procurement and logistics that resulted in over $105 million of net benefit for Six Months 2026. | ||||
| Constellation Brands, Inc. Q2 FY 2026 Form 10-Q | #WORTHREACHINGFOR I 42 | ||||
| The decrease in Wine and Spirits gross profit is due to $98.5 million from the Wine and Spirits Divestitures that is no longer part of our business and an $83.3 million decrease in organic gross profit. The decrease in organic gross profit is largely attributable to (i) a $42.5 million decrease in branded wine and spirits shipment volume, (ii) the $17.7 million of unfavorable pricing, (iii) the $12.5 million decrease in contractual distributor payments, and (iv) a $6.9 million increase in cost of product sold. The increase in cost of product sold is largely attributable to unfavorable fixed cost absorption related to decreased production levels as compared to Six Months 2025 and a higher Six Months 2026 short-term incentive accrual, partially offset by decreased transportation costs. | ||||
Gross profit as a percent of net sales decreased to 51.6% for Six Months 2026 compared with 52.2% for Six Months 2025. This decrease was largely due to (i) approximately 160 basis points and 15 basis points of rate decline from higher cost of product sold within the Beer and Wine and Spirits segments, respectively, (ii) 30 basis points as a result of pricing actions in certain markets and lower contractual distributor payments within the Wine and Spirits segment, and (iii) approximately 15 basis points of lower organic branded Wine and Spirits shipment volume. These declines were partially offset by (i) approximately 80 basis points of favorable impact from Beer pricing and (ii) approximately 75 basis points driven by divestitures of lower-margin brands.
Selling, general, and administrative expenses
| Six Months 2026 | Six Months 2025 | Dollar Change | Percent Change | ||||||||||||||||||||
| (in millions) | |||||||||||||||||||||||
| Beer | $ | 602.0 | $ | 578.8 | $ | 23.2 | 4 | % | |||||||||||||||
| Wine and Spirits | 176.7 | 202.5 | (25.8) | (13 | %) | ||||||||||||||||||
| Corporate Operations and Other | 103.1 | 117.1 | (14.0) | (12 | %) | ||||||||||||||||||
| Comparable Adjustments | 54.9 | 55.0 | (0.1) | NM | |||||||||||||||||||
| Consolidated selling, general, and administrative expenses | $ | 936.7 | $ | 953.4 | $ | (16.7) | (2 | %) | |||||||||||||||
| The increase in Beer selling, general, and administrative expenses is largely driven by $15.4 million and $7.4 million of increased general and administrative expenses and marketing spend, respectively. The increase in general and administrative expenses is primarily due to higher compensation and benefits and consulting costs. Marketing as a percentage of net sales increased year-over-year to support our high-end imported beer brands. We now expect marketing as a percentage of net sales to approximate 9% for Fiscal 2026. | ||||
| The decrease in Wine and Spirits selling, general, and administrative expenses is largely driven by $22.0 million and $3.3 million of decreased marketing spend and general and administrative expenses, respectively. The decrease in marketing spend is primarily driven by our smaller portfolio of exclusively higher-end wine and spirits brands, however, as a percentage of net sales, it increased year-over-year driven by support of our largest brands. The decrease in general and administrative expenses is largely driven by cost savings measures as a result of the 2025 Restructuring Initiative. | ||||
| The decrease in Corporate Operations and Other selling, general, and administrative expenses is largely due to a decrease in compensation and benefits driven by lower (i) stock-based compensation expense as compared to Six Months 2025, (ii) headcount resulting from the 2025 Restructuring Initiative, and (iii) short-term incentive accruals, partially offset by the Six Months 2025 tax credit and higher depreciation expense, each as a result of our June 2024 corporate headquarters relocation. | ||||
Selling, general, and administrative expenses as a percent of net sales increased to 18.7% for Six Months 2026 as compared with 17.1% for Six Months 2025. The increase is largely driven by (i) 120 basis points of rate growth from higher Beer selling, general, and administrative expenses coupled with the decline in Beer net sales and
| Constellation Brands, Inc. Q2 FY 2026 Form 10-Q | #WORTHREACHINGFOR I 43 | ||||
(ii) approximately 90 basis points of unfavorable impact from the Wine and Spirits Divestitures, partially offset by approximately 30 basis points and 15 basis points of rate decline from decreases in selling, general, and administrative expenses within the Wine and Spirits and Corporate Operations and Other segments, respectively.
Operating income (loss)
| Six Months 2026 | Six Months 2025 | Dollar Change | Percent Change | ||||||||||||||||||||
| (in millions) | |||||||||||||||||||||||
| Beer | $ | 1,825.0 | $ | 2,000.7 | $ | (175.7) | (9 | %) | |||||||||||||||
| Wine and Spirits | (25.8) | 130.2 | (156.0) | (120 | %) | ||||||||||||||||||
| Corporate Operations and Other | (103.1) | (117.1) | 14.0 | 12 | % | ||||||||||||||||||
| Comparable Adjustments | (108.3) | (2,301.6) | 2,193.3 | NM | |||||||||||||||||||
| Consolidated operating income (loss) | $ | 1,587.8 | $ | (287.8) | $ | 1,875.6 | 652 | % | |||||||||||||||
| The decrease in Beer operating income is largely attributable to the decline in shipment volume growth and the increase in cost of product sold, including tariffs on aluminum cans, partially offset by the favorable impact from pricing and efficiency and cost optimization initiatives, as described above. For Fiscal 2026, we expect an approximate $70 million impact from tariffs. | ||||
| The decrease in Wine and Spirits operating income is largely attributable to the (i) Wine and Spirits Divestitures, (ii) decline in organic branded wine and spirits shipment volume, (iii) unfavorable pricing, and (iv) lower contractual distributor payments, partially offset by lower marketing spend, as described above. For Fiscal 2026, we expect an approximate $20 million impact from tariffs. | ||||
| As previously discussed, the decrease in Corporate Operations and Other operating loss is largely due to the decrease in compensation and benefits, partially offset by the Six Months 2025 tax credit and higher depreciation expense. | ||||
Income (loss) from unconsolidated investments
| Six Months 2026 | Six Months 2025 | Dollar Change | Percent Change | ||||||||||||||||||||
| (in millions) | |||||||||||||||||||||||
| Net gain in connection with Exchangeable Shares | $ | — | $ | 83.3 | $ | (83.3) | NM | ||||||||||||||||
Equity in earnings (losses) from equity method investees | (0.5) | 2.1 | (2.6) | (124 | %) | ||||||||||||||||||
| Impairment of equity method investments | (1.5) | (2.1) | 0.6 | 29 | % | ||||||||||||||||||
| Unrealized net gain (loss) on securities measured at fair value | (5.0) | (2.5) | (2.5) | (100 | %) | ||||||||||||||||||
Income (loss) from unconsolidated investments | $ | (7.0) | $ | 80.8 | $ | (87.8) | (109 | %) | |||||||||||||||
Interest expense, net
Interest expense, net decreased to $186.5 million for Six Months 2026 as compared to $206.8 million for Six Months 2025. This decrease of $20.3 million, or 10%, is due to approximately $745 million of lower average borrowings and approximately 5 basis points of lower weighted average interest rates. For additional information, refer to Note 11.
| Constellation Brands, Inc. Q2 FY 2026 Form 10-Q | #WORTHREACHINGFOR I 44 | ||||
(Provision for) benefit from income taxes
The (provision for) benefit from income taxes increased to $(384.4) million for Six Months 2026 from $124.2 million for Six Months 2025. Our effective tax rate for Six Months 2026 was 27.6% as compared with 30.0% for Six Months 2025. In comparison to prior year, our effective tax rate was largely impacted by:
•net income tax impacts resulting from (i) changes to valuation allowances related to net operating losses and tax legislation updates and (ii) effective tax rates applicable for foreign businesses; partially offset by
•net income tax impacts resulting from the (i) Six Months 2025 non-deductible portion of the Wine and Spirits goodwill impairment and (ii) Six Months 2025 sale of the remaining assets at the canceled Mexicali Brewery.
We now expect our reported effective tax rate for Fiscal 2026 to be in the range of 17% to 19%, inclusive of (i) our initial evaluation of the OB3 Act and (ii) Pillar Two. We will continue to assess the implications of the OB3 Act and Pillar Two. As it relates to the OB3 Act, our income tax provision may continue to be impacted as additional clarifications or interpretive guidance related to the OB3 Act is released.
For additional information, refer to Note 12.
Net income (loss) attributable to CBI
Net income (loss) attributable to CBI increased to $982.1 million for Six Months 2026 from $(322.0) million for Six Months 2025. This increase of $1,304.1 million, or 405%, is largely attributable to the Six Months 2025 Wine and Spirits goodwill impairment, partially offset by the (i) Six Months 2026 provision for income taxes as compared to a benefit from income taxes for Six Months 2025, (ii) net sales declines in both the Wine and Spirits and Beer segments, (iii) Six Months 2025 net gain in connection with Exchangeable Shares, and (iv) Six Months 2026 asset impairment and related expenses.
LIQUIDITY AND CAPITAL RESOURCES
General
Our primary source of liquidity has been cash flow from operating activities. Our ability to consistently generate robust cash flow from our operations is one of our most significant financial strengths. It enables us to invest in our people and our brands, make capital investments and strategic acquisitions, provide a cash dividend program, and repurchase shares of our common stock. Our largest use of cash in our operations is for purchasing and carrying inventories and carrying seasonal accounts receivable. Historically, we have used this cash flow to repay our short-term borrowings and fund capital expenditures. Additionally, our commercial paper program is used to fund our short-term borrowing requirements and to maintain our access to the capital markets. We use our short-term borrowings, including our commercial paper program, to support our working capital requirements and capital expenditures, among other things.
We seek to maintain adequate liquidity to meet working capital requirements, fund capital expenditures, and repay scheduled principal and interest payments on debt. Absent deterioration of market conditions, we believe that cash flows from operating and financing activities will provide adequate resources to satisfy our working capital, scheduled principal and interest payments on debt, anticipated dividend payments, periodic share repurchases, and planned capital expenditure requirements for both our short-term and long-term capital needs.
We have an agreement with a financial institution for payment services and to facilitate a voluntary supply chain finance program through this participating financial institution. The program is available to certain of our suppliers allowing them the option to manage their cash flow. We are not a party to the agreements between the participating financial institution and the suppliers in connection with the program. Our rights and obligations to our suppliers, including amounts due and scheduled payment terms, are not impacted. As of August 31, 2025, and February 28,
| Constellation Brands, Inc. Q2 FY 2026 Form 10-Q | #WORTHREACHINGFOR I 45 | ||||
2025, the amount payable to this participating financial institution for suppliers who voluntarily participate in the supply chain finance program was $50.7 million and $39.4 million, respectively, and was included in accounts payable within our consolidated balance sheets. We account for payments made under the supply chain finance program the same as our other accounts payable, as a reduction to our cash flow from operating activities.
Cash Flows
| Six Months 2026 | Six Months 2025 | Dollar Change | |||||||||||||||
| (in millions) | |||||||||||||||||
| Net cash provided by (used in): | |||||||||||||||||
| Operating activities | $ | 1,489.3 | $ | 1,872.3 | $ | (383.0) | |||||||||||
| Investing activities | 464.8 | (857.6) | 1,322.4 | ||||||||||||||
| Financing activities | (1,953.1) | (1,104.0) | (849.1) | ||||||||||||||
| Effect of exchange rate changes on cash and cash equivalents | 2.9 | 1.5 | 1.4 | ||||||||||||||
| Net increase (decrease) in cash and cash equivalents | $ | 3.9 | $ | (87.8) | $ | 91.7 | |||||||||||
Operating activities
The decrease in net cash provided by (used in) operating activities consists of:
| Six Months 2026 | Six Months 2025 | Dollar Change | |||||||||||||||
| (in millions) | |||||||||||||||||
| Net income (loss) | $ | 1,009.9 | $ | (289.6) | $ | 1,299.5 | |||||||||||
| Deferred tax provision (benefit) | 277.6 | (178.5) | 456.1 | ||||||||||||||
Asset impairment and related expenses | 52.1 | — | 52.1 | ||||||||||||||
| Net gain in connection with Exchangeable Shares | — | (83.3) | 83.3 | ||||||||||||||
| Goodwill impairment | — | 2,250.0 | (2,250.0) | ||||||||||||||
| Other non-cash adjustments | 237.0 | 188.5 | 48.5 | ||||||||||||||
| Change in operating assets and liabilities, net of effects from purchase and sale of business | (87.3) | (14.8) | (72.5) | ||||||||||||||
| Net cash provided by (used in) operating activities | $ | 1,489.3 | $ | 1,872.3 | $ | (383.0) | |||||||||||
The $72.5 million net change in operating assets and liabilities was largely driven by higher accounts receivable for the Beer segment as a result of timing of collections, as well as lower (i) contract liabilities in connection with distribution arrangements for our U.S. wine and spirits brand portfolio following the completion of the 2025 Wine Divestitures and (ii) accounts payable for both the Beer and Wine and Spirits segments, driven by the timing of purchases and lower purchasing activity following the Wine and Spirits Divestitures, respectively. These changes were partially offset by lower accounts receivables for the Wine and Spirits segment due to lower net sales, reflecting the impact of the Wine and Spirits Divestitures. Additionally, net cash provided by operating activities was positively impacted by lower Six Months 2026 income tax payments as compared to Six Months 2025 following the resolution of various tax examinations and assessments.
Investing activities
Net cash provided by (used in) investing activities increased to $464.8 million for Six Months 2026 from $(857.6) million for Six Months 2025. This increase of $1,322.4 million, or 154%, was primarily due to (i) $851.1 million higher proceeds from sale of business, driven by the 2025 Wine Divestitures, (ii) $293.0 million reduced capital expenditures for Six Months 2026 as compared to Six Months 2025, and (iii) $158.3 million reduced business acquisition activity for Six Months 2026, driven by the June 2024 acquisition of the Sea Smoke wine business.
| Constellation Brands, Inc. Q2 FY 2026 Form 10-Q | #WORTHREACHINGFOR I 46 | ||||
Financing activities
The increase in net cash used in financing activities consisted of:
| Six Months 2026 | Six Months 2025 | Dollar Change | |||||||||||||||
| (in millions) | |||||||||||||||||
| Net proceeds from (payments of) debt, current and long-term, and related activities | $ | (962.6) | $ | (287.6) | $ | (675.0) | |||||||||||
| Dividends paid | (361.1) | (368.6) | 7.5 | ||||||||||||||
| Purchases of treasury stock | (604.0) | (449.2) | (154.8) | ||||||||||||||
Net cash provided by (used in) stock-based compensation activities | (6.4) | 34.6 | (41.0) | ||||||||||||||
| Distributions to noncontrolling interests | (17.5) | (32.5) | 15.0 | ||||||||||||||
| Payment of contingent consideration | (1.5) | (0.7) | (0.8) | ||||||||||||||
| Net cash provided by (used in) financing activities | $ | (1,953.1) | $ | (1,104.0) | $ | (849.1) | |||||||||||
Debt
Total debt outstanding as of August 31, 2025, amounted to $10,544.9 million, a decrease of $952.8 million, or 8%, from February 28, 2025. This decrease consisted of:
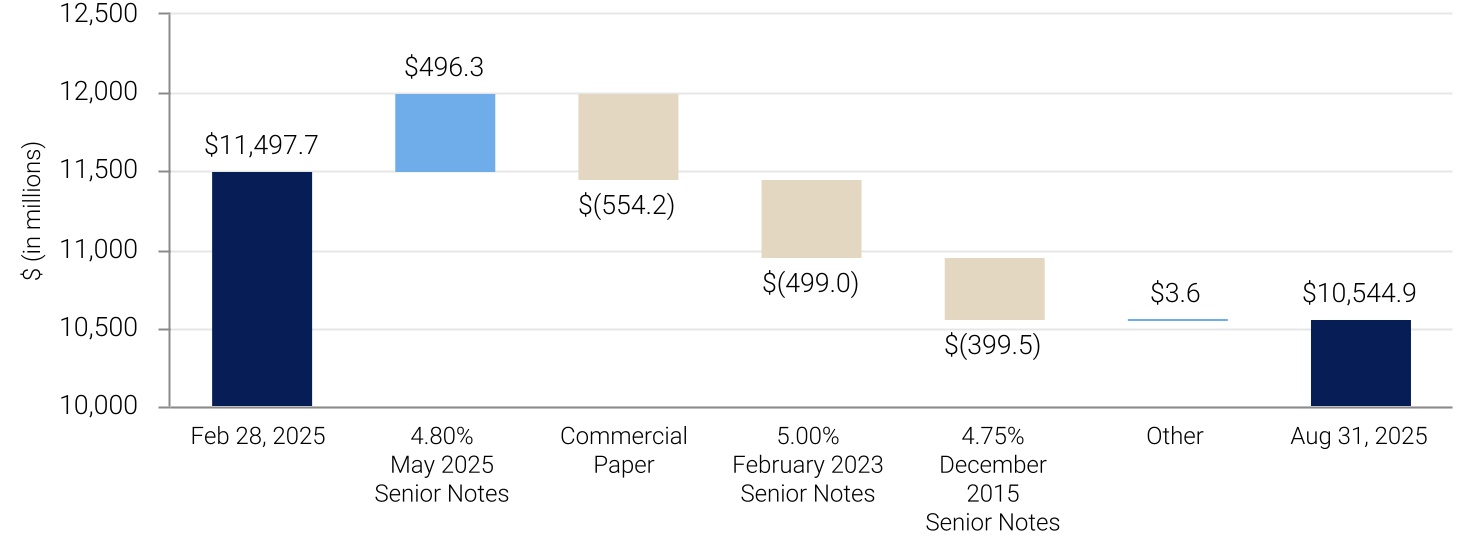
| Debt repayment | Debt issuance | ||||||||||||||||
Bank facilities
In May 2025, we entered into the 2025 Term Credit Agreement, which provides for a six-month delayed draw $500.0 million term loan facility, available in up to two draws. The balance is due and payable two years after the initial funding date, if any, occurs. There are no borrowings outstanding under the 2025 Term Credit Agreement.
In April 2025, we entered into the 2025 Restatement Agreement that amended and restated our then-existing senior credit facility. The 2025 Restatement Agreement resulted in (i) refinancing the existing $2.25 billion revolving credit facility, (ii) extending its maturity to April 28, 2030, and (iii) refining certain negative covenants. There are no borrowings outstanding under the 2025 Credit Agreement.
Senior notes
On July 2, 2025, we repaid the 4.75% December 2015 Senior Notes using proceeds from the 2025 Wine Divestitures and cash on hand. On June 12, 2025, we repaid the 5.00% February 2023 Senior Notes using proceeds from the 2025
| Constellation Brands, Inc. Q2 FY 2026 Form 10-Q | #WORTHREACHINGFOR I 47 | ||||
Wine Divestitures. Each of these notes were redeemed prior to maturity at a redemption price equal to 100% of the outstanding principal amount plus accrued and unpaid interest.
In May 2025, we issued the 4.80% May 2025 Senior Notes. Proceeds from this offering, net of discount and debt issuance costs, of $496.0 million were used for general corporate purposes, including repayment of commercial paper and other indebtedness, working capital, funding capital expenditures, and other business opportunities.
General
The majority of our outstanding borrowings as of August 31, 2025, consisted of fixed-rate senior unsecured notes, with maturities ranging from calendar 2025 to calendar 2050.
Additionally, we have a commercial paper program which provides for the issuance of up to an aggregate principal amount of $2.25 billion of commercial paper. Our commercial paper program is backed by unused commitments under our revolving credit facility under our 2025 Credit Agreement. Accordingly, outstanding borrowings under our commercial paper program reduce the amount available under our revolving credit facility.
We do not have purchase commitments from buyers for our commercial paper and, therefore, our ability to issue commercial paper is subject to market demand. If the commercial paper market is not available to us for any reason when commercial paper borrowings mature, we expect to utilize unused commitments under our revolving credit facility under our 2025 Credit Agreement to repay commercial paper borrowings. We do not expect that fluctuations in demand for commercial paper will affect our liquidity given our borrowing capacity available under our revolving credit facility.
We had the following remaining borrowing capacity available under our 2025 Credit Agreement:
| August 31, 2025 | September 30, 2025 | ||||||||||
| (in millions) | |||||||||||
Revolving credit facility (1) | $ | 1,986.0 | $ | 2,144.2 | |||||||
(1)Net of outstanding revolving credit facility borrowings and outstanding letters of credit under our 2025 Credit Agreement and outstanding borrowings under our commercial paper program (excluding unamortized discount) of $252.7 million and $94.5 million as of August 31, 2025, and September 30, 2025, respectively.
The financial institutions participating in our 2025 Credit Agreement have complied with prior funding requests and we believe they will comply with any future funding requests. However, there can be no assurances that any particular financial institution will continue to do so.
As of August 31, 2025, we and our subsidiaries were subject to covenants that are contained in our 2025 Credit Agreement and the 2025 Term Credit Agreement, including those restricting the incurrence of additional subsidiary indebtedness, additional liens, mergers and consolidations, transactions with affiliates, and sale and leaseback transactions, in each case subject to numerous conditions, exceptions, and thresholds. The financial covenants are limited to a minimum interest coverage ratio and a maximum net leverage ratio, both as defined in our 2025 Credit Agreement. As of August 31, 2025, under our 2025 Credit Agreement, the minimum interest coverage ratio was 2.5x and the maximum net leverage ratio was 4.0x.
The representations, warranties, covenants, and events of default set forth in our 2025 Term Credit Agreement are substantially similar to those set forth in our 2025 Credit Agreement.
Our indentures relating to our outstanding senior notes contain certain covenants, including, but not limited to: (i) a limitation on liens on certain assets, (ii) a limitation on certain sale and leaseback transactions, and (iii) restrictions on mergers, consolidations, and the transfer of all or substantially all of our assets to another person.
| Constellation Brands, Inc. Q2 FY 2026 Form 10-Q | #WORTHREACHINGFOR I 48 | ||||
As of August 31, 2025, we were in compliance with our covenants under our 2025 Credit Agreement and our indentures, and have met all debt payment obligations.
For further discussion and presentation of our borrowings and available sources of borrowing, refer to Note 12 of our consolidated financial statements included in our 2025 Annual Report and Note 11.
Common Stock Dividends
On September 30, 2025, our Board of Directors declared a quarterly cash dividend of $1.02 per share of Class A Stock and $0.92 per share of Class 1 Stock payable on November 13, 2025, to stockholders of record of each class as of the close of business on October 30, 2025.
We currently expect to continue to pay a regular quarterly cash dividend to stockholders of our common stock in the future, but such payments are subject to approval of our Board of Directors and are dependent upon our financial condition, results of operations, capital requirements, and other factors, including those set forth under Item 1A. “Risk Factors” of our 2025 Annual Report.
Share Repurchase Program
Our Board of Directors authorized the repurchase of our publicly traded common stock of up to $4.0 billion under the 2025 Authorization which expires in February 2028. As of August 31, 2025, total shares repurchased are as follows:
| Class A Stock | |||||||||||||||||
| Repurchase Authorization | Dollar Value of Shares Repurchased | Number of Shares Repurchased | |||||||||||||||
| (in millions, except share data) | |||||||||||||||||
2025 Authorization (1) | $ | 4,000.0 | $ | 604.0 | 3,375,602 | ||||||||||||
(1)As of August 31, 2025, $3,396.0 million remains available for future share repurchases, excluding the impact of Federal excise tax owed pursuant to the IRA.
Share repurchases under the 2025 Authorization may be accomplished at management’s discretion from time to time based on market conditions, our cash and debt position, and other factors as determined by management. Shares may be repurchased through open market or privately negotiated transactions. We may fund future share repurchases with cash generated from operations, proceeds from borrowings, and/or divestiture proceeds. Any repurchased shares will become treasury shares, including shares previously repurchased under the 2025 Authorization.
We currently expect to return $4.0 billion in share repurchases to stockholders from Fiscal 2026 through Fiscal 2028, but such repurchases are dependent upon our financial condition, results of operations, capital requirements, and other factors, including those set forth under Item 1A. “Risk Factors” of our 2025 Annual Report.
For additional information, refer to Note 17 of our consolidated financial statements included in our 2025 Annual Report and Note 13.
Accounting Guidance
Accounting guidance adopted for Six Months 2026 did not have a material impact on our Financial Statements.
| Constellation Brands, Inc. Q2 FY 2026 Form 10-Q | #WORTHREACHINGFOR I 49 | ||||
INFORMATION REGARDING FORWARD-LOOKING STATEMENTS
This Form 10-Q contains “forward-looking statements” within the meaning of Section 27A of the Securities Act and Section 21E of the Exchange Act. These forward-looking statements are subject to a number of risks and uncertainties, many of which are beyond our control, which could cause actual results to differ materially from those set forth in, or implied by, such forward-looking statements. All statements other than statements of historical fact included in this Form 10-Q are forward-looking statements, including without limitation:
•The statements under MD&A regarding:
◦our business strategy, including our strategic vision, growth plans, digital acceleration initiatives, Beer segment focus on upholding our leadership position in the U.S. beer market, and Wine and Spirits segment focus on delivering growth and improving margins beyond Fiscal 2026;
◦our beer expansion, optimization, and/or construction activities, including anticipated scope, capacity, costs, capital expenditures, and timeframes for completion;
◦our innovation, marketing, sales, and distribution plans, activities, and strategies;
◦our long-term financial model, target comparable net leverage and target dividend payout ratios, future operations, financial condition and position, net sales, expenses including potential future impairment losses, hedging programs, cost savings, restructuring, and efficiency initiatives, including the 2025 Restructuring Initiative, capital expenditures, effective tax rates, anticipated tax liabilities, and potential impacts to our income tax provision, expected volume, inventory, supply and demand levels, balance, cadence, and trends, access to capital markets, liquidity and capital resources, including our ability to consistently generate robust cash flow and raise or repay debt, and prospects, plans, and objectives of management;
◦the evolving consumer demand environment and trends, ongoing socioeconomic factors, including subdued spend, depressed sentiment, value-seeking behaviors, and reductions in the discretionary income, elevated unemployment, changing prices, inflation, other unfavorable global and regional economic conditions, demographic trends in the U.S., global supply chain disruptions and constraints, and geopolitical events, including the impact of military conflicts, and our responses thereto;
◦recent and potential future changes to trade and tariff policies, particularly on imports from Mexico, the European Union including Italy, and New Zealand into the U.S. and retaliatory tariffs and other responses imposed on certain product imports originating from the U.S.;
◦expected or potential actions of third parties, including possible changes to laws, rules, and regulations;
◦the potential impact of severe weather events or other weather conditions;
◦the manner, timing, and duration of the share repurchase program and source of funds for share repurchases; and
◦the amount and timing of future dividends.
•The statements regarding the future reclassification of net gains from AOCI, potential future impairments of our Canopy investment, potential continued impacts from the OB3 Act on our effective tax rate and and our income tax provision, including from additional clarifications or interpretive guidance related to the OB3 Act, potential impacts from Pillar Two, and our aim to hedge 100% of our balance sheet exposures.
When used in this Form 10-Q, the words “anticipate,” “expect,” “intend,” “will,” and similar expressions are intended to identify forward-looking statements, although not all forward-looking statements contain such identifying words. All forward-looking statements speak only as of the date of this Form 10-Q. We undertake no obligation to update or revise any forward-looking statements, whether as a result of new information, future events, or otherwise. Although we believe that the expectations reflected in the forward-looking statements are reasonable, we can give no assurance that such expectations will prove to be correct. In addition to the risks and uncertainties of ordinary business operations and conditions in the general economy and markets in which we compete, our forward-looking statements contained in this Form 10-Q are also subject to the risk, uncertainty, and possible variance from our current expectations regarding:
| Constellation Brands, Inc. Q2 FY 2026 Form 10-Q | #WORTHREACHINGFOR I 50 | ||||
•potential further declines in the consumption of products we sell and our dependence on sales of our Mexican beer brands;
•impacts of our acquisition, divestiture, investment, and new product development strategies and activities, including the 2025 Wine Divestitures;
•dependence upon our trademarks and proprietary rights, including the failure to protect our intellectual property rights;
•potential damage to our reputation;
•competition in our industry and for talent;
•economic and other uncertainties associated with our international operations, including new or increased tariffs;
•water, agricultural and other raw material, and packaging material supply, production, and/or transportation difficulties, disruptions, and impacts, including limited groups of certain suppliers;
•reliance on complex information systems and third‐party global networks, including internal control over financial reporting changes in connection with our OneStream consolidation system implementation, as well as risks associated with cybersecurity and artificial intelligence;
•dependence on limited facilities for production of our Mexican beer brands, including beer operations expansion, optimization, and/or construction activities, scope, capacity, supply, costs (including potential impairments), capital expenditures, and timing;
•operational disruptions or catastrophic loss to our breweries, wineries, other production facilities, or distribution systems;
•severe weather, natural and man-made disasters, climate change, environmental sustainability and CSR-related regulatory compliance, and failure to meet environmental sustainability and CSR targets, commitments, and aspirations;
•the success of our cost savings, restructuring, and efficiency initiatives, including changes in key personnel responsible for oversight of our internal control over financial reporting in connection with the 2025 Restructuring Initiative;
•reliance on wholesale distributors, major retailers, and government agencies;
•contamination and degradation of product quality from diseases, pests, weather, and other conditions;
•communicable infection or disease outbreaks, pandemics, or other widespread public health crises impacting our consumers, employees, distributors, retailers, and/or suppliers;
•effects of employee labor activities that could increase our costs;
•our indebtedness and interest rate fluctuations;
•our international operations, worldwide and regional economic trends and financial market conditions, geopolitical uncertainty, including the impact of military conflicts, other governmental rules and regulations, and the U.S. federal government shutdown;
•class action or other litigation we face or may face, including relating to alleged securities law violations, abuse or misuse of our products, product liability, marketing or sales practices, including product labeling, or other matters;
•potential impairments of our intangible assets, such as goodwill and trademarks;
•changes to tax laws, fluctuations in our effective tax rate, accounting for tax positions, the resolution of tax disputes, changes to accounting standards, elections, assertions, or policies, and the potential impact of a global minimum tax rate;
•uncertainties related to future cash dividends and share repurchases, which may affect the price of our common stock;
•ownership of our Class A Stock by certain individuals and entities affiliated with the Sands family and their Board of Director nomination rights; and
•the choice-of-forum provision in our amended and restated by-laws regarding certain stockholder litigation.
For additional information about risks and uncertainties that could cause actual results to differ materially from those set forth in or implied by our forward-looking statements contained in the Form 10-Q, please refer to Item 1A. “Risk Factors” of our 2025 Annual Report.
| Constellation Brands, Inc. Q2 FY 2026 Form 10-Q | #WORTHREACHINGFOR I 51 | ||||
| OTHER KEY INFORMATION | |||||
ITEM 3. QUANTITATIVE AND QUALITATIVE DISCLOSURES ABOUT MARKET RISK.
As a result of our global operating, investment, acquisition, divestiture, and financing activities, we are exposed to market risk associated with changes in foreign currency exchange rates, commodity prices, and interest rates. These risks may be influenced by, among other factors, trade policies, tariffs, and foreign or domestic legal and regulatory requirements. To manage the volatility relating to these risks, we periodically purchase and/or sell derivative instruments including foreign currency forward and option contracts, commodity swap contracts, cross-currency swap contracts, interest rate swap contracts, and Pre-issuance hedge contracts. We use derivative instruments to reduce earnings and cash flow volatility resulting from shifts in market rates, as well as to hedge economic exposures. We do not enter into derivative instruments for trading or speculative purposes.
Foreign currency and commodity price risk
Foreign currency derivative instruments are or may be used to hedge existing foreign currency denominated assets and liabilities, forecasted foreign currency denominated sales/purchases to/from third parties as well as intercompany sales/purchases, intercompany principal and interest payments, and in connection with investments, acquisitions, or divestitures outside the U.S. As of August 31, 2025, we had exposures to foreign currency risk primarily related to the Mexican peso, Canadian dollar, New Zealand dollar, and euro. We aim to hedge 100% of our balance sheet exposures. As of August 31, 2025, 83% of our forecasted transactional exposures for the remaining six months of Fiscal 2026 were hedged.
Commodity derivative instruments are or may be used to hedge forecasted commodity purchases from third parties as either economic hedges or accounting hedges. As of August 31, 2025, exposures to commodity price risk which we are currently hedging include aluminum, corn, diesel fuel, and natural gas prices. Approximately 82% of our forecasted transactional exposures for the remaining six months of Fiscal 2026 were hedged as of August 31, 2025.
We have performed a sensitivity analysis to estimate our exposure to market risk of foreign exchange rates and commodity prices reflecting the impact of a hypothetical 10% adverse change in the applicable market. The volatility of the applicable rates and prices is dependent on many factors which cannot be forecasted with reliable accuracy. Gains or losses from the revaluation or settlement of the related underlying positions would substantially offset such gains or losses on the derivative instruments. The aggregate notional value, estimated fair value, and sensitivity analysis for our open foreign currency and commodity derivative instruments are summarized as follows:
| Aggregate Notional Value | Fair Value, Net Asset (Liability) | Increase (Decrease) in Fair Value – Hypothetical 10% Adverse Change | |||||||||||||||||||||||||||||||||
| August 31, 2025 | August 31, 2024 | August 31, 2025 | August 31, 2024 | August 31, 2025 | August 31, 2024 | ||||||||||||||||||||||||||||||
| (in millions) | |||||||||||||||||||||||||||||||||||
| Foreign currency contracts | $ | 3,263.8 | $ | 3,604.0 | $ | 216.6 | $ | 53.3 | $ | (192.2) | $ | (198.6) | |||||||||||||||||||||||
| Commodity derivative contracts | $ | 327.1 | $ | 342.8 | $ | (1.2) | $ | (23.9) | $ | 29.1 | $ | 28.1 | |||||||||||||||||||||||
Net investment hedge contracts | $ | 145.5 | $ | — | $ | (5.6) | $ | — | $ | 14.3 | $ | — | |||||||||||||||||||||||
Interest rate risk
The estimated fair value of our fixed interest rate debt is subject to interest rate risk, credit risk, and foreign currency risk. In addition, we also have variable interest rate debt outstanding (primarily SOFR-based), certain of which includes a fixed margin subject to the same risks identified for our fixed interest rate debt.
There were no cash flow designated or undesignated interest rate swap contracts or Pre-issuance hedge contracts outstanding as of August 31, 2025, or August 31, 2024.
| Constellation Brands, Inc. Q2 FY 2026 Form 10-Q | #WORTHREACHINGFOR I 52 | ||||
| OTHER KEY INFORMATION | |||||
We have performed a sensitivity analysis to estimate our exposure to market risk of interest rates reflecting the impact of a hypothetical 1% increase in the prevailing interest rates. The volatility of the applicable rates is dependent on many factors which cannot be forecasted with reliable accuracy.
The aggregate notional value, estimated fair value, and sensitivity analysis for our outstanding fixed-rate debt, including current maturities, are summarized as follows:
| Aggregate Notional Value | Fair Value, Net Asset (Liability) | Increase (Decrease) in Fair Value – Hypothetical 1% Rate Increase | |||||||||||||||||||||||||||||||||
| August 31, 2025 | August 31, 2024 | August 31, 2025 | August 31, 2024 | August 31, 2025 | August 31, 2024 | ||||||||||||||||||||||||||||||
| (in millions) | |||||||||||||||||||||||||||||||||||
| Fixed interest rate debt | $ | 10,357.3 | $ | 11,161.8 | $ | (9,677.9) | $ | (10,516.2) | $ | (510.1) | $ | (591.9) | |||||||||||||||||||||||
A 1% hypothetical change in the prevailing interest rates would have increased interest expense on our variable interest rate debt by $2.0 million and $2.6 million for the six months ended August 31, 2025, and August 31, 2024, respectively.
For additional discussion on our market risk, refer to Notes 6 and 7.
ITEM 4. CONTROLS AND PROCEDURES.
Disclosure controls and procedures
Our Chief Executive Officer and our Chief Financial Officer have concluded, based on their evaluation as of the end of the period covered by this report, that the Company’s “disclosure controls and procedures” (as defined in the Exchange Act Rules 13a-15(e) and 15d-15(e)) are effective to ensure that information required to be disclosed in the reports that we file or submit under the Exchange Act (i) is recorded, processed, summarized, and reported within the time periods specified in the SEC’s rules and forms, and (ii) is accumulated and communicated to our management, including our Chief Executive Officer and our Chief Financial Officer, as appropriate to allow timely decisions regarding required disclosure.
Internal control over financial reporting
In connection with the foregoing evaluation by our Chief Executive Officer and our Chief Financial Officer, no changes were identified in the Company’s “internal control over financial reporting” (as defined in the Exchange Act Rules 13a-15(f) and 15d-15(f)) that occurred during our fiscal quarter ended August 31, 2025, that have materially affected, or are reasonably likely to materially affect, our internal control over financial reporting.
| Constellation Brands, Inc. Q2 FY 2026 Form 10-Q | #WORTHREACHINGFOR I 53 | ||||
| OTHER KEY INFORMATION | |||||
PART II – OTHER INFORMATION
ITEM 1. LEGAL PROCEEDINGS.
On February 18, 2025, a purported stockholder of the Company filed a putative class action in the United States District Court for the Western District of New York captioned Meza v. Constellation Brands, Inc., et al., Case No. 6:25-cv-6107 (W.D.N.Y.). The complaint names as defendants the Company, our President and Chief Executive Officer, and our Executive Vice President and Chief Financial Officer, and asserts claims for alleged violations of Sections 10(b) and 20(a) of the Exchange Act and Rule 10b-5 promulgated thereunder arising from allegedly materially false or misleading statements or omissions of purportedly material fact concerning, among other things, the Company’s strategies intended to improve the performance of our wine and spirits business. On July 17, 2025, an amended complaint was filed in the Meza litigation. The amended complaint asserts the same causes of action against the same defendants, but alleges materially false or misleading statements or omissions of purportedly material fact concerning, among other things, the prospects of our beer business. There are no allegations in the amended complaint regarding our wine and spirits business. The amended complaint seeks, among other relief, alleged damages in an unspecified amount, attorneys’ fees, and costs. On September 17, 2025, the Company and the other defendants filed a motion to dismiss the amended complaint, which motion remains pending.
On March 24, 2025, a purported stockholder of the Company filed a complaint in the United States District Court for the Western District of New York captioned Silva v. Newlands, et al., Case No. 1:25-cv-254 (W.D.N.Y.); on April 21, 2025, a second purported stockholder of the Company filed a complaint in the United States District Court for the Western District of New York captioned Mason v. Newlands, et al., Case No. 1:25-cv-00353 (W.D.N.Y.); and on June 24, 2025, a third purported stockholder of the Company filed a complaint in the United States District Court for the District of Delaware captioned Wasserman v. Baldwin, et al., Case No. 1:25-cv-779 (D. Del.). These derivative complaints each seek to assert claims arising under the Exchange Act and state common law, derivatively on behalf of the Company, against current and former directors and officers of the Company. None of the plaintiffs made a pre-suit demand on our Board of Directors, instead each alleging that the pre-suit demand requirement should be excused as purportedly futile. The claims asserted in these derivative complaints arise from substantially the same allegations made in the Meza complaint. On May 27, 2025, the United States District Court for the Western District of New York entered an order consolidating the Silva and Mason litigations and staying proceedings pending the entry of a final judgment in Meza. On August 8, 2025, the plaintiff in the Wasserman litigation filed a notice and proposed order voluntarily dismissing that litigation, which was so ordered by the United States District Court for the District of Delaware on August 14, 2025.
| Constellation Brands, Inc. Q2 FY 2026 Form 10-Q | #WORTHREACHINGFOR I 54 | ||||
| OTHER KEY INFORMATION | |||||
ITEM 2. UNREGISTERED SALES OF EQUITY SECURITIES AND USE OF PROCEEDS.
Issuer Purchases of Equity Securities
| Period | Total Number of Shares Purchased | Average Price Paid Per Share | Total Number of Shares Purchased as Part of a Publicly Announced Program | Approximate Dollar Value of Shares that May Yet Be Purchased Under the Program (1) | ||||||||||||||||||||||
| (in millions, except share and per share data) | ||||||||||||||||||||||||||
June 1 – 30, 2025 | 431,578 | $ | 173.78 | 431,578 | $ | 3,618.9 | ||||||||||||||||||||
July 1 – 31, 2025 | 931,314 | $ | 170.68 | 931,314 | $ | 3,460.0 | ||||||||||||||||||||
August 1 – 31, 2025 | 377,992 | $ | 169.31 | 377,992 | $ | 3,396.0 | ||||||||||||||||||||
| Total | 1,740,884 | $ | 171.15 | 1,740,884 | ||||||||||||||||||||||
(1)In April 2025, we announced that our Board of Directors authorized the repurchase of up to $4.0 billion of our publicly traded common stock under the 2025 Authorization. The 2025 Authorization expires on February 29, 2028. Share repurchases for the periods included herein were effected through open market transactions and exclude the impact of Federal excise tax owed pursuant to the IRA.
ITEM 5. OTHER INFORMATION.
10b5-1 Trading Plans
During the three months ended August 31, 2025, none of our directors or officers (as defined in Exchange Act Rule 16a-1(f)) adopted terminated
ITEM 6. EXHIBITS.
| INCORPORATED BY REFERENCE | ||||||||||||||||||||
EXHIBIT NO. | EXHIBIT DESCRIPTION | FORM | EXHIBIT | FILING DATE | ||||||||||||||||
| 3.1 | 8-K | 3.1 | November 10, 2022 | |||||||||||||||||
| 3.2 | 8-K | 3.1 | October 2, 2025 | |||||||||||||||||
| 4.1 | 8-K | 4.1 | April 23, 2012 | |||||||||||||||||
4.1.1 | 10-K | 4.26 | April 25, 2016 | |||||||||||||||||
4.1.2 | 8-K | 4.1 | December 6, 2016 | |||||||||||||||||
| Constellation Brands, Inc. Q2 FY 2026 Form 10-Q | #WORTHREACHINGFOR I 55 | ||||
| OTHER KEY INFORMATION | |||||
| INCORPORATED BY REFERENCE | ||||||||||||||||||||
EXHIBIT NO. | EXHIBIT DESCRIPTION | FORM | EXHIBIT | FILING DATE | ||||||||||||||||
4.1.3 | 8-K | 4.2 | May 9, 2017 | |||||||||||||||||
4.1.4 | 8-K | 4.3 | May 9, 2017 | |||||||||||||||||
4.1.5 | 8-K | 4.2 | February 7, 2018 | |||||||||||||||||
4.1.6 | 8-K | 4.3 | February 7, 2018 | |||||||||||||||||
4.1.7 | 8-K | 4.2 | October 29, 2018 | |||||||||||||||||
4.1.8 | 8-K | 4.3 | October 29, 2018 | |||||||||||||||||
4.1.9 | 8-K | 4.4 | October 29, 2018 | |||||||||||||||||
4.1.10 | 8-K | 4.1 | July 29, 2019 | |||||||||||||||||
4.1.11 | 8-K | 4.1 | April 27, 2020 | |||||||||||||||||
4.1.12 | 8-K | 4.2 | April 27, 2020 | |||||||||||||||||
4.1.13 | 8-K | 4.1 | July 26, 2021 | |||||||||||||||||
4.1.14 | 8-K | 4.2 | May 9, 2022 | |||||||||||||||||
4.1.15 | 8-K | 4.3 | May 9, 2022 | |||||||||||||||||
4.1.16 | 8-K | 4.1 | May 1, 2023 | |||||||||||||||||
| Constellation Brands, Inc. Q2 FY 2026 Form 10-Q | #WORTHREACHINGFOR I 56 | ||||
| OTHER KEY INFORMATION | |||||
| INCORPORATED BY REFERENCE | ||||||||||||||||||||
EXHIBIT NO. | EXHIBIT DESCRIPTION | FORM | EXHIBIT | FILING DATE | ||||||||||||||||
4.1.17 | 8-K | 4.1 | January 11, 2024 | |||||||||||||||||
4.1.18 | 8-K | 4.1 | May 1, 2025 | |||||||||||||||||
| 4.2 | 8-K | 4.1 | April 28, 2025 | |||||||||||||||||
| 4.3 | 8-K | 4.1 | May 9, 2025 | |||||||||||||||||
| 10.1 | 8-K | 10.1 | July 17, 2025 | |||||||||||||||||
| 10.2 | 8-K | 10.2 | July 17, 2025 | |||||||||||||||||
| 10.3 | ||||||||||||||||||||
| 31.1 | ||||||||||||||||||||
| 31.2 | ||||||||||||||||||||
| 32.1 | ||||||||||||||||||||
| 32.2 | ||||||||||||||||||||
| 101.INS | XBRL Instance Document - the instance document does not appear in the Interactive Data File because its XBRL tags are embedded within the Inline XBRL document (filed herewith). | |||||||||||||||||||
| 101.SCH | XBRL Taxonomy Extension Schema Document (filed herewith). | |||||||||||||||||||
| 101.CAL | XBRL Taxonomy Extension Calculation Linkbase Document (filed herewith). | |||||||||||||||||||
| 101.DEF | XBRL Taxonomy Extension Definition Linkbase Document (filed herewith). | |||||||||||||||||||
| 101.LAB | XBRL Taxonomy Extension Labels Linkbase Document (filed herewith). | |||||||||||||||||||
| Constellation Brands, Inc. Q2 FY 2026 Form 10-Q | #WORTHREACHINGFOR I 57 | ||||
| OTHER KEY INFORMATION | |||||
| INCORPORATED BY REFERENCE | ||||||||||||||||||||
EXHIBIT NO. | EXHIBIT DESCRIPTION | FORM | EXHIBIT | FILING DATE | ||||||||||||||||
| 101.PRE | XBRL Taxonomy Extension Presentation Linkbase Document (filed herewith). | |||||||||||||||||||
| 104 | Cover Page Interactive Data File (formatted as Inline XBRL and contained in Exhibit 101). | |||||||||||||||||||
| * | Designates management contract or compensatory plan or arrangement. | ||||
| † | The exhibits, disclosure schedules, and other schedules, as applicable, have been omitted pursuant to Item 601(a)(5) of Regulation S-K. The Company agrees to furnish supplementally a copy of such exhibits, disclosure schedules, and other schedules, as applicable, or any section thereof, to the SEC upon request. | ||||
The Company agrees, upon request of the SEC, to furnish copies of each instrument that defines the rights of holders of long-term debt of the Company or its subsidiaries that is not filed herewith pursuant to Item 601(b)(4)(iii)(A) because the total amount of long-term debt authorized under such instrument does not exceed 10% of the total assets of the Company and its subsidiaries on a consolidated basis.
| Constellation Brands, Inc. Q2 FY 2026 Form 10-Q | #WORTHREACHINGFOR I 58 | ||||
SIGNATURES
Pursuant to the requirements of the Securities Exchange Act of 1934, the registrant has duly caused this report to be signed on its behalf by the undersigned, thereunto duly authorized.
| CONSTELLATION BRANDS, INC. | |||||||||||
| Date: | October 7, 2025 | By: | /s/ Kenneth W. Metz | ||||||||
| Kenneth W. Metz, Senior Vice President, Controller and Corporate Finance | |||||||||||
| Date: | October 7, 2025 | By: | /s/ Garth Hankinson | ||||||||
| Garth Hankinson, Executive Vice President and Chief Financial Officer (principal financial officer and principal accounting officer) | |||||||||||
| Constellation Brands, Inc. Q2 FY 2026 Form 10-Q | #WORTHREACHINGFOR I 59 | ||||