EX-99.2
Published on September 2, 2025
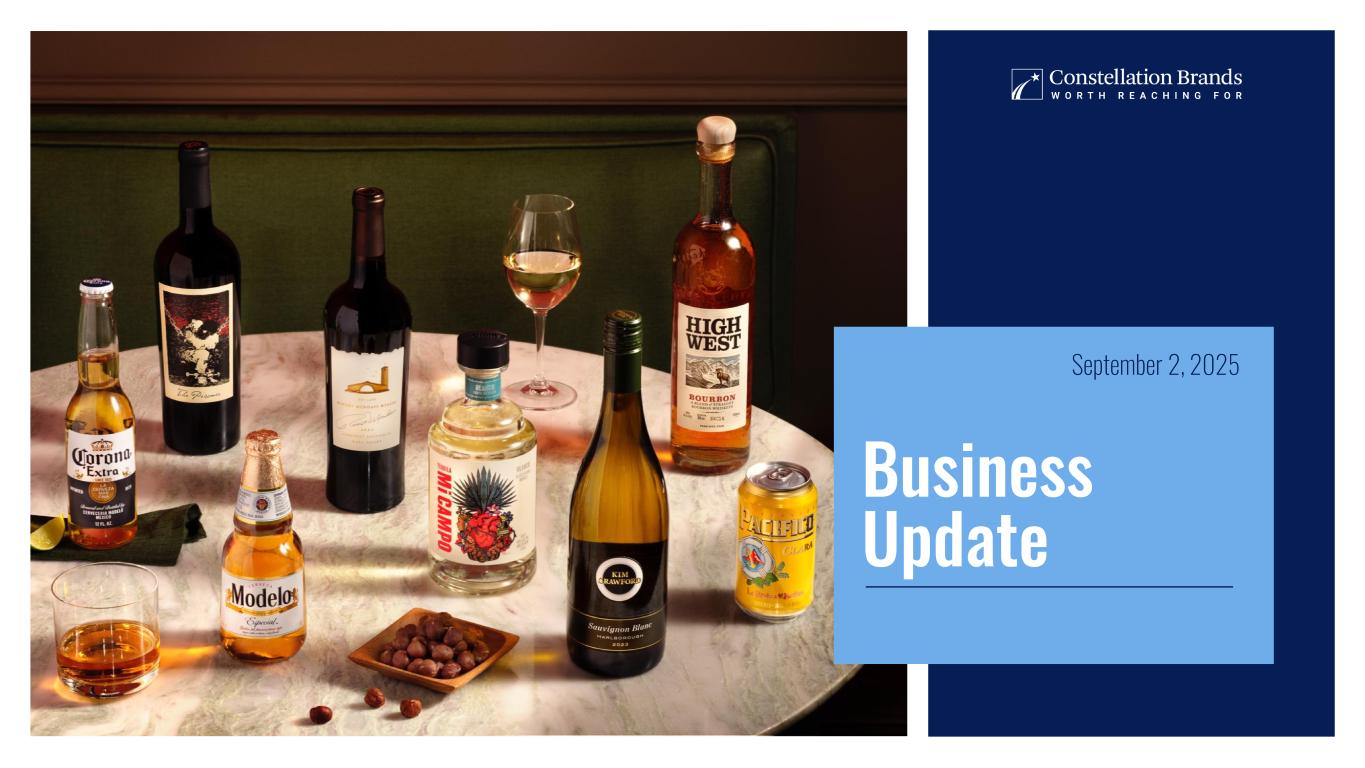
| Business Update September 2, 2025
|W O R T H R E A C H I N G F O R | 2 Forward-Looking Statements This presentation contains forward-looking statements that are based on certain assumptions, estimates, expectations, plans, timetables, analyses, and opinions made by management in light of their experience and perception of historical trends, current conditions, and expected future developments, as well as other factors management believes are appropriate in the circumstances. These forward-looking statements are subject to various risks and uncertainties, many of which are beyond our control, and which could cause actual results to differ materially from those set forth in, or implied by, such forward-looking statements. When used in this presentation, words such as “anticipate,” “intend,” “expect,” “plan,” “continue,” ”estimate,” “exceed,” “may,” “will,” “project,” “predict,” “propose,” “potential,” “targeting,” “exploring,” “goal,” “outlook,” “forecast,” “trend,” “path,” “scheduled,” “implementing,” “ongoing,” “seek,” “could,” “might,” “should,” “believe,” “vision,” and similar words or expressions are intended to identify forward-looking statements, although not all forward-looking statements contain such identifying words. Although we believe that the estimates, expectations, plans, and timetables reflected in the forward-looking statements are reasonable, they may vary from management’s current estimates, expectations, plans, and timetables, and we can give no assurance that such estimates, expectations, plans, and timetables will prove to be correct, as actual results and future events and timetables could differ materially from those anticipated in such statements. Information provided in this presentation is necessarily summarized and may not contain all available material information. All statements made regarding our outlook and all statements other than statements of historical fact set forth in this presentation may be forward-looking statements, including without limitation statements regarding or applicable to the macroeconomic environment and headwinds, employment, consumer demand, sentiment, and purchasing behavior, impacts of high-end beer buy rate declines and cost savings and efficiency initiatives, the socioeconomic environment, our business strategy, objectives, and execution, growth plans and focus areas, including distribution, shelf space, and volume and market share, innovation, capital allocation priorities, targets, and commitments, competitive position, Beer Business capital expansion, future operations, financial position, expected net sales, expenses, operating income, shipment and depletion volumes, operating deleveraging, tariffs, EIE, interest expense, net, tax rates, tax law changes, shifts in taxable income base, noncontrolling interests, shares outstanding, EPS, operating cash flow, capital expenditures, free cash flow, future payments of dividends, amount, manner, and timing of share repurchases under the share repurchase authorization, access to capital markets, liquidity and capital resources, value creation efforts, anticipated inflationary pressures, changing prices, and reductions in consumer discretionary income as well as other unfavorable global and regional economic conditions, geopolitical events, and military conflicts, and our responses thereto, potential changes to trade and tariff policies, and prospects, plans, and objectives of management, as well as information concerning expected actions of third parties.
|W O R T H R E A C H I N G F O R | 3 Forward-Looking Statements In addition to the risks and uncertainties of ordinary business operations and conditions in the general economy and markets in which we compete, our forward-looking statements contained in this presentation are also subject to the risk, uncertainty, and possible variance from our current expectations regarding: potential declines in the consumption of products we sell and our dependence on sales of our Mexican beer brands; impacts of our acquisition, divestiture, investment, and new product development strategies and activities, including the 2025 Wine Divestitures; dependence upon our trademarks and proprietary rights, including the failure to protect our intellectual property rights; potential damage to our reputation; competition in our industry and for talent; economic and other uncertainties associated with our international operations, including new or increased tariffs; water, agricultural and other raw material, and packaging material supply, production, and/or transportation difficulties, disruptions, and impacts, including limited groups of certain suppliers; reliance on complex information systems and third‐party global networks, including internal control over financial reporting changes in connection with our OneStream consolidation system implementation, as well as risks associated with cybersecurity and artificial intelligence; dependence on limited facilities for production of our Mexican beer brands, including beer operations expansion, optimization, and/or construction activities, scope, capacity, supply, costs (including impairments), capital expenditures, and timing; operational disruptions or catastrophic loss to our breweries, wineries, other production facilities, or distribution systems; severe weather, natural and man-made disasters, climate change, environmental sustainability and CSR-related regulatory compliance, failure to meet environmental sustainability and corporate social responsibility targets, commitments, and aspirations; the success of our cost savings, restructuring, and efficiency initiatives, including changes in key personnel responsible for oversight of our internal control over financial reporting in connection with the 2025 Restructuring Initiative; reliance on wholesale distributors, major retailers, and government agencies; contamination and degradation of product quality from diseases, pests, weather, and other conditions; communicable infection or disease outbreaks, pandemics, or other widespread public health crises impacting our consumers, employees, distributors, retailers, and/or suppliers; effects of employee labor activities that could increase our costs; our indebtedness and interest rate fluctuations; our international operations, worldwide and regional economic trends and financial market conditions, geopolitical uncertainty, including the impact of military conflicts, or other governmental rules and regulations; class action or other litigation we face or may face, including relating to alleged securities law violations, abuse or misuse of our products, product liability, marketing or sales practices, including product labeling, or other matters; potential impairments of our intangible assets, such as goodwill and trademarks; changes to tax laws, fluctuations in our effective tax rate, accounting for tax positions, the resolution of tax disputes, changes to accounting standards, elections, assertions, or policies, and the potential impact of a global minimum tax rate; uncertainties related to future cash dividends and share repurchases, which may affect the price of our common stock; ownership of our Class A Stock by certain individuals and entities affiliated with the Sands family and their Board of Director nomination rights; the choice-of-forum provision in our amended and restated by-laws regarding certain stockholder litigation and other factors and uncertainties disclosed from time to time in our filings with the SEC, including our Annual Report on Form 10-K for the fiscal year ended February 28, 2025. Forward- looking statements in this presentation are made as of September 2, 2025, and Constellation does not intend and expressly disclaims any obligation to update or revise the forward-looking information contained in this presentation, whether as a result of new information, future events, or otherwise, except as required by law. Accordingly, readers are cautioned not to place undue reliance on forward-looking information.
|W O R T H R E A C H I N G F O R | 4 Use of Non-GAAP Financial Measures, Disclaimers, Caution Regarding Outdated Material, and Location of Defined Terms This presentation may contain non-GAAP financial measures. These and other non-GAAP financial measures, the purposes for which management uses them, why management believes they are useful to investors, and reconciliations to the most directly comparable GAAP financial measures may be found in the appendix of this presentation or at ir.cbrands.com under the Financial Info/Financial History (Non-GAAP) section. All references to profit measures and earnings per share on a comparable basis exclude items that affect comparability. Non-GAAP financial measures are also referred to as being presented on a comparable, adjusted, or organic basis. The notes offered under Constellation’s commercial paper program have not been and will not be registered under the Securities Act of 1933, as amended, and may not be offered or sold in the U.S. absent registration or an applicable exemption from registration requirements. This presentation shall not constitute an offer to sell or the solicitation of an offer to buy Constellation’s notes under the commercial paper program. Unless the context otherwise requires, the term “consumers” refers to legal drinking age consumers and references to “betterment” products means Constellation’s lower-alcohol, lower-calorie, non-alcoholic, or no-calorie products. Market positions and industry data discussed in this presentation have been obtained or derived from industry and other third-party publications and Constellation’s estimates. Constellation has not independently verified the data from the industry and other third-party publications. Unless otherwise indicated, (i) all references to market positions are based on equivalent unit volume, and (ii) data discussed in this presentation is based on Constellation data, analysis, plans, and reporting. Unless otherwise indicated, the information presented as of September 2, 2025, and, to the best of Constellation’s knowledge, timely and accurate when made. Thereafter, the information contained in this presentation should be considered historical and not subject to further update by Constellation. A list of defined terms used within can be found in the appendix of this presentation
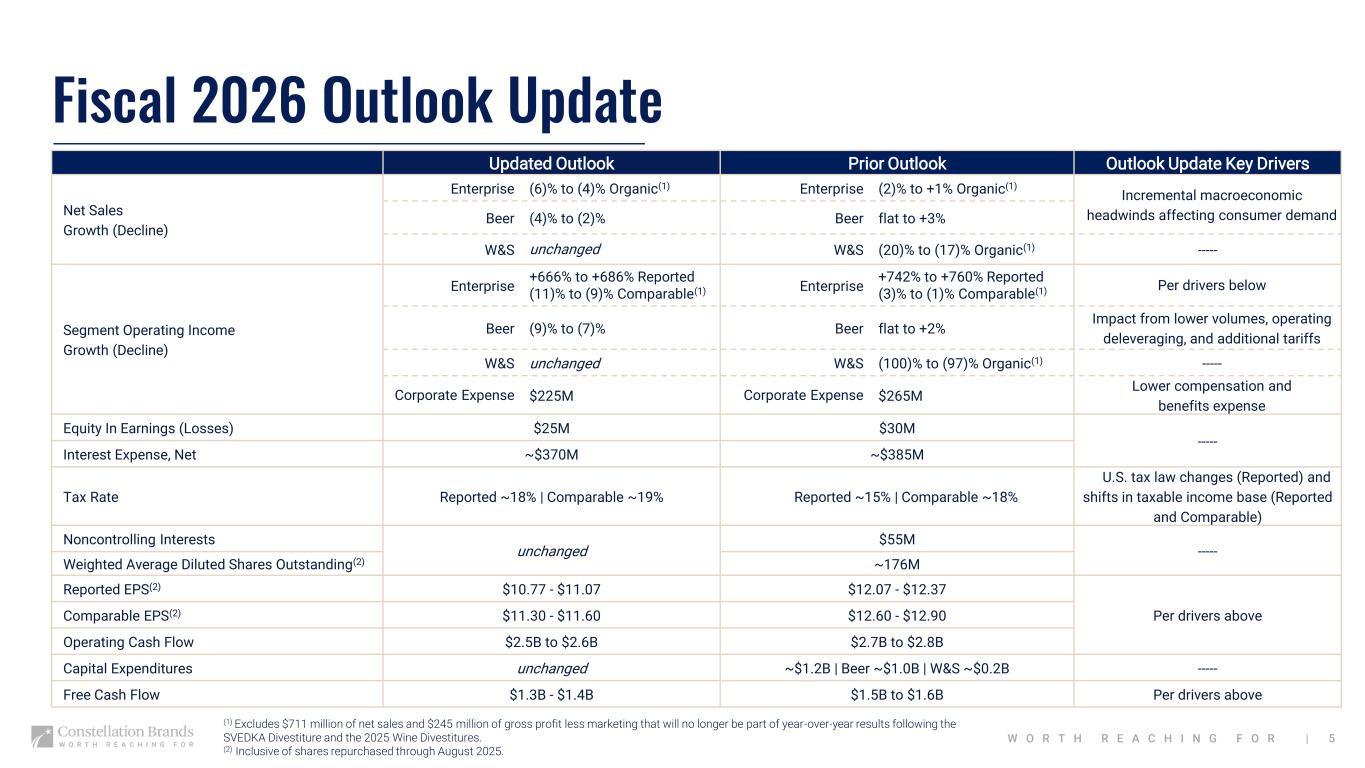
|W O R T H R E A C H I N G F O R | 5 Fiscal 2026 Outlook Update (1) Excludes $711 million of net sales and $245 million of gross profit less marketing that will no longer be part of year-over-year results following the SVEDKA Divestiture and the 2025 Wine Divestitures. (2) Inclusive of shares repurchased through August 2025. Updated Outlook Prior Outlook Outlook Update Key Drivers Net Sales Growth (Decline) Enterprise (6)% to (4)% Organic(1) Enterprise (2)% to +1% Organic(1) Incremental macroeconomic headwinds affecting consumer demandBeer (4)% to (2)% Beer flat to +3% W&S unchanged W&S (20)% to (17)% Organic(1) ----- Segment Operating Income Growth (Decline) Enterprise +666% to +686% Reported (11)% to (9)% Comparable(1) Enterprise +742% to +760% Reported (3)% to (1)% Comparable(1) Per drivers below Beer (9)% to (7)% Beer flat to +2% Impact from lower volumes, operating deleveraging, and additional tariffs W&S unchanged W&S (100)% to (97)% Organic(1) ----- Corporate Expense $225M Corporate Expense $265M Lower compensation and benefits expense Equity In Earnings (Losses) $25M $30M ----- Interest Expense, Net ~$370M ~$385M Tax Rate Reported ~18% | Comparable ~19% Reported ~15% | Comparable ~18% U.S. tax law changes (Reported) and shifts in taxable income base (Reported and Comparable) Noncontrolling Interests unchanged $55M ----- Weighted Average Diluted Shares Outstanding(2) ~176M Reported EPS(2) $10.77 - $11.07 $12.07 - $12.37 Per drivers aboveComparable EPS(2) $11.30 - $11.60 $12.60 - $12.90 Operating Cash Flow $2.5B to $2.6B $2.7B to $2.8B Capital Expenditures unchanged ~$1.2B | Beer ~$1.0B | W&S ~$0.2B ----- Free Cash Flow $1.3B - $1.4B $1.5B to $1.6B Per drivers above
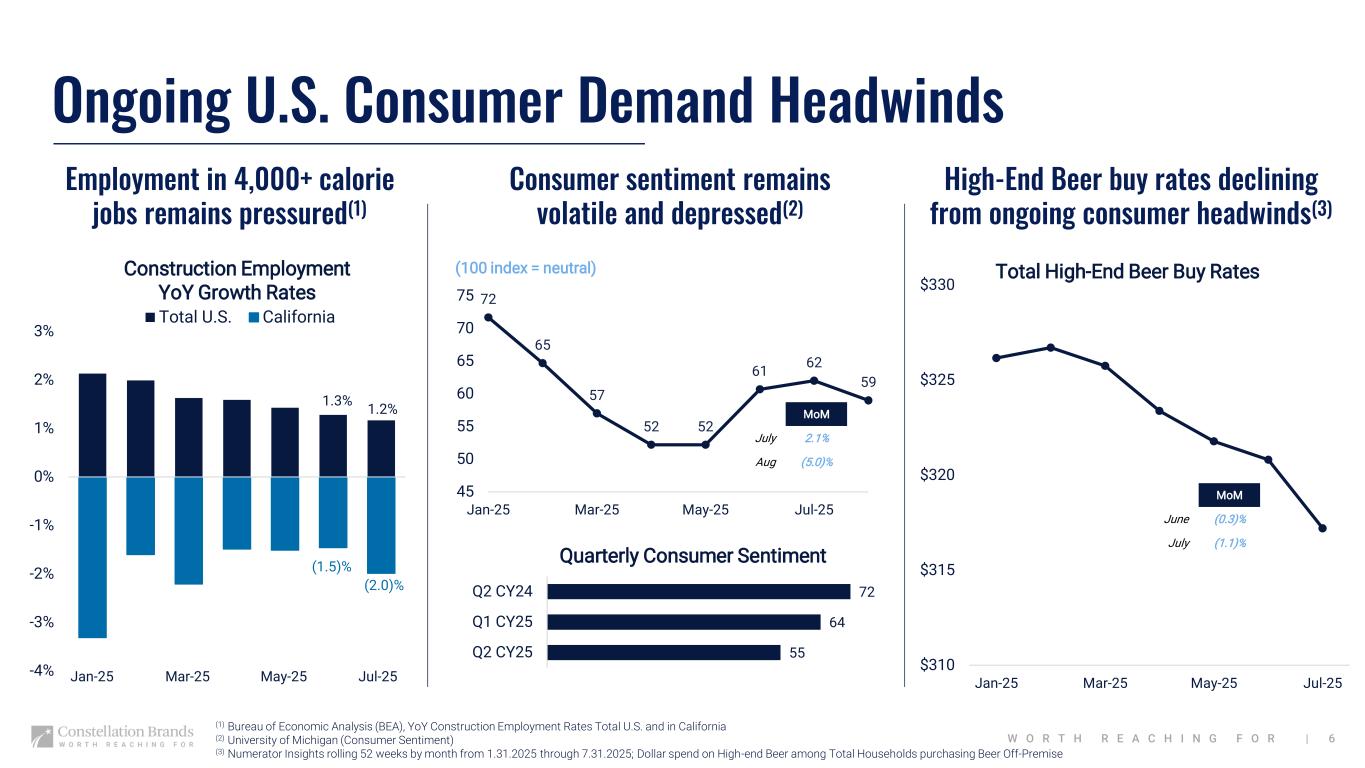
|W O R T H R E A C H I N G F O R | 6 Ongoing U.S. Consumer Demand Headwinds (1) Bureau of Economic Analysis (BEA), YoY Construction Employment Rates Total U.S. and in California (2) University of Michigan (Consumer Sentiment) (3) Numerator Insights rolling 52 weeks by month from 1.31.2025 through 7.31.2025; Dollar spend on High-end Beer among Total Households purchasing Beer Off-Premise Employment in 4,000+ calorie jobs remains pressured(1) 1.3% 1.2% (1.5)% (2.0)% -4% -3% -2% -1% 0% 1% 2% 3% Total U.S. California Jul-25Jan-25 Mar-25 May-25 Consumer sentiment remains volatile and depressed(2) 72 65 57 52 52 61 62 59 45 50 55 60 65 70 75 Jan-25 Mar-25 May-25 Jul-25 Construction Employment YoY Growth Rates 55 64 72 Q2 CY25 Q1 CY25 Q2 CY24 Quarterly Consumer Sentiment (100 index = neutral) High-End Beer buy rates declining from ongoing consumer headwinds(3) $310 $315 $320 $325 $330 Jan-25 Mar-25 May-25 Jul-25 Total High-End Beer Buy Rates MoM June (0.3)% July (1.1)% MoM July 2.1% Aug (5.0)%
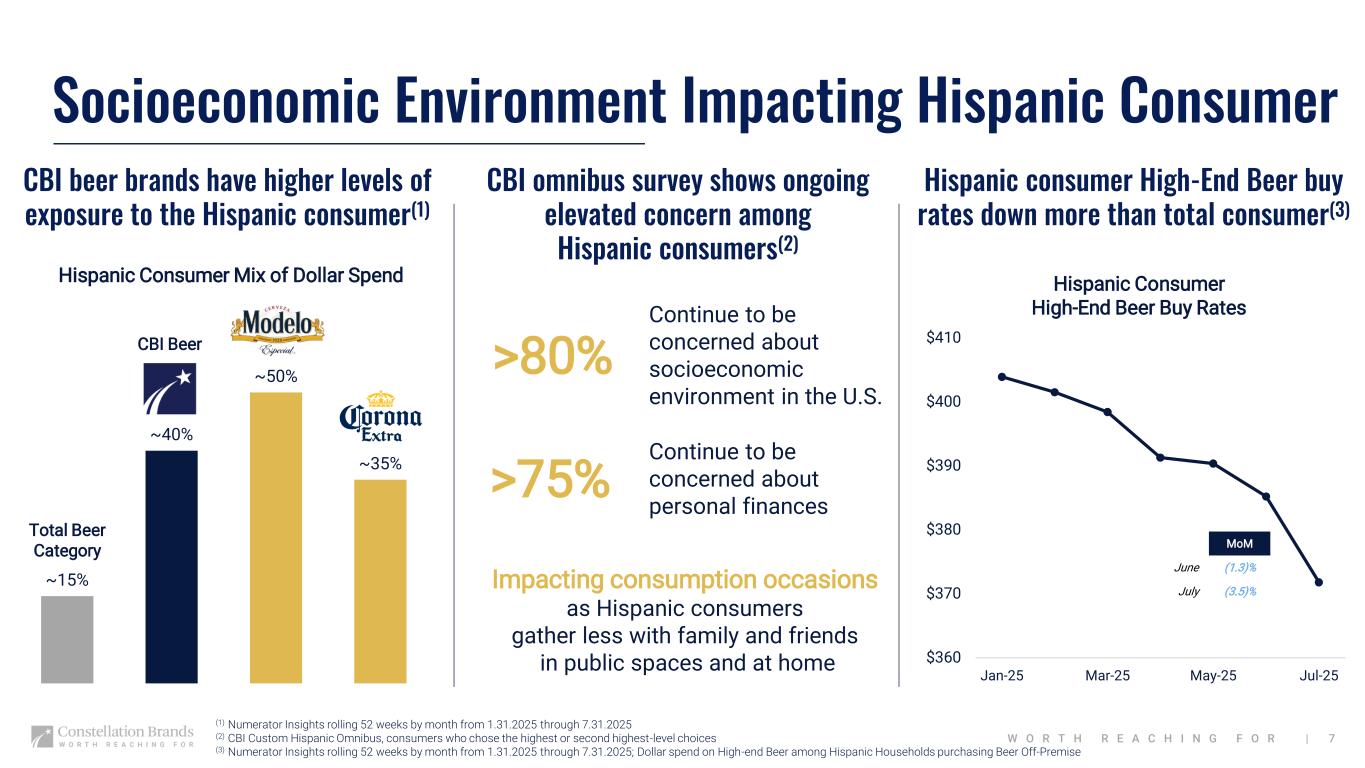
|W O R T H R E A C H I N G F O R | 7 Socioeconomic Environment Impacting Hispanic Consumer CBI omnibus survey shows ongoing elevated concern among Hispanic consumers(2) Hispanic consumer High-End Beer buy rates down more than total consumer(3) CBI beer brands have higher levels of exposure to the Hispanic consumer(1) >80% (1) Numerator Insights rolling 52 weeks by month from 1.31.2025 through 7.31.2025 (2) CBI Custom Hispanic Omnibus, consumers who chose the highest or second highest-level choices (3) Numerator Insights rolling 52 weeks by month from 1.31.2025 through 7.31.2025; Dollar spend on High-end Beer among Hispanic Households purchasing Beer Off-Premise Continue to be concerned about personal finances >75% Continue to be concerned about socioeconomic environment in the U.S. ~15% ~40% ~50% ~35% Hispanic Consumer Mix of Dollar Spend Total Beer Category Impacting consumption occasions as Hispanic consumers gather less with family and friends in public spaces and at home $360 $370 $380 $390 $400 $410 Jan-25 Mar-25 May-25 Jul-25 Hispanic Consumer High-End Beer Buy Rates MoM June (1.3)% July (3.5)% CBI Beer
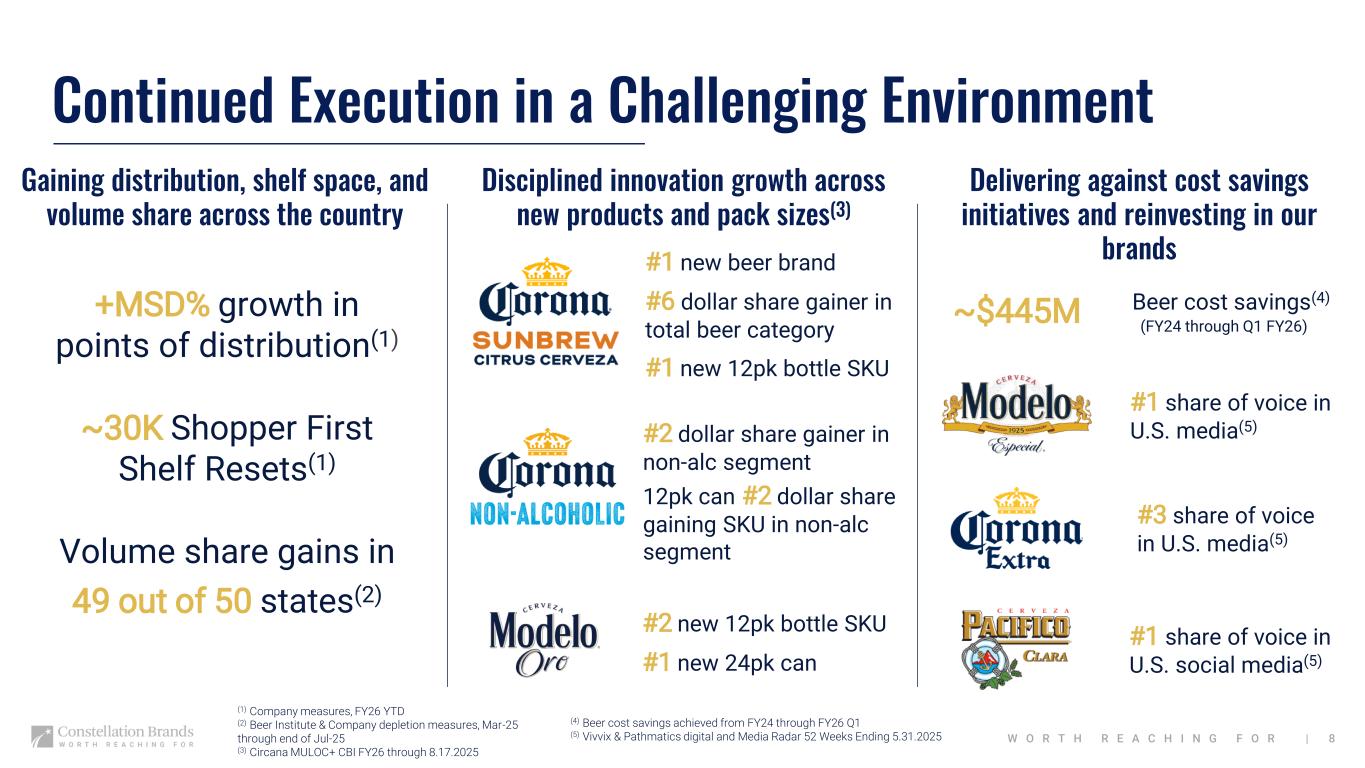
|W O R T H R E A C H I N G F O R | 8 Continued Execution in a Challenging Environment Disciplined innovation growth across new products and pack sizes(3) Delivering against cost savings initiatives and reinvesting in our brands#1 new beer brand #6 dollar share gainer in total beer category #1 new 12pk bottle SKU ~$445M Gaining distribution, shelf space, and volume share across the country +MSD% growth in points of distribution(1) #1 share of voice in U.S. media(5) #3 share of voice in U.S. media(5) #1 share of voice in U.S. social media(5) Beer cost savings(4) #2 new 12pk bottle SKU #1 new 24pk can #2 dollar share gainer in non-alc segment 12pk can #2 dollar share gaining SKU in non-alc segmentVolume share gains in 49 out of 50 states(2) ~30K Shopper First Shelf Resets(1) (1) Company measures, FY26 YTD (2) Beer Institute & Company depletion measures, Mar-25 through end of Jul-25 (3) Circana MULOC+ CBI FY26 through 8.17.2025 (4) Beer cost savings achieved from FY24 through FY26 Q1 (5) Vivvix & Pathmatics digital and Media Radar 52 Weeks Ending 5.31.2025 (FY24 through Q1 FY26)
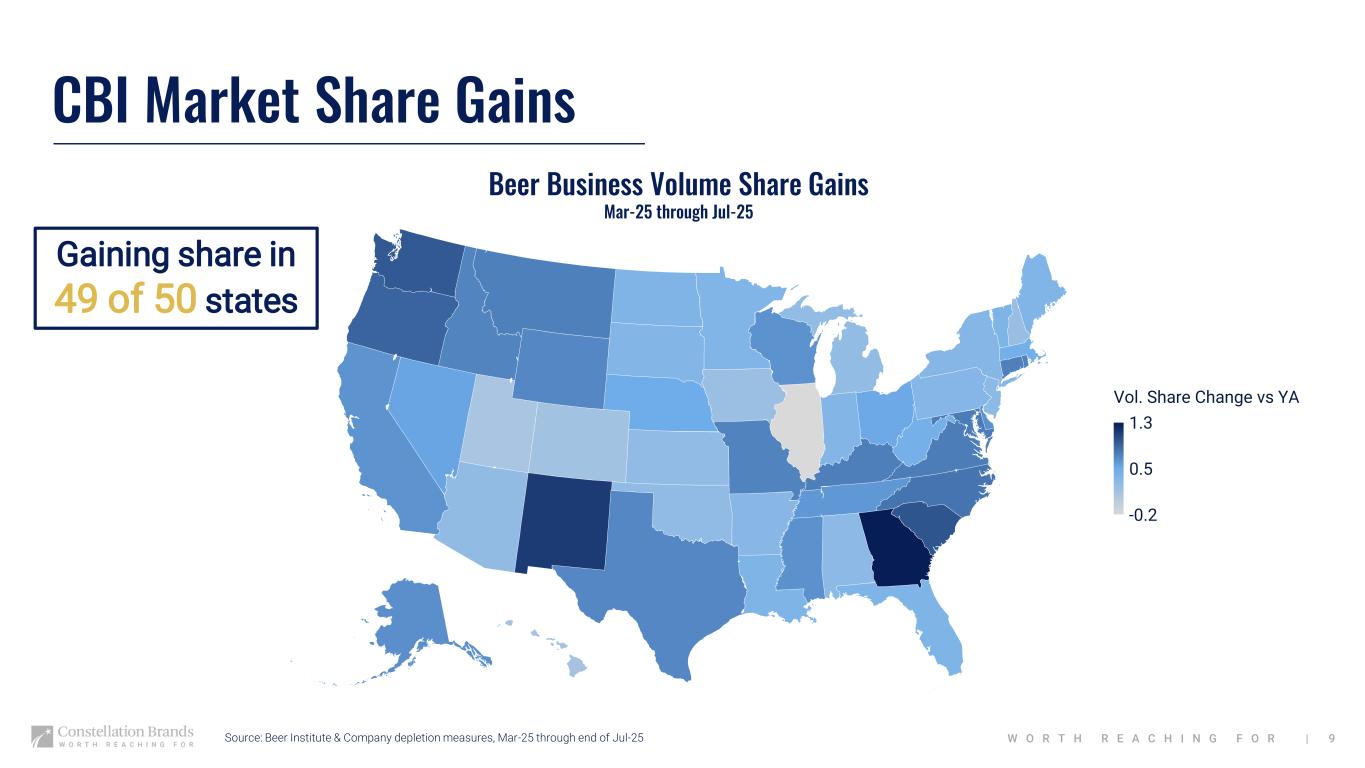
|W O R T H R E A C H I N G F O R | 9 CBI Market Share Gains Source: Beer Institute & Company depletion measures, Mar-25 through end of Jul-25 © GeoNames, Microsoft, TomTom Powered by Bing Beer Business Volume Share Gains Mar-25 through Jul-25 -0.2 0.5 1.3 Vol. Share Change vs YA Gaining share in 49 of 50 states
| Appendix Defined Terms Financial Information
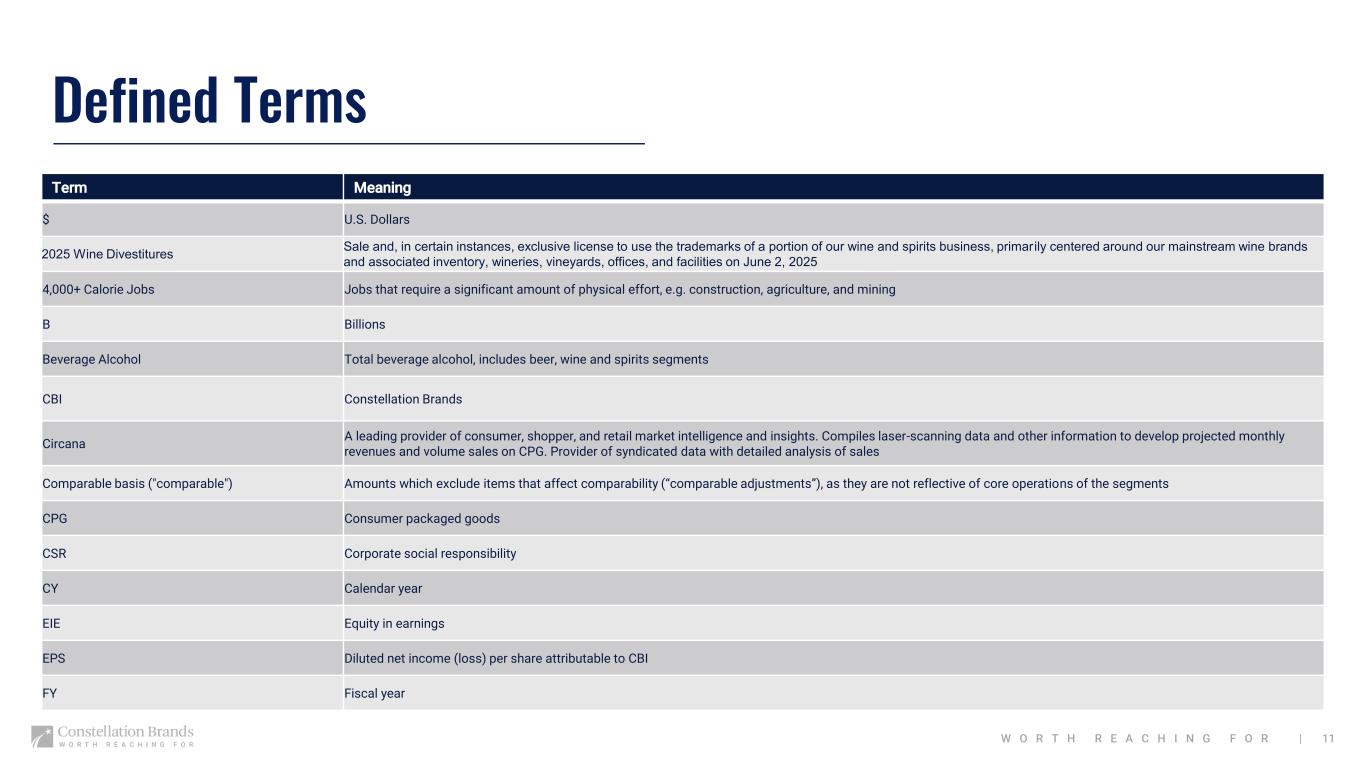
|W O R T H R E A C H I N G F O R | 11 Defined Terms Term Meaning $ U.S. Dollars 2025 Wine Divestitures Sale and, in certain instances, exclusive license to use the trademarks of a portion of our wine and spirits business, primarily centered around our mainstream wine brands and associated inventory, wineries, vineyards, offices, and facilities on June 2, 2025 4,000+ Calorie Jobs Jobs that require a significant amount of physical effort, e.g. construction, agriculture, and mining B Billions Beverage Alcohol Total beverage alcohol, includes beer, wine and spirits segments CBI Constellation Brands Circana A leading provider of consumer, shopper, and retail market intelligence and insights. Compiles laser-scanning data and other information to develop projected monthly revenues and volume sales on CPG. Provider of syndicated data with detailed analysis of sales Comparable basis ("comparable") Amounts which exclude items that affect comparability (“comparable adjustments”), as they are not reflective of core operations of the segments CPG Consumer packaged goods CSR Corporate social responsibility CY Calendar year EIE Equity in earnings EPS Diluted net income (loss) per share attributable to CBI FY Fiscal year
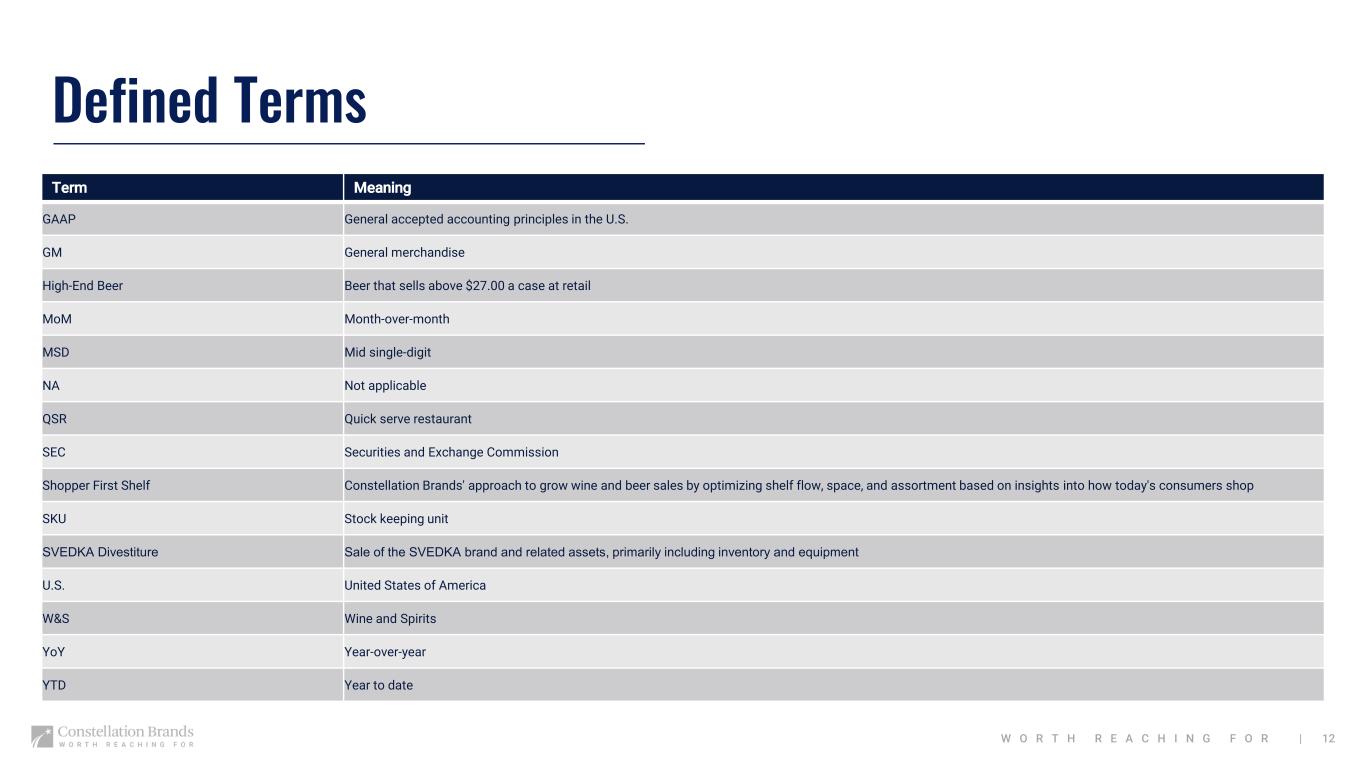
|W O R T H R E A C H I N G F O R | 12 Defined Terms Term Meaning GAAP General accepted accounting principles in the U.S. GM General merchandise High-End Beer Beer that sells above $27.00 a case at retail MoM Month-over-month MSD Mid single-digit NA Not applicable QSR Quick serve restaurant SEC Securities and Exchange Commission Shopper First Shelf Constellation Brands' approach to grow wine and beer sales by optimizing shelf flow, space, and assortment based on insights into how today's consumers shop SKU Stock keeping unit SVEDKA Divestiture Sale of the SVEDKA brand and related assets, primarily including inventory and equipment U.S. United States of America W&S Wine and Spirits YoY Year-over-year YTD Year to date

| Financial Information
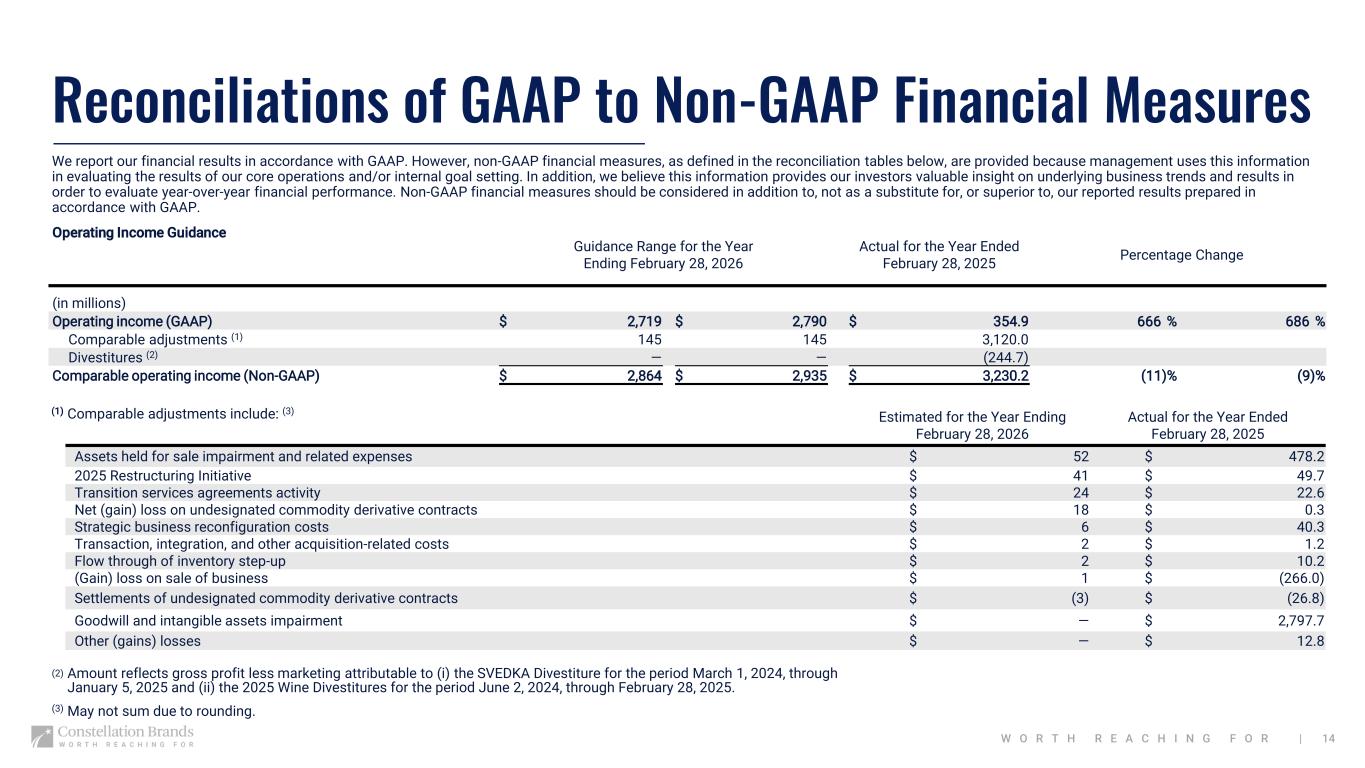
|W O R T H R E A C H I N G F O R | 14 Reconciliations of GAAP to Non-GAAP Financial Measures We report our financial results in accordance with GAAP. However, non-GAAP financial measures, as defined in the reconciliation tables below, are provided because management uses this information in evaluating the results of our core operations and/or internal goal setting. In addition, we believe this information provides our investors valuable insight on underlying business trends and results in order to evaluate year-over-year financial performance. Non-GAAP financial measures should be considered in addition to, not as a substitute for, or superior to, our reported results prepared in accordance with GAAP. Operating Income Guidance Guidance Range for the Year Ending February 28, 2026 Actual for the Year Ended February 28, 2025 Percentage Change (in millions) Operating income (GAAP) $ 2,719 $ 2,790 $ 354.9 666 % 686 % Comparable adjustments (1) 145 145 3,120.0 Divestitures (2) — — (244.7) Comparable operating income (Non-GAAP) $ 2,864 $ 2,935 $ 3,230.2 (11)% (9)% (1) Comparable adjustments include: (3) Estimated for the Year Ending February 28, 2026 Actual for the Year Ended February 28, 2025 Assets held for sale impairment and related expenses $ 52 $ 478.2 2025 Restructuring Initiative $ 41 $ 49.7 Transition services agreements activity $ 24 $ 22.6 Net (gain) loss on undesignated commodity derivative contracts $ 18 $ 0.3 Strategic business reconfiguration costs $ 6 $ 40.3 Transaction, integration, and other acquisition-related costs $ 2 $ 1.2 Flow through of inventory step-up $ 2 $ 10.2 (Gain) loss on sale of business $ 1 $ (266.0) Settlements of undesignated commodity derivative contracts $ (3) $ (26.8) Goodwill and intangible assets impairment $ — $ 2,797.7 Other (gains) losses $ — $ 12.8 (2) Amount reflects gross profit less marketing attributable to (i) the SVEDKA Divestiture for the period March 1, 2024, through January 5, 2025 and (ii) the 2025 Wine Divestitures for the period June 2, 2024, through February 28, 2025. (3) May not sum due to rounding.
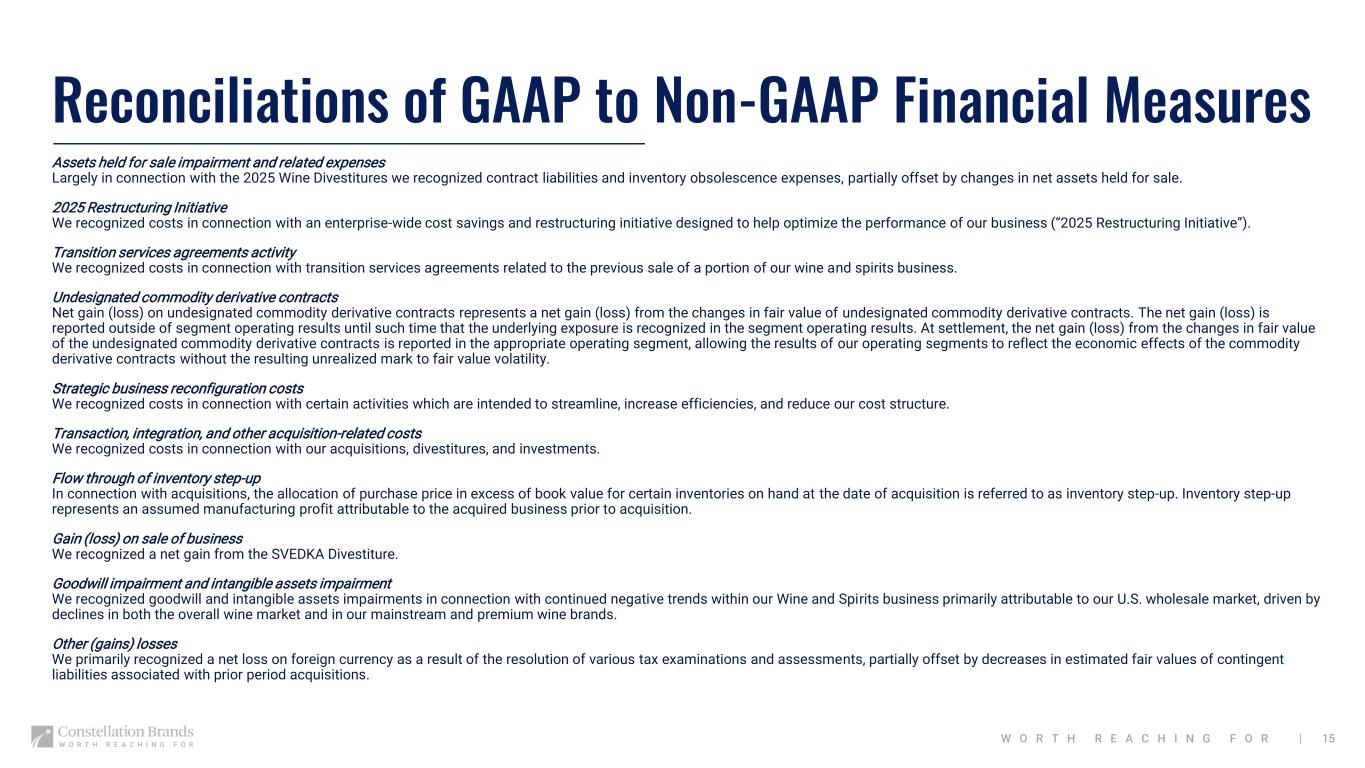
|W O R T H R E A C H I N G F O R | 15 Reconciliations of GAAP to Non-GAAP Financial Measures Assets held for sale impairment and related expenses Largely in connection with the 2025 Wine Divestitures we recognized contract liabilities and inventory obsolescence expenses, partially offset by changes in net assets held for sale. 2025 Restructuring Initiative We recognized costs in connection with an enterprise-wide cost savings and restructuring initiative designed to help optimize the performance of our business (“2025 Restructuring Initiative”). Transition services agreements activity We recognized costs in connection with transition services agreements related to the previous sale of a portion of our wine and spirits business. Undesignated commodity derivative contracts Net gain (loss) on undesignated commodity derivative contracts represents a net gain (loss) from the changes in fair value of undesignated commodity derivative contracts. The net gain (loss) is reported outside of segment operating results until such time that the underlying exposure is recognized in the segment operating results. At settlement, the net gain (loss) from the changes in fair value of the undesignated commodity derivative contracts is reported in the appropriate operating segment, allowing the results of our operating segments to reflect the economic effects of the commodity derivative contracts without the resulting unrealized mark to fair value volatility. Strategic business reconfiguration costs We recognized costs in connection with certain activities which are intended to streamline, increase efficiencies, and reduce our cost structure. Transaction, integration, and other acquisition-related costs We recognized costs in connection with our acquisitions, divestitures, and investments. Flow through of inventory step-up In connection with acquisitions, the allocation of purchase price in excess of book value for certain inventories on hand at the date of acquisition is referred to as inventory step-up. Inventory step-up represents an assumed manufacturing profit attributable to the acquired business prior to acquisition. Gain (loss) on sale of business We recognized a net gain from the SVEDKA Divestiture. Goodwill impairment and intangible assets impairment We recognized goodwill and intangible assets impairments in connection with continued negative trends within our Wine and Spirits business primarily attributable to our U.S. wholesale market, driven by declines in both the overall wine market and in our mainstream and premium wine brands. Other (gains) losses We primarily recognized a net loss on foreign currency as a result of the resolution of various tax examinations and assessments, partially offset by decreases in estimated fair values of contingent liabilities associated with prior period acquisitions.
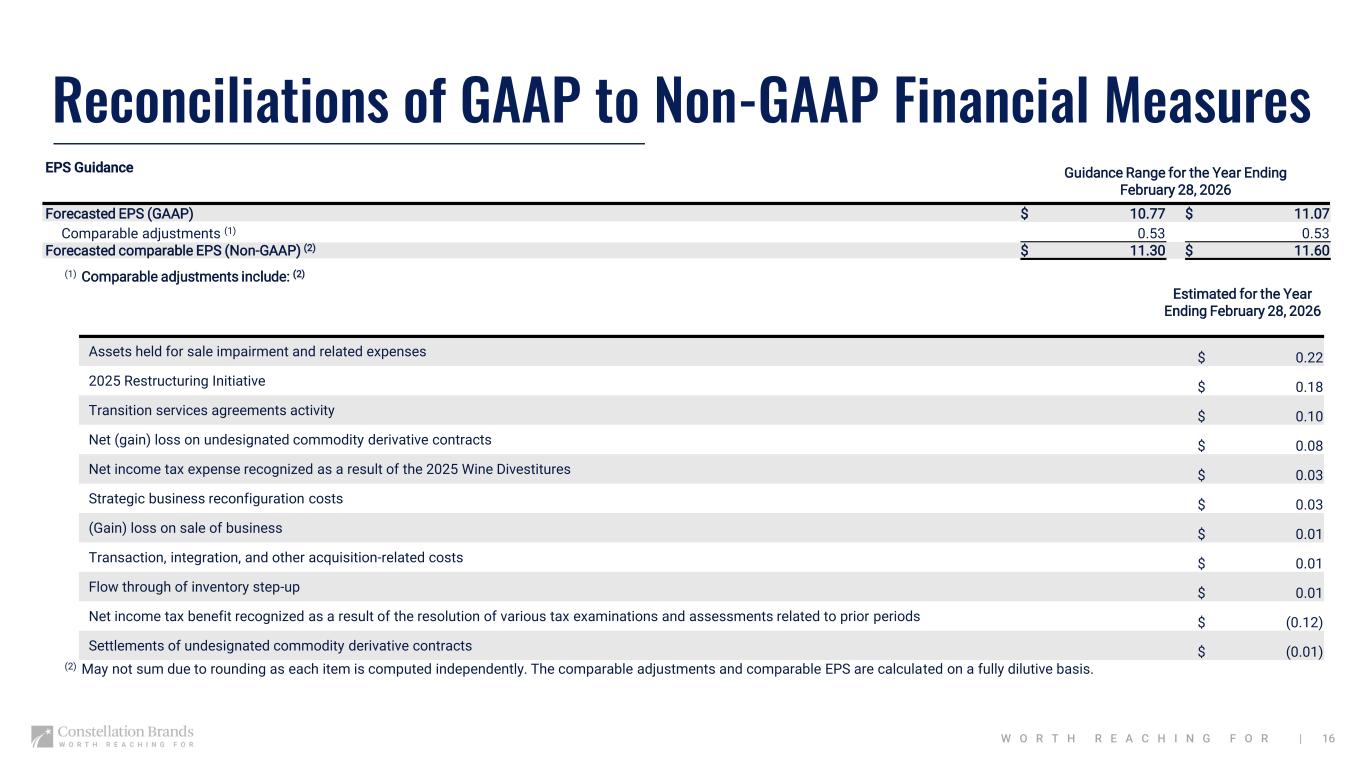
|W O R T H R E A C H I N G F O R | 16 Reconciliations of GAAP to Non-GAAP Financial Measures EPS Guidance Guidance Range for the Year Ending February 28, 2026 Forecasted EPS (GAAP) $ 10.77 $ 11.07 Comparable adjustments (1) 0.53 0.53 Forecasted comparable EPS (Non-GAAP) (2) $ 11.30 $ 11.60 (1) Comparable adjustments include: (2) Estimated for the Year Ending February 28, 2026 Assets held for sale impairment and related expenses $ 0.22 2025 Restructuring Initiative $ 0.18 Transition services agreements activity $ 0.10 Net (gain) loss on undesignated commodity derivative contracts $ 0.08 Net income tax expense recognized as a result of the 2025 Wine Divestitures $ 0.03 Strategic business reconfiguration costs $ 0.03 (Gain) loss on sale of business $ 0.01 Transaction, integration, and other acquisition-related costs $ 0.01 Flow through of inventory step-up $ 0.01 Net income tax benefit recognized as a result of the resolution of various tax examinations and assessments related to prior periods $ (0.12) Settlements of undesignated commodity derivative contracts $ (0.01) (2) May not sum due to rounding as each item is computed independently. The comparable adjustments and comparable EPS are calculated on a fully dilutive basis.
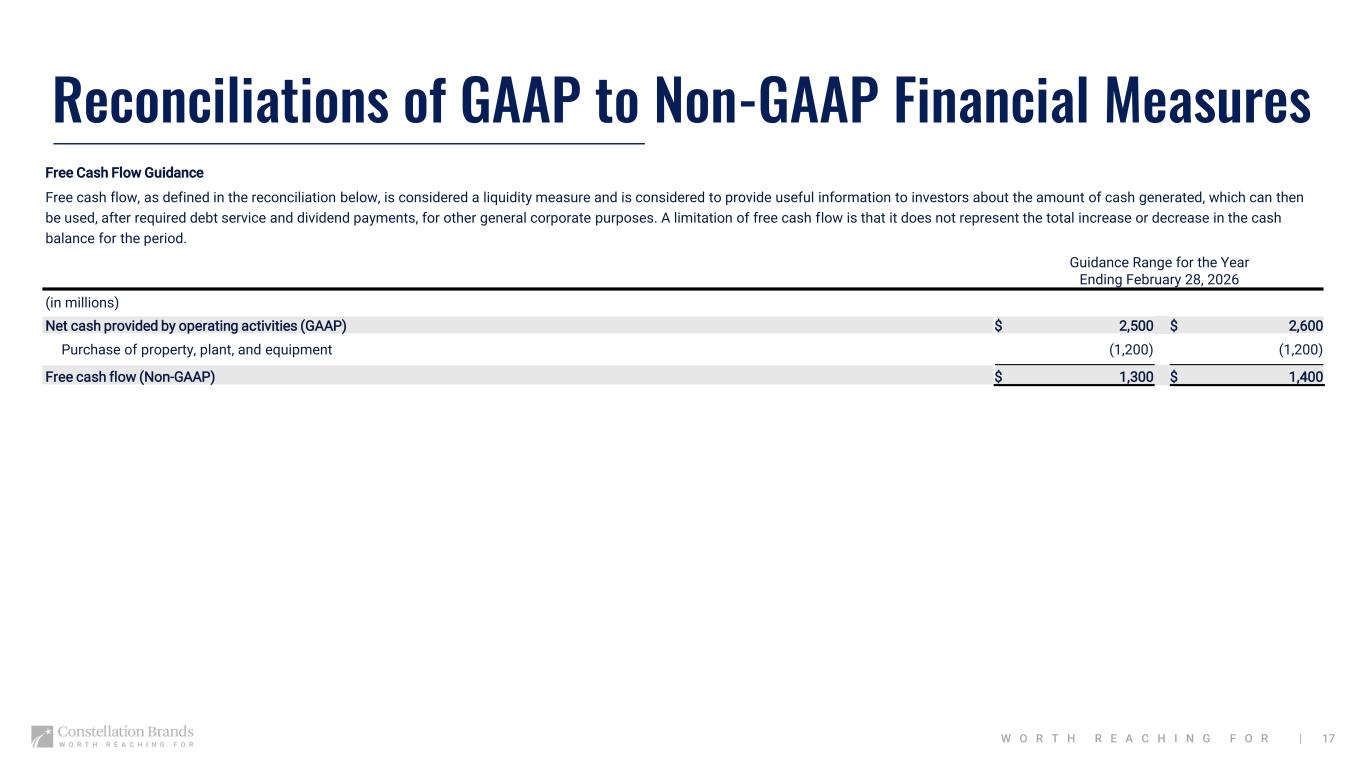
|W O R T H R E A C H I N G F O R | 17 Reconciliations of GAAP to Non-GAAP Financial Measures Free Cash Flow Guidance Free cash flow, as defined in the reconciliation below, is considered a liquidity measure and is considered to provide useful information to investors about the amount of cash generated, which can then be used, after required debt service and dividend payments, for other general corporate purposes. A limitation of free cash flow is that it does not represent the total increase or decrease in the cash balance for the period. Guidance Range for the Year Ending February 28, 2026 (in millions) Net cash provided by operating activities (GAAP) $ 2,500 $ 2,600 Purchase of property, plant, and equipment (1,200) (1,200) Free cash flow (Non-GAAP) $ 1,300 $ 1,400

|