10-Q: Quarterly report pursuant to Section 13 or 15(d)
Published on October 5, 2023
UNITED STATES
SECURITIES AND EXCHANGE COMMISSION
Washington, D.C. 20549
FORM 10-Q
(Mark One)
| QUARTERLY REPORT PURSUANT TO SECTION 13 OR 15(d) OF THE SECURITIES EXCHANGE ACT OF 1934 | |||||
For the quarterly period ended August 31, 2023
or
| TRANSITION REPORT PURSUANT TO SECTION 13 OR 15(d) OF THE SECURITIES EXCHANGE ACT OF 1934 | |||||
For the transition period from to
Commission File Number: 001-08495

(Exact name of registrant as specified in its charter)
| (State or other jurisdiction of incorporation or organization) | (I.R.S. Employer Identification No.) | ||||
(Address of principal executive offices) (Zip code)
(585 ) 678-7100
(Registrant’s telephone number, including area code)
Not Applicable
(Former name, former address and former fiscal year, if changed since last report)
Securities registered pursuant to Section 12(b) of the Act:
| Title of Each Class | Trading Symbol(s) | Name of Each Exchange on Which Registered | ||||||
Indicate by check mark whether the registrant (1) has filed all reports required to be filed by Section 13 or 15(d) of the Securities Exchange Act of 1934 during the preceding 12 months (or for such shorter period that the registrant was required to file such reports), and (2) has been subject to such filing requirements for the past 90 days. ☒ Yes ☐ No
Indicate by check mark whether the registrant has submitted electronically every Interactive Data File required to be submitted pursuant to Rule 405 of Regulation S-T (§232.405 of this chapter) during the preceding 12 months (or for such shorter period that the registrant was required to submit such files). ☒ Yes ☐ No
Indicate by check mark whether the registrant is a large accelerated filer, an accelerated filer, a non-accelerated filer, a smaller reporting company, or an emerging growth company. See the definitions of “large accelerated filer,” “accelerated filer,” “smaller reporting company,” and “emerging growth company” in Rule 12b-2 of the Exchange Act.
| ☒ | Accelerated filer | ☐ | |||||||||
| Non-accelerated filer | ☐ | Smaller reporting company | |||||||||
| Emerging growth company | |||||||||||
If an emerging growth company, indicate by check mark if the registrant has elected not to use the extended transition period for complying with any new or revised financial accounting standards provided pursuant to Section 13(a) of the Exchange Act. ☐
Indicate by check mark whether the registrant is a shell company (as defined in Rule 12b-2 of the Exchange Act).
Yes ☐ No ☒
There were 183,662,681 shares of Class A Common Stock and 23,241 shares of Class 1 Common Stock outstanding as of September 30, 2023.
TABLE OF CONTENTS
| Page | ||||||||
| DEFINED TERMS | ||||||||
| PART I – FINANCIAL INFORMATION | ||||||||
| Item 1. Financial Statements | ||||||||
| Consolidated Balance Sheets | ||||||||
| Consolidated Statements of Comprehensive Income (Loss) | ||||||||
| Consolidated Statements of Changes in Stockholders’ Equity | ||||||||
| Consolidated Statements of Cash Flows | ||||||||
| Notes to Consolidated Financial Statements | ||||||||
1. Basis of Presentation |
||||||||
2. Inventories |
||||||||
3. Derivative Instruments |
||||||||
4. Fair Value of Financial Instruments |
||||||||
5. Goodwill |
||||||||
6. Intangible Assets |
||||||||
7. Equity Method Investments |
||||||||
8. Borrowings |
||||||||
9. Income Taxes |
||||||||
10. Stockholders' Equity |
||||||||
11. Net Income (Loss) Per Common Share Attributable to CBI |
||||||||
12. Comprehensive Income (Loss) Attributable to CBI |
||||||||
13. Business Segment Information |
||||||||
| Item 2. Management’s Discussion and Analysis of Financial Condition and Results of Operations | ||||||||
| Item 3. Quantitative and Qualitative Disclosures About Market Risk | ||||||||
| Item 4. Controls and Procedures | ||||||||
| PART II – OTHER INFORMATION | ||||||||
| Item 1. Legal Proceedings | ||||||||
| Item 1A. Risk Factors | ||||||||
| Item 5. Other Information | ||||||||
| Item 6. Exhibits | ||||||||
| SIGNATURES | ||||||||
This Form 10-Q contains “forward-looking statements” within the meaning of Section 27A of the Securities Act and Section 21E of the Exchange Act. These forward-looking statements are subject to a number of risks and uncertainties, many of which are beyond the Company’s control, that could cause actual results to differ materially from those set forth in, or implied by, such forward-looking statements. For further information regarding such forward-looking statements, risks, and uncertainties, please see “Information Regarding Forward-Looking Statements” under MD&A.
Defined Terms
Unless the context otherwise requires, the terms “Company,” “CBI,” “we,” “our,” or “us” refer to Constellation Brands, Inc. and its subsidiaries. We use terms in this Form 10-Q and in our Notes that are specific to us or are abbreviations that may not be commonly known or used.
| Term | Meaning | ||||
| $ | U.S. dollars | ||||
| 3.20% February 2018 Senior Notes | $600.0 million principal amount of 3.20% senior notes issued in February 2018, partially tendered in May 2022, and fully redeemed in June 2022, prior to maturity | ||||
| 4.25% May 2013 Senior Notes | $1,050.0 million principal amount of 4.25% senior notes issued in May 2013, partially tendered in May 2022, and fully redeemed in June 2022, prior to maturity | ||||
| 2021 Authorization | authority to repurchase up to $2.0 billion of our publicly traded common stock, authorized in January 2021 by our Board of Directors | ||||
| 2022 Credit Agreement | tenth amended and restated credit agreement, dated as of April 14, 2022, that provides for an aggregate revolving credit facility of $2.25 billion | ||||
| 2023 Annual Report | our Annual Report on Form 10-K for the fiscal year ended February 28, 2023 | ||||
| 2023 Canopy Promissory Note | C$100.0 million principal amount of 4.25% promissory note issued to us by Canopy in April 2023 | ||||
| 3-tier | distribution channel where products are sold to a distributor (wholesaler) who then sells to a retailer; the retailer sells the products to a consumer |
||||
| 3-tier eCommerce | digital commerce experience for consumers to purchase beverage alcohol from retailers | ||||
| ABA | alternative beverage alcohol | ||||
| Administrative Agent | Bank of America, N.A., as administrative agent for the senior credit facility and term loan credit agreements | ||||
| Amended and Restated By-Laws | our amended and restated by-laws which became effective at the Effective Time | ||||
| Amended and Restated Charter | our amended and restated certificate of incorporation which effectuated the Reclassification at the Effective Time | ||||
| AOCI | accumulated other comprehensive income (loss) | ||||
| April 2022 Term Credit Agreement | amended and restated term loan credit agreement, dated as of March 26, 2020, that provided for aggregate facilities of $491.3 million, consisting of a five-year term loan facility, inclusive of amendments dated as of June 10, 2021, and April 14, 2022, now repaid in full |
||||
| August 2022 Term Credit Agreement | term loan credit agreement, dated as of August 9, 2022, that provided for a $1.0 billion unsecured delayed draw three-year term loan facility, now repaid in full |
||||
| Austin Cocktails | we made an initial investment in the Austin Cocktails business and subsequently acquired the remaining ownership interest | ||||
| BioSteel | BioSteel Sports Nutrition Inc., a subsidiary of Canopy |
||||
| C$ | Canadian dollars | ||||
| Canopy | we made an investment in Canopy Growth Corporation, an Ontario, Canada-based public company |
||||
| Canopy Amendment | a proposed resolution authorizing amending Canopy’s share capital to create Exchangeable Shares and providing for the conversion of Canopy common shares into Exchangeable Shares on a one-for-one basis at any time and at the option of the holder of such shares | ||||
| Canopy Debt Securities | debt securities issued by Canopy in June 2018 | ||||
| Canopy Equity Method Investment | an investment in Canopy common shares | ||||
| Canopy Strategic Transaction(s) | any potential acquisition, divestiture, investment, or other similar transaction made by Canopy, including but not limited to the Canopy Transaction | ||||
Canopy Transaction |
proposed corporate transaction by Canopy, including the creation of Exchangeable Shares, designed to consolidate its U.S. cannabis assets into Canopy USA | ||||
Constellation Brands, Inc. Q2 FY 2024 Form 10-Q |
#WORTHREACHINGFOR I i
|
||||
| Term | Meaning | ||||
| Canopy USA | a new U.S. holding company formed by Canopy | ||||
CB International |
CB International Finance S.à r.l., a wholly-owned subsidiary of ours |
||||
| Class 1 Stock | our Class 1 Convertible Common Stock, par value $0.01 per share | ||||
| Class A Stock | our Class A Common Stock, par value $0.01 per share | ||||
| Class B Stock | our Class B Convertible Common Stock, par value $0.01 per share, eliminated on November 10, 2022, pursuant to the Reclassification | ||||
| CODM | chief operating decision maker | ||||
| Comparable Adjustments | certain items affecting comparability that have been excluded by management | ||||
| Consent Agreement | an agreement between Canopy and (i) Greenstar Canada Investment Limited Partnership and (ii) CBG Holdings LLC, our indirect, wholly-owned subsidiaries | ||||
| CPG | consumer packaged goods | ||||
| Craft Beer Divestitures | the Four Corners Divestiture and the Funky Buddha Divestiture, collectively | ||||
| Daleville Facility | production facility located in Roanoke, Virginia | ||||
| Depletions | represent U.S. domestic distributor shipments of our respective branded products to retail customers, based on third-party data |
||||
| Digital Business Acceleration | a phased initiative by the Company to create a cohesive digital strategy and build an advanced digital business in the coming years | ||||
| DTC | direct-to-consumer inclusive of (i) a digital commerce experience for consumers to purchase directly from brand websites with inventory coming straight from the supplier and (ii) consumer purchases at hospitality locations (tasting rooms and tap rooms) from the supplier | ||||
| Effective Time | the time that the Amended and Restated Charter was duly filed with the Secretary of State of the State of Delaware on November 10, 2022 | ||||
| ESG | environmental, social, and governance | ||||
| Exchangeable Shares | proposed new class of non-voting and non-participating exchangeable shares in Canopy which will be convertible into common shares of Canopy | ||||
| Exchange Act | Securities Exchange Act of 1934, as amended | ||||
| Financial Statements | our consolidated financial statements and notes thereto included herein |
||||
| Fiscal 2023 | the Company’s fiscal year ended February 28, 2023 | ||||
| Fiscal 2024 | the Company’s fiscal year ending February 29, 2024 | ||||
| Fiscal 2025 | the Company’s fiscal year ending February 28, 2025 | ||||
| Fiscal 2026 | the Company’s fiscal year ending February 28, 2026 | ||||
| Fiscal 2027 | the Company’s fiscal year ending February 28, 2027 | ||||
| Fiscal 2028 | the Company’s fiscal year ending February 29, 2028 | ||||
| Fiscal 2029 | the Company’s fiscal year ending February 28, 2029 | ||||
| Form 10-Q | this Quarterly Report on Form 10-Q for the quarterly period ended August 31, 2023, unless otherwise specified |
||||
| Four Corners Divestiture | sale of the Four Corners Brewing Company LLC business | ||||
| Funky Buddha Divestiture | sale of the Funky Buddha Brewery LLC business | ||||
| GHG | greenhouse gas | ||||
| IT | information technology | ||||
| Lingua Franca | Lingua Franca, LLC business, acquired by us | ||||
| May 2023 Senior Notes | $750.0 million aggregate principal amount of senior notes issued in May 2023 | ||||
| MD&A |
Management’s Discussion and Analysis of Financial Condition and Results of Operations under Part I – Item 2. of this Form 10-Q
|
||||
Mexicali Brewery |
canceled brewery construction project located in Mexicali, Baja California, Mexico |
||||
| Mexico Beer Projects | expansion, optimization, and/or construction activities at the Obregon Brewery, Nava Brewery, and Veracruz Brewery | ||||
Constellation Brands, Inc. Q2 FY 2024 Form 10-Q |
#WORTHREACHINGFOR I ii
|
||||
| Term | Meaning | ||||
| M&T | Manufacturers and Traders Trust Company | ||||
| NA | not applicable | ||||
| Nava | Nava, Coahuila, Mexico | ||||
| Nava Brewery | brewery located in Nava | ||||
| Net sales | gross sales less promotions, returns and allowances, and excise taxes | ||||
| NM | not meaningful | ||||
| Note(s) | notes to the consolidated financial statements | ||||
| November 2018 Canopy Warrants | warrants acquired in November 2018 which give us the option to purchase common shares of Canopy | ||||
| Obregon | Obregon, Sonora, Mexico | ||||
Obregon Brewery |
brewery located in Obregon |
||||
| OCI | other comprehensive income (loss) | ||||
October 2022 Credit Agreement Amendment |
amendment dated as of October 18, 2022, to the 2022 Credit Agreement |
||||
| Pre-issuance hedge contracts | treasury lock and/or swap lock contracts designated as cash flow hedges entered into to hedge treasury rate volatility on future debt issuances | ||||
| Reclassification | the reclassification, exchange, and conversion of the Company’s common stock to eliminate the Class B Stock pursuant to the terms and conditions of the Reclassification Agreement |
||||
| Reclassification Agreement | reclassification agreement in support of the Reclassification, dated June 30, 2022, among the Company and the Sands Family Stockholders |
||||
| RTD | ready-to-drink | ||||
| Sands Family Stockholders | RES Master LLC, RES Business Holdings LP, SER Business Holdings LP, RHT 2015 Business Holdings LP, RSS Master LLC, RSS Business Holdings LP, SSR Business Holdings LP, RSS 2015 Business Holdings LP, RCT 2015 Business Holdings LP, RCT 2020 Investments LLC, NSDT 2009 STZ LLC, NSDT 2011 STZ LLC, RSS Business Management LLC, SSR Business Management LLC, LES Lauren Holdings LLC, MES Mackenzie Holdings LLC, Abigail Bennett, Zachary Stern, A&Z 2015 Business Holdings LP (subsequently liquidated), Marilyn Sands Master Trust, MAS Business Holdings LP, Sands Family Foundation, Richard Sands, Robert Sands, WildStar Partners LLC, Astra Legacy LLC, AJB Business Holdings LP, and ZMSS Business Holdings LP |
||||
| SEC | Securities and Exchange Commission | ||||
| Second Quarter 2023 | the Company’s three months ended August 31, 2022 |
||||
| Second Quarter 2024 | the Company’s three months ended August 31, 2023 |
||||
| Securities Act | Securities Act of 1933, as amended | ||||
| Six Months 2023 | the Company’s six months ended August 31, 2022 |
||||
| Six Months 2024 | the Company’s six months ended August 31, 2023 |
||||
SOFR |
secured overnight financing rate administered by the Federal Reserve Bank of New York |
||||
| U.S. | United States of America | ||||
| Veracruz | Heroica Veracruz, Veracruz, Mexico | ||||
| Veracruz Brewery | a new brewery being constructed in Veracruz | ||||
| Wine Divestiture | sale of certain mainstream and premium wine brands and related inventory |
||||
Constellation Brands, Inc. Q2 FY 2024 Form 10-Q |
#WORTHREACHINGFOR I iii
|
||||
| FINANCIAL STATEMENTS | |||||
PART I – FINANCIAL INFORMATION
Item 1. Financial Statements.
CONSTELLATION BRANDS, INC. AND SUBSIDIARIES
CONSOLIDATED BALANCE SHEETS
(in millions, except share and per share data)
(unaudited)
| August 31, 2023 |
February 28, 2023 |
||||||||||
| ASSETS | |||||||||||
| Current assets: | |||||||||||
| Cash and cash equivalents | $ |
|
$ | ||||||||
| Accounts receivable |
|
||||||||||
| Inventories |
|
||||||||||
| Prepaid expenses and other |
|
||||||||||
| Total current assets |
|
||||||||||
| Property, plant, and equipment |
|
||||||||||
| Goodwill |
|
||||||||||
| Intangible assets |
|
||||||||||
| Equity method investments |
|
||||||||||
| Deferred income taxes |
|
||||||||||
| Other assets |
|
||||||||||
| Total assets | $ |
|
$ | ||||||||
| LIABILITIES AND STOCKHOLDERS’ EQUITY | |||||||||||
| Current liabilities: | |||||||||||
| Short-term borrowings | $ |
|
$ | ||||||||
| Current maturities of long-term debt |
|
||||||||||
| Accounts payable |
|
||||||||||
| Other accrued expenses and liabilities |
|
||||||||||
| Total current liabilities |
|
||||||||||
| Long-term debt, less current maturities |
|
||||||||||
| Deferred income taxes and other liabilities |
|
||||||||||
| Total liabilities |
|
||||||||||
| Commitments and contingencies | |||||||||||
| CBI stockholders’ equity: | |||||||||||
Class A Stock, $ |
|
||||||||||
| Additional paid-in capital |
|
||||||||||
| Retained earnings |
|
||||||||||
| Accumulated other comprehensive income (loss) |
|
||||||||||
|
|
|||||||||||
| Less: Treasury stock – | |||||||||||
Class A Stock, at cost, |
( |
( |
|||||||||
| Total CBI stockholders’ equity |
|
||||||||||
| Noncontrolling interests |
|
||||||||||
| Total stockholders’ equity |
|
||||||||||
| Total liabilities and stockholders’ equity | $ |
|
$ | ||||||||
The accompanying notes are an integral part of these statements.
| Constellation Brands, Inc. Q2 FY 2024 Form 10-Q |
#WORTHREACHINGFOR I 1
|
||||
| FINANCIAL STATEMENTS | |||||
CONSTELLATION BRANDS, INC. AND SUBSIDIARIES
CONSOLIDATED STATEMENTS OF COMPREHENSIVE INCOME (LOSS)
(in millions, except per share data)
(unaudited)
| For the Six Months Ended August 31, |
For the Three Months Ended August 31, |
||||||||||||||||||||||
| 2023 | 2022 | 2023 | 2022 | ||||||||||||||||||||
| Sales | $ |
|
$ | $ |
|
$ | |||||||||||||||||
| Excise taxes | ( |
( |
( |
( |
|||||||||||||||||||
| Net sales |
|
|
|||||||||||||||||||||
| Cost of product sold | ( |
( |
( |
( |
|||||||||||||||||||
| Gross profit |
|
|
|||||||||||||||||||||
| Selling, general, and administrative expenses | ( |
( |
( |
( |
|||||||||||||||||||
| Operating income (loss) |
|
|
|||||||||||||||||||||
| Income (loss) from unconsolidated investments | ( |
( |
( |
( |
|||||||||||||||||||
| Interest expense | ( |
( |
( |
( |
|||||||||||||||||||
| Loss on extinguishment of debt | ( |
( |
|
( |
|||||||||||||||||||
| Income (loss) before income taxes |
|
( |
|
( |
|||||||||||||||||||
| (Provision for) benefit from income taxes | ( |
( |
( |
( |
|||||||||||||||||||
| Net income (loss) |
|
( |
|
( |
|||||||||||||||||||
| Net (income) loss attributable to noncontrolling interests | ( |
( |
( |
( |
|||||||||||||||||||
| Net income (loss) attributable to CBI | $ |
|
$ | ( |
$ |
|
$ | ( |
|||||||||||||||
| Comprehensive income (loss) | $ |
|
$ | ( |
$ |
|
$ | ( |
|||||||||||||||
| Comprehensive (income) loss attributable to noncontrolling interests | ( |
( |
( |
( |
|||||||||||||||||||
| Comprehensive income (loss) attributable to CBI | $ |
|
$ | ( |
$ |
|
$ | ( |
|||||||||||||||
| Net income (loss) per common share attributable to CBI: | |||||||||||||||||||||||
| Basic – Class A Stock | $ |
|
$ | ( |
$ |
|
$ | ( |
|||||||||||||||
| Basic – Class B Stock | NA | $ | ( |
NA | $ | ( |
|||||||||||||||||
| Diluted – Class A Stock | $ |
|
$ | ( |
$ |
|
$ | ( |
|||||||||||||||
| Diluted – Class B Stock | NA | $ | ( |
NA | $ | ( |
|||||||||||||||||
| Weighted average common shares outstanding: | |||||||||||||||||||||||
| Basic – Class A Stock |
|
|
|||||||||||||||||||||
| Basic – Class B Stock | NA | NA | |||||||||||||||||||||
| Diluted – Class A Stock |
|
|
|||||||||||||||||||||
| Diluted – Class B Stock | NA | NA | |||||||||||||||||||||
| Cash dividends declared per common share: | |||||||||||||||||||||||
| Class A Stock | $ |
|
$ | $ |
|
$ | |||||||||||||||||
| Class B Stock | NA | $ | NA | $ | |||||||||||||||||||
The accompanying notes are an integral part of these statements.
| Constellation Brands, Inc. Q2 FY 2024 Form 10-Q |
#WORTHREACHINGFOR I 2
|
||||
| FINANCIAL STATEMENTS | |||||
|
CONSTELLATION BRANDS, INC. AND SUBSIDIARIES
CONSOLIDATED STATEMENTS OF CHANGES IN STOCKHOLDERS’ EQUITY
(in millions)
(unaudited)
| |||||||||||||||||||||||||||||||||||||||||
|
Class A
Stock
|
Additional Paid-in Capital |
Retained Earnings |
Accumulated Other Comprehensive Income (Loss) |
Treasury Stock |
Non-controlling Interests |
Total | |||||||||||||||||||||||||||||||||||
| Balance at February 28, 2023 | $ |
|
$ |
|
$ |
|
$ |
|
$ | ( |
$ |
|
$ |
|
|||||||||||||||||||||||||||
| Comprehensive income (loss): | |||||||||||||||||||||||||||||||||||||||||
| Net income (loss) | — | — |
|
— | — |
|
|
||||||||||||||||||||||||||||||||||
| Other comprehensive income (loss), net of income tax effect | — | — | — |
|
— |
|
|
||||||||||||||||||||||||||||||||||
| Comprehensive income (loss) |
|
||||||||||||||||||||||||||||||||||||||||
| Repurchase of shares | — | — | — | — | ( |
— | ( |
||||||||||||||||||||||||||||||||||
| Dividends declared | — | — | ( |
— | — | — | ( |
||||||||||||||||||||||||||||||||||
| Noncontrolling interest distributions | — | — | — | — | — | ( |
( |
||||||||||||||||||||||||||||||||||
| Shares issued under equity compensation plans | — |
|
— | — |
|
— |
|
||||||||||||||||||||||||||||||||||
| Stock-based compensation | — |
|
— | — | — | — |
|
||||||||||||||||||||||||||||||||||
| Balance at May 31, 2023 |
|
|
|
|
( |
|
|
||||||||||||||||||||||||||||||||||
| Comprehensive income (loss): | |||||||||||||||||||||||||||||||||||||||||
| Net income (loss) | — | — |
|
— | — |
|
|
||||||||||||||||||||||||||||||||||
| Other comprehensive income (loss), net of income tax effect | — | — | — |
|
— |
|
|
||||||||||||||||||||||||||||||||||
| Comprehensive income (loss) |
|
||||||||||||||||||||||||||||||||||||||||
| Dividends declared | — | — | ( |
— | — | — | ( |
||||||||||||||||||||||||||||||||||
| Noncontrolling interest distributions | — | — | — | — | — | ( |
( |
||||||||||||||||||||||||||||||||||
| Shares issued under equity compensation plans | — |
|
— | — |
|
— |
|
||||||||||||||||||||||||||||||||||
| Stock-based compensation | — |
|
— | — | — | — |
|
||||||||||||||||||||||||||||||||||
| Balance at August 31, 2023 | $ |
|
$ |
|
$ |
|
$ |
|
$ | ( |
$ |
|
$ |
|
|||||||||||||||||||||||||||
| Constellation Brands, Inc. Q2 FY 2024 Form 10-Q |
#WORTHREACHINGFOR I 3
|
||||
| FINANCIAL STATEMENTS | |||||
|
CONSTELLATION BRANDS, INC. AND SUBSIDIARIES
CONSOLIDATED STATEMENTS OF CHANGES IN STOCKHOLDERS’ EQUITY
(in millions)
(unaudited)
| |||||||||||||||||||||||||||||||||||||||||||||||
| Stock | Additional Paid-in Capital |
Retained Earnings |
Accumulated Other Comprehensive Income (Loss) |
Treasury Stock |
Non-controlling Interests |
Total | |||||||||||||||||||||||||||||||||||||||||
| Class A | Class B | ||||||||||||||||||||||||||||||||||||||||||||||
| Balance at February 28, 2022 | $ | $ | $ | $ | $ | ( |
$ | ( |
$ | $ | |||||||||||||||||||||||||||||||||||||
| Comprehensive income (loss): | |||||||||||||||||||||||||||||||||||||||||||||||
| Net income (loss) | — | — | — | — | — | ||||||||||||||||||||||||||||||||||||||||||
| Other comprehensive income (loss), net of income tax effect | — | — | — | — | — | ||||||||||||||||||||||||||||||||||||||||||
| Comprehensive income (loss) | |||||||||||||||||||||||||||||||||||||||||||||||
| Repurchase of shares | — | — | — | — | — | ( |
— | ( |
|||||||||||||||||||||||||||||||||||||||
| Dividends declared | — | — | — | ( |
— | — | — | ( |
|||||||||||||||||||||||||||||||||||||||
| Noncontrolling interest distributions | — | — | — | — | — | — | ( |
( |
|||||||||||||||||||||||||||||||||||||||
| Shares issued under equity compensation plans | — | — | ( |
— | — | — | |||||||||||||||||||||||||||||||||||||||||
| Stock-based compensation | — | — | — | — | — | — | |||||||||||||||||||||||||||||||||||||||||
| Balance at May 31, 2022 | ( |
( |
|||||||||||||||||||||||||||||||||||||||||||||
| Comprehensive income (loss): | |||||||||||||||||||||||||||||||||||||||||||||||
| Net income (loss) | — | — | — | ( |
— | — | ( |
||||||||||||||||||||||||||||||||||||||||
| Other comprehensive income (loss), net of income tax effect | — | — | — | — | ( |
— | ( |
( |
|||||||||||||||||||||||||||||||||||||||
| Comprehensive income (loss) | ( |
||||||||||||||||||||||||||||||||||||||||||||||
| Repurchase of shares | — | — | — | — | — | ( |
— | ( |
|||||||||||||||||||||||||||||||||||||||
| Dividends declared | — | — | — | ( |
— | — | — | ( |
|||||||||||||||||||||||||||||||||||||||
| Noncontrolling interest distributions | — | — | — | — | — | — | ( |
( |
|||||||||||||||||||||||||||||||||||||||
| Shares issued under equity compensation plans | — | — | — | — | — | ||||||||||||||||||||||||||||||||||||||||||
| Stock-based compensation | — | — | — | — | — | — | |||||||||||||||||||||||||||||||||||||||||
| Balance at August 31, 2022 | $ | $ | $ | $ | $ | ( |
$ | ( |
$ | $ | |||||||||||||||||||||||||||||||||||||
The accompanying notes are an integral part of these statements.
| Constellation Brands, Inc. Q2 FY 2024 Form 10-Q |
#WORTHREACHINGFOR I 4
|
||||
| FINANCIAL STATEMENTS | |||||
CONSTELLATION BRANDS, INC. AND SUBSIDIARIES
CONSOLIDATED STATEMENTS OF CASH FLOWS
(in millions)
(unaudited)
| For the Six Months Ended August 31, |
|||||||||||
| 2023 | 2022 | ||||||||||
| CASH FLOWS FROM OPERATING ACTIVITIES | |||||||||||
| Net income (loss) | $ |
|
$ | ( |
|||||||
| Adjustments to reconcile net income (loss) to net cash provided by (used in) operating activities: | |||||||||||
| Unrealized net (gain) loss on securities measured at fair value |
|
||||||||||
| Deferred tax provision (benefit) |
|
||||||||||
| Depreciation |
|
||||||||||
| Stock-based compensation |
|
||||||||||
| Equity in (earnings) losses of equity method investees and related activities, net of distributed earnings |
|
||||||||||
| Noncash lease expense |
|
||||||||||
| Amortization of debt issuance costs and loss on extinguishment of debt |
|
||||||||||
Impairment of equity method investments |
|
||||||||||
| Gain (loss) on settlement of Pre-issuance hedge contracts |
|
||||||||||
| Change in operating assets and liabilities, net of effects from purchase and sale of business: | |||||||||||
| Accounts receivable | ( |
( |
|||||||||
| Inventories |
|
( |
|||||||||
| Prepaid expenses and other current assets | ( |
||||||||||
| Accounts payable | ( |
||||||||||
| Deferred revenue |
|
||||||||||
| Other accrued expenses and liabilities | ( |
( |
|||||||||
| Other |
|
||||||||||
| Total adjustments |
|
||||||||||
| Net cash provided by (used in) operating activities |
|
||||||||||
| CASH FLOWS FROM INVESTING ACTIVITIES | |||||||||||
| Purchase of property, plant, and equipment | ( |
( |
|||||||||
| Purchase of business, net of cash acquired | ( |
( |
|||||||||
| Investments in equity method investees and securities | ( |
( |
|||||||||
| Proceeds from sale of assets |
|
||||||||||
| Proceeds from sale of business |
|
||||||||||
| Other investing activities | ( |
||||||||||
| Net cash provided by (used in) investing activities | ( |
( |
|||||||||
| Constellation Brands, Inc. Q2 FY 2024 Form 10-Q |
#WORTHREACHINGFOR I 5
|
||||
| FINANCIAL STATEMENTS | |||||
CONSTELLATION BRANDS, INC. AND SUBSIDIARIES
CONSOLIDATED STATEMENTS OF CASH FLOWS
(in millions)
(unaudited)
| For the Six Months Ended August 31, |
|||||||||||
| 2023 | 2022 | ||||||||||
| CASH FLOWS FROM FINANCING ACTIVITIES | |||||||||||
| Proceeds from issuance of long-term debt |
|
||||||||||
| Principal payments of long-term debt | ( |
( |
|||||||||
| Net proceeds from (repayments of) short-term borrowings | ( |
||||||||||
| Dividends paid | ( |
( |
|||||||||
| Purchases of treasury stock | ( |
( |
|||||||||
| Proceeds from shares issued under equity compensation plans |
|
||||||||||
| Payments of minimum tax withholdings on stock-based payment awards | ( |
( |
|||||||||
| Payments of debt issuance, debt extinguishment, and other financing costs | ( |
( |
|||||||||
| Distributions to noncontrolling interests | ( |
( |
|||||||||
| Net cash provided by (used in) financing activities | ( |
( |
|||||||||
| Effect of exchange rate changes on cash and cash equivalents |
|
( |
|||||||||
| Net increase (decrease) in cash and cash equivalents | ( |
( |
|||||||||
| Cash and cash equivalents, beginning of period |
|
||||||||||
| Cash and cash equivalents, end of period | $ |
|
$ | ||||||||
| Supplemental disclosures of noncash investing and financing activities | |||||||||||
| Additions to property, plant, and equipment | $ |
|
$ | ||||||||
The accompanying notes are an integral part of these statements.
| Constellation Brands, Inc. Q2 FY 2024 Form 10-Q |
#WORTHREACHINGFOR I 6
|
||||
| FINANCIAL STATEMENTS | NOTES TO CONSOLIDATED FINANCIAL STATEMENTS | |||||||
CONSTELLATION BRANDS, INC. AND SUBSIDIARIES
AUGUST 31, 2023
(unaudited)
1. BASIS OF PRESENTATION
We have prepared the Financial Statements, without audit, pursuant to the rules and regulations of the SEC applicable to quarterly reporting on Form 10-Q and reflect, in our opinion, all adjustments necessary to present fairly our financial information. All such adjustments are of a normal recurring nature. Certain information and footnote disclosures normally included in financial statements, prepared in accordance with generally accepted accounting principles, have been condensed or omitted as permitted by such rules and regulations. These Financial Statements should be read in conjunction with the consolidated financial statements and related notes included in the 2023 Annual Report. Results of operations for interim periods are not necessarily indicative of annual results.
Effective May 31, 2023, we changed our internal management financial reporting to consist of two business divisions: (i) Beer and (ii) Wine and Spirits and we now report our operating results in three segments: (i) Beer, (ii) Wine and Spirits, and (iii) Corporate Operations and Other following the removal of the Canopy operating segment. All financial information for the six months and three months ended August 31, 2022, has been restated to conform to the new segment presentation. For additional information, refer to Note 13.
2. INVENTORIES
Inventories are stated at the lower of cost (primarily computed in accordance with the first-in, first-out method) or net realizable value. Elements of cost include materials, labor, and overhead and consist of the following:
| August 31, 2023 |
February 28, 2023 |
||||||||||
| (in millions) | |||||||||||
| Raw materials and supplies | $ | $ | |||||||||
| In-process inventories | |||||||||||
| Finished case goods | |||||||||||
| $ | $ | ||||||||||
3. DERIVATIVE INSTRUMENTS
Overview
Our risk management and derivative accounting policies are presented in Notes 1 and 6 of our consolidated financial statements included in our 2023 Annual Report and have not changed significantly for the six months and three months ended August 31, 2023.
We have an investment in certain equity securities and other rights which provide us with the option to purchase an additional ownership interest in the equity securities of Canopy (see Note 7). This investment is included in other assets and is accounted for at fair value, with the net gain (loss) from the changes in fair value of this investment recognized in income (loss) from unconsolidated investments (see Note 4). We intend to surrender this investment for cancellation upon completion of the Canopy Transaction and if we elect to convert our Canopy common shares into Exchangeable Shares.
| Constellation Brands, Inc. Q2 FY 2024 Form 10-Q |
#WORTHREACHINGFOR I 7
|
||||
| FINANCIAL STATEMENTS | NOTES TO CONSOLIDATED FINANCIAL STATEMENTS | |||||||
The aggregate notional value of outstanding derivative instruments is as follows:
| August 31, 2023 |
February 28, 2023 |
||||||||||
| (in millions) | |||||||||||
| Derivative instruments designated as hedging instruments | |||||||||||
| Foreign currency contracts | $ | $ | |||||||||
| Derivative instruments not designated as hedging instruments | |||||||||||
| Foreign currency contracts | $ | $ | |||||||||
| Commodity derivative contracts | $ | $ | |||||||||
Credit risk
We are exposed to credit-related losses if the counterparties to our derivative contracts default. This credit risk is limited to the fair value of the derivative contracts. To manage this risk, we contract only with major financial institutions that have earned investment-grade credit ratings and with whom we have standard International Swaps and Derivatives Association agreements which allow for net settlement of the derivative contracts. We have also established counterparty credit guidelines that are regularly monitored. Because of these safeguards, we believe the risk of loss from counterparty default to be immaterial.
In addition, our derivative instruments are not subject to credit rating contingencies or collateral requirements. As of August 31, 2023, the estimated fair value of derivative instruments in a net liability position due to counterparties was $1.7 million. If we were required to settle the net liability position under these derivative instruments on August 31, 2023, we would have had sufficient available liquidity on hand to satisfy this obligation.
Results of period derivative activity
The estimated fair value and location of our derivative instruments on our balance sheets are as follows (see Note 4):
| Assets | Liabilities | |||||||||||||||||||||||||
| August 31, 2023 |
February 28, 2023 |
August 31, 2023 |
February 28, 2023 |
|||||||||||||||||||||||
| (in millions) | ||||||||||||||||||||||||||
| Derivative instruments designated as hedging instruments | ||||||||||||||||||||||||||
| Foreign currency contracts: | ||||||||||||||||||||||||||
| Prepaid expenses and other | $ | $ | Other accrued expenses and liabilities | $ | $ | |||||||||||||||||||||
| Other assets | $ | $ | Deferred income taxes and other liabilities | $ | $ | |||||||||||||||||||||
| Derivative instruments not designated as hedging instruments | ||||||||||||||||||||||||||
| Foreign currency contracts: | ||||||||||||||||||||||||||
| Prepaid expenses and other | $ | $ | Other accrued expenses and liabilities | $ | $ | |||||||||||||||||||||
| Commodity derivative contracts: | ||||||||||||||||||||||||||
| Prepaid expenses and other | $ | $ | Other accrued expenses and liabilities | $ | $ | |||||||||||||||||||||
| Other assets | $ | $ | Deferred income taxes and other liabilities | $ | $ | |||||||||||||||||||||
| Constellation Brands, Inc. Q2 FY 2024 Form 10-Q |
#WORTHREACHINGFOR I 8
|
||||
| FINANCIAL STATEMENTS | NOTES TO CONSOLIDATED FINANCIAL STATEMENTS | |||||||
The principal effect of our derivative instruments designated in cash flow hedging relationships on our results of operations, as well as OCI, net of income tax effect, is as follows:
| Derivative Instruments in Designated Cash Flow Hedging Relationships |
Net Gain (Loss) Recognized in OCI |
Location of Net Gain (Loss) Reclassified from AOCI to Income (Loss) |
Net Gain (Loss) Reclassified from AOCI to Income (Loss) |
|||||||||||||||||
| (in millions) | ||||||||||||||||||||
| For the Six Months Ended August 31, 2023 | ||||||||||||||||||||
| Foreign currency contracts | $ | Sales | $ | ( |
||||||||||||||||
| Cost of product sold | ||||||||||||||||||||
| Pre-issuance hedge contracts | Interest expense | ( |
||||||||||||||||||
| $ | $ | |||||||||||||||||||
| For the Six Months Ended August 31, 2022 | ||||||||||||||||||||
| Foreign currency contracts | $ | Sales | $ | ( |
||||||||||||||||
| Cost of product sold | ||||||||||||||||||||
| Pre-issuance hedge contracts | Interest expense | ( |
||||||||||||||||||
| $ | $ | |||||||||||||||||||
| For the Three Months Ended August 31, 2023 | ||||||||||||||||||||
| Foreign currency contracts | $ | Sales | $ | ( |
||||||||||||||||
| Cost of product sold | ||||||||||||||||||||
| Pre-issuance hedge contracts | Interest expense | ( |
||||||||||||||||||
| $ | $ | |||||||||||||||||||
| For the Three Months Ended August 31, 2022 | ||||||||||||||||||||
| Foreign currency contracts | $ | ( |
Sales | $ | ( |
|||||||||||||||
| Cost of product sold | ||||||||||||||||||||
| Pre-issuance hedge contracts | Interest expense | ( |
||||||||||||||||||
| $ | ( |
$ | ||||||||||||||||||
We expect $130.3 million of net gains, net of income tax effect, to be reclassified from AOCI to our results of operations within the next 12 months.
The effect of our undesignated derivative instruments on our results of operations is as follows:
| Derivative Instruments Not Designated as Hedging Instruments |
Location of Net Gain (Loss) Recognized in Income (Loss) |
Net Gain (Loss) Recognized in Income (Loss) |
||||||||||||||||||
| (in millions) | ||||||||||||||||||||
| For the Six Months Ended August 31, 2023 | ||||||||||||||||||||
| Commodity derivative contracts | Cost of product sold | $ | ( |
|||||||||||||||||
| Foreign currency contracts | Selling, general, and administrative expenses | |||||||||||||||||||
| $ | ||||||||||||||||||||
| Constellation Brands, Inc. Q2 FY 2024 Form 10-Q |
#WORTHREACHINGFOR I 9
|
||||
| FINANCIAL STATEMENTS | NOTES TO CONSOLIDATED FINANCIAL STATEMENTS | |||||||
| Derivative Instruments Not Designated as Hedging Instruments |
Location of Net Gain (Loss) Recognized in Income (Loss) |
Net Gain (Loss) Recognized in Income (Loss) |
||||||||||||||||||
| (in millions) | ||||||||||||||||||||
| For the Six Months Ended August 31, 2022 | ||||||||||||||||||||
| Commodity derivative contracts | Cost of product sold | $ | ||||||||||||||||||
| Foreign currency contracts | Selling, general, and administrative expenses | ( |
||||||||||||||||||
| $ | ||||||||||||||||||||
| For the Three Months Ended August 31, 2023 | ||||||||||||||||||||
| Commodity derivative contracts | Cost of product sold | $ | ||||||||||||||||||
| Foreign currency contracts | Selling, general, and administrative expenses | |||||||||||||||||||
| $ | ||||||||||||||||||||
| For the Three Months Ended August 31, 2022 | ||||||||||||||||||||
| Commodity derivative contracts | Cost of product sold | $ | ( |
|||||||||||||||||
| Foreign currency contracts | Selling, general, and administrative expenses | ( |
||||||||||||||||||
| $ | ( |
|||||||||||||||||||
4. FAIR VALUE OF FINANCIAL INSTRUMENTS
Authoritative guidance establishes a framework for measuring fair value, including a hierarchy for inputs used in measuring fair value that maximizes the use of observable inputs and minimizes the use of unobservable inputs by requiring that the most observable inputs be used when available. The hierarchy includes three levels:
•Level 1 inputs are quoted prices in active markets for identical assets or liabilities;
•Level 2 inputs include data points that are observable such as quoted prices for similar assets or liabilities in active markets, quoted prices for identical assets or similar assets or liabilities in markets that are not active, and inputs (other than quoted prices) such as volatility, interest rates, and yield curves that are observable for the asset or liability, either directly or indirectly; and
•Level 3 inputs are unobservable data points for the asset or liability, and include situations where there is little, if any, market activity for the asset or liability.
Fair value methodology
The following methods and assumptions are used to estimate the fair value of our financial instruments:
Foreign currency and commodity derivative contracts
The fair value is estimated using market-based inputs, obtained from independent pricing services, entered into valuation models. These valuation models require various inputs, including contractual terms, market foreign exchange prices, market commodity prices, interest-rate yield curves, and currency volatilities, as applicable (Level 2 fair value measurement).
Interest rate swap and Pre-issuance hedge contracts
The fair value is estimated based on quoted market prices from respective counterparties. Quotes are corroborated by using discounted cash flow calculations based upon forward interest-rate yield curves, which are obtained from independent pricing services (Level 2 fair value measurement).
Canopy investment
In April 2023, we extended the maturity of the remaining C$100.0 million principal amount of our Canopy Debt Securities by exchanging them for the 2023 Canopy Promissory Note. As such, our investment in Canopy is comprised of the (i) Canopy Equity Method Investment, (ii) November 2018 Canopy Warrants, and (iii) 2023
| Constellation Brands, Inc. Q2 FY 2024 Form 10-Q |
#WORTHREACHINGFOR I 10
|
||||
| FINANCIAL STATEMENTS | NOTES TO CONSOLIDATED FINANCIAL STATEMENTS | |||||||
Canopy Promissory Note. The November 2018 Canopy Warrants and the 2023 Canopy Promissory Note are measured at fair value. Effective as of May 31, 2023, we determined that neither of these instruments had future economic value given Canopy’s stock price relative to the exercise price of the warrants and the substantial doubt about Canopy’s ability to continue as a going concern, as disclosed by Canopy, prior to the maturity of the note. Accordingly, the fair value of the remaining balances for these instruments were determined to be zero
Short-term borrowings
Our short-term borrowings consist of our commercial paper program and the revolving credit facility under our senior credit facility. The revolving credit facility is a variable interest rate bearing note with a fixed margin, adjustable based upon our debt rating (as defined in our senior credit facility). For these short-term borrowings, the carrying value approximates the fair value.
Long-term debt
The fair value of our fixed interest rate long-term debt is estimated by discounting cash flows using interest rates currently available for debt with similar terms and maturities (Level 2 fair value measurement). As of August 31, 2023, the carrying amount of long-term debt, including the current portion, was $11,239.1 million, compared with an estimated fair value of $10,311.8 million. As of February 28, 2023, the carrying amount of long-term debt, including the current portion, was $11,296.0 million, compared with an estimated fair value of $10,236.0 million.
The carrying amounts of certain of our financial instruments, including cash and cash equivalents, accounts receivable, and accounts payable, approximate fair value as of August 31, 2023, and February 28, 2023, due to the relatively short maturity of these instruments.
Recurring basis measurements
The following table presents our financial assets and liabilities measured at estimated fair value on a recurring basis:
| Fair Value Measurements Using | |||||||||||||||||||||||
| Quoted Prices in Active Markets (Level 1) |
Significant Other Observable Inputs (Level 2) |
Significant Unobservable Inputs (Level 3) |
Total | ||||||||||||||||||||
| (in millions) | |||||||||||||||||||||||
| August 31, 2023 | |||||||||||||||||||||||
| Assets: | |||||||||||||||||||||||
| Foreign currency contracts | $ | $ | $ | $ | |||||||||||||||||||
| Commodity derivative contracts | $ | $ | $ | $ | |||||||||||||||||||
| Liabilities: | |||||||||||||||||||||||
| Foreign currency contracts | $ | $ | $ | $ | |||||||||||||||||||
| Commodity derivative contracts | $ | $ | $ | $ | |||||||||||||||||||
| Constellation Brands, Inc. Q2 FY 2024 Form 10-Q |
#WORTHREACHINGFOR I 11
|
||||
| FINANCIAL STATEMENTS | NOTES TO CONSOLIDATED FINANCIAL STATEMENTS | |||||||
| Fair Value Measurements Using | |||||||||||||||||||||||
| Quoted Prices in Active Markets (Level 1) |
Significant Other Observable Inputs (Level 2) |
Significant Unobservable Inputs (Level 3) |
Total | ||||||||||||||||||||
| (in millions) | |||||||||||||||||||||||
| February 28, 2023 | |||||||||||||||||||||||
| Assets: | |||||||||||||||||||||||
| Foreign currency contracts | $ | $ | $ | $ | |||||||||||||||||||
| Commodity derivative contracts | $ | $ | $ | $ | |||||||||||||||||||
| November 2018 Canopy Warrants | $ | $ | $ | $ | |||||||||||||||||||
| Canopy Debt Securities | $ | $ | $ | $ | |||||||||||||||||||
| Liabilities: | |||||||||||||||||||||||
| Foreign currency contracts | $ | $ | $ | $ | |||||||||||||||||||
| Commodity derivative contracts | $ | $ | $ | $ | |||||||||||||||||||
Nonrecurring basis measurements
The following table presents our assets and liabilities measured at estimated fair value on a nonrecurring basis for which an impairment assessment was performed for the periods presented:
| Fair Value Measurements Using | |||||||||||||||||||||||
| Quoted Prices in Active Markets (Level 1) |
Significant Other Observable Inputs (Level 2) |
Significant Unobservable Inputs (Level 3) |
Total Losses | ||||||||||||||||||||
| (in millions) | |||||||||||||||||||||||
| For the Six Months Ended August 31, 2023 | |||||||||||||||||||||||
Equity method investments (1)
|
$ | $ | $ | $ | |||||||||||||||||||
| For the Six Months Ended August 31, 2022 | |||||||||||||||||||||||
| Equity method investments | $ | $ | $ | $ | |||||||||||||||||||
(1)As of August 31, 2023, the carrying value of the Canopy Equity Method Investment exceeded the fair value (Level 1 fair value measurement). We evaluated and determined there was not an other-than-temporary impairment. Our conclusion was based primarily on the period of time for which the fair value had been less than the carrying value, including Canopy’s stock price recovery above our carrying value following quarter-end. We will continue to evaluate the Canopy Equity Method Investment for an other-than-temporary impairment.
Equity method investments
As of August 31, 2023, we evaluated certain equity method investments, made through our corporate venture capital function, and determined there were other-than-temporary impairments due to business underperformance. Investments with a carrying value of $14.9 million were written down to an estimated fair value of $2.6 million, resulting in an impairment of $12.3
We evaluated the Canopy Equity Method Investment as of May 31, 2023, and determined there was an other-than-temporary impairment. Our conclusion was based on several contributing factors, including: (i) the fair value being less than the carrying value and the uncertainty surrounding Canopy’s stock price recovering in the
| Constellation Brands, Inc. Q2 FY 2024 Form 10-Q |
#WORTHREACHINGFOR I 12
|
||||
| FINANCIAL STATEMENTS | NOTES TO CONSOLIDATED FINANCIAL STATEMENTS | |||||||
near-term, (ii) Canopy recorded significant costs in its fourth quarter of fiscal 2023 results designed to align its Canadian cannabis operations and resources in response to continued unfavorable market trends, (iii) the substantial doubt about Canopy’s ability to continue as a going concern, as disclosed by Canopy, and (iv) Canopy’s identification of material misstatements in certain of its previously reported financial results related to sales in its BioSteel reporting unit that were accounted for incorrectly, including the recording of a goodwill impairment during its restated second quarter of fiscal 2023. As a result, the Canopy Equity Method Investment with a carrying value of $266.2 million was written down to its estimated fair value of $142.7 million, resulting in an impairment of $123.5 million. This loss from impairment was included in income (loss) from unconsolidated investments within our consolidated results for the six months ended August 31, 2023. The estimated fair value was determined based on the closing price of the underlying equity security as of May 31, 2023.
We evaluated the Canopy Equity Method Investment as of August 31, 2022, and determined there was an other-than-temporary impairment based on several contributing factors, including: (i) the period of time for which the fair value had been less than the carrying value and the uncertainty surrounding Canopy’s stock price recovering in the near-term, (ii) Canopy recording a significant impairment of goodwill related to its cannabis operations during its three months ended June 30, 2022, and (iii) the uncertainty of U.S. federal cannabis permissibility. As a result, the Canopy Equity Method Investment with a carrying value of $1,695.1 million was written down to its estimated fair value of $634.8 million, resulting in an impairment of $1,060.3
5. GOODWILL
The changes in the carrying amount of goodwill are as follows:
| Beer | Wine and Spirits | Consolidated | |||||||||||||||
| (in millions) | |||||||||||||||||
| Balance, February 28, 2022 | $ | $ | $ | ||||||||||||||
Purchase accounting allocations (1)
|
|||||||||||||||||
| Wine Divestiture | ( |
( |
|||||||||||||||
| Foreign currency translation adjustments | ( |
||||||||||||||||
| Balance, February 28, 2023 | |||||||||||||||||
Purchase accounting allocations (2)
|
|||||||||||||||||
| Foreign currency translation adjustments | ( |
||||||||||||||||
| Balance, August 31, 2023 | $ | $ | $ | ||||||||||||||
(1)Purchase accounting allocations associated with the acquisitions of Austin Cocktails, Lingua Franca, and My Favorite Neighbor, LLC.
(2)Preliminary purchase accounting allocation associated with the June 2023 acquisition of the Domaine Curry wine brand.
Divestitures
Craft Beer Divestitures
In June 2023, we completed the Craft Beer Divestitures. Prior to the Craft Beer Divestitures, we recorded the results of operations of such craft beer brands in the Beer segment.
Wine Divestiture
On October 6, 2022, we sold certain of our mainstream and premium wine brands and related inventory. The net cash proceeds from the Wine Divestiture were utilized primarily to reduce outstanding borrowings. Prior to the Wine Divestiture, we recorded the results of operations of these brands in the Wine and Spirits segment.
| Constellation Brands, Inc. Q2 FY 2024 Form 10-Q |
#WORTHREACHINGFOR I 13
|
||||
| FINANCIAL STATEMENTS | NOTES TO CONSOLIDATED FINANCIAL STATEMENTS | |||||||
Acquisitions
Austin Cocktails
In April 2022, we acquired the remaining 73 % ownership interest in Austin Cocktails, which included a portfolio of small batch, RTD cocktails. This transaction primarily included the acquisition of goodwill and a trademark. In addition, the purchase price for Austin Cocktails includes an earn-out over five years based on performance. The results of operations of Austin Cocktails are reported in the Wine and Spirits segment and have been included in our consolidated results of operations from the date of acquisition.
Lingua Franca
In March 2022, we acquired the Lingua Franca business, including a collection of Oregon-based luxury wines, a vineyard, and a production facility. This transaction also included the acquisition of a trademark and inventory. In addition, the purchase price for Lingua Franca includes an earn-out over seven years based on performance. The results of operations of Lingua Franca are reported in the Wine and Spirits segment and have been included in our consolidated results of operations from the date of acquisition.
6. INTANGIBLE ASSETS
The major components of intangible assets are as follows:
| August 31, 2023 | February 28, 2023 | ||||||||||||||||||||||
| Gross Carrying Amount |
Net Carrying Amount |
Gross Carrying Amount |
Net Carrying Amount |
||||||||||||||||||||
| (in millions) | |||||||||||||||||||||||
| Amortizable intangible assets | |||||||||||||||||||||||
| Customer relationships | $ | $ | $ | $ | |||||||||||||||||||
| Other | |||||||||||||||||||||||
| Total | $ | $ | |||||||||||||||||||||
| Nonamortizable intangible assets | |||||||||||||||||||||||
| Trademarks | |||||||||||||||||||||||
| Total intangible assets | $ | $ | |||||||||||||||||||||
We did not incur costs to renew or extend the term of acquired intangible assets for the six months and three months ended August 31, 2023, and August 31, 2022. Net carrying amount represents the gross carrying value net of accumulated amortization.
7. EQUITY METHOD INVESTMENTS
Our equity method investments are as follows:
| August 31, 2023 | February 28, 2023 | ||||||||||||||||||||||
| Carrying Value | Ownership Percentage | Carrying Value | Ownership Percentage | ||||||||||||||||||||
| (in millions) | |||||||||||||||||||||||
Canopy Equity Method Investment (1)
|
$ | % | $ | % | |||||||||||||||||||
| Other equity method investments | |||||||||||||||||||||||
| $ | $ | ||||||||||||||||||||||
(1)The fair value based on the closing price of the underlying equity security as of August 31, 2023, and February 28, 2023, was $97.8 million and $398.4 million, respectively.
| Constellation Brands, Inc. Q2 FY 2024 Form 10-Q |
#WORTHREACHINGFOR I 14
|
||||
| FINANCIAL STATEMENTS | NOTES TO CONSOLIDATED FINANCIAL STATEMENTS | |||||||
Canopy Equity Method Investment
We have an investment in Canopy, a provider of medical and adult-use cannabis products. The Canopy Equity Method Investment consists of 171.5 million Canopy common shares. Equity in earnings (losses) from the Canopy Equity Method Investment and related activities is determined by recording the effect of basis differences. Amounts included in our consolidated results of operations for each period are as follows:
| For the Six Months Ended August 31, |
For the Three Months Ended August 31, |
||||||||||||||||||||||
| 2023 | 2022 | 2023 | 2022 | ||||||||||||||||||||
| (in millions) | |||||||||||||||||||||||
| Equity in earnings (losses) from Canopy and related activities | $ | ( |
$ | ( |
$ | ( |
$ | ( |
|||||||||||||||
Plan to convert Canopy common stock ownership
In October 2022, we entered into a Consent Agreement with Canopy pursuant to which we have provided our consent, subject to certain conditions, to the Canopy Transaction. Canopy only holds non-voting and non-participating exchangeable shares of Canopy USA which are convertible into Class B shares of Canopy USA. A third-party investor holds 100 % of the common shares of Canopy USA.
In connection with the Canopy Transaction, Canopy has proposed to amend its share capital to (i) create Exchangeable Shares and (ii) restate the rights of Canopy common shares to provide for their conversion into Exchangeable Shares through the Canopy Amendment. Canopy has stated its intention to hold a special meeting of its shareholders to consider the Canopy Amendment. We have entered into a voting support agreement with Canopy to vote in favor of the Canopy Amendment.
If the Canopy Transaction is completed and the Canopy Amendment is authorized by Canopy’s shareholders and adopted by Canopy, we intend, subject to a final decision in our sole discretion, to exercise our right to convert our Canopy common shares into Exchangeable Shares.
Assuming the completion of the Canopy Transaction and the transactions contemplated by the Consent Agreement and that we elect to convert our Canopy common shares into Exchangeable Shares:
•we intend to surrender our November 2018 Canopy Warrants to Canopy for cancellation;
•we will only have an interest in Exchangeable Shares, which are non-voting and non-participating securities, and our 2023 Canopy Promissory Note (for which we intend to negotiate an exchange of the principal amount for Exchangeable Shares, although neither we nor Canopy has any binding obligation to do so);
•we intend to terminate all legacy agreements and commercial arrangements between ourselves and Canopy, including the investor rights agreement but excluding the Consent Agreement and certain termination agreements;
•we will have no further governance rights in relation to Canopy, including rights to nominate members to the board of directors of Canopy, or approval rights related to certain transactions;
•all of our nominees will resign from the board of directors of Canopy; and
•as our investment in Canopy common shares makes up our Canopy Equity Method Investment, we expect to no longer apply the equity method to our investment in Canopy, which we expect to instead be accounted for at fair value with changes reported in income (loss) from unconsolidated investments within our consolidated results.
If we do not convert our Canopy common shares into Exchangeable Shares:
•Canopy and its subsidiaries will not be permitted to exercise any rights to acquire shares and interests in entities carrying on cannabis-related business in the U.S.;
•Canopy USA will be required to exercise its repurchase rights to acquire the interests in Canopy USA held by its third-party investors; and
| Constellation Brands, Inc. Q2 FY 2024 Form 10-Q |
#WORTHREACHINGFOR I 15
|
||||
| FINANCIAL STATEMENTS | NOTES TO CONSOLIDATED FINANCIAL STATEMENTS | |||||||
8. BORROWINGS
Borrowings consist of the following:
| August 31, 2023 | February 28, 2023 |
||||||||||||||||||||||
| Current | Long-term | Total | Total | ||||||||||||||||||||
| (in millions) | |||||||||||||||||||||||
| Short-term borrowings | |||||||||||||||||||||||
| Commercial paper | $ | $ | |||||||||||||||||||||
| $ | $ | ||||||||||||||||||||||
| Long-term debt | |||||||||||||||||||||||
| Term loan credit facilities | $ | $ | $ | $ | |||||||||||||||||||
| Senior notes | |||||||||||||||||||||||
| Other | |||||||||||||||||||||||
| $ | $ | $ | $ | ||||||||||||||||||||
Bank facilities
The Company, CB International, the Administrative Agent, and certain other lenders are parties to the 2022 Credit Agreement. The Company, the Administrative Agent, and certain lenders were also parties to two term credit agreements. In May 2023, we repaid the outstanding three-year term loan facility borrowings under our August 2022 Term Credit Agreement with proceeds from the May 2023 Senior Notes (see “Senior notes” below). In August 2023, we repaid the outstanding five-year term loan facility borrowings under our April 2022 Term Credit Agreement with proceeds from commercial paper borrowings.
In October 2022, the Company, CB International, the Administrative Agent, and certain other lenders agreed to amend the 2022 Credit Agreement. The October 2022 Credit Agreement Amendment revises certain defined terms and covenants and will become effective upon (i) the amendment by Canopy of its Articles of Incorporation, (ii) the conversion of our Canopy common shares into Exchangeable Shares, and (iii) the resignation of our nominees from the board of directors of Canopy.
As of August 31, 2023, information with respect to borrowings under the 2022 Credit Agreement is as follows:
| Outstanding borrowings |
Interest rate |
SOFR margin |
Outstanding letters of credit |
Remaining
borrowing
capacity (1)
|
|||||||||||||||||||||||||
| (in millions) | |||||||||||||||||||||||||||||
| 2022 Credit Agreement | |||||||||||||||||||||||||||||
Revolving credit facility (2) (3)
|
$ | % | % | $ | $ | ||||||||||||||||||||||||
(1)Net of outstanding revolving credit facility borrowings and outstanding letters of credit under the 2022 Credit Agreement and outstanding borrowings under our commercial paper program of $468.0 million (excluding unamortized discount) (see “Commercial paper program” below).
(2)Contractual interest rate varies based on our debt rating (as defined in the agreement) and is a function of SOFR plus a margin and a credit spread adjustment, or the base rate plus a margin, or, in certain circumstances where SOFR cannot be adequately ascertained or available, an alternative benchmark rate plus a margin.
(3)We and/or CB International are the borrower under the $2,250.0 million revolving credit facility with a maturity date of April 14, 2027. Includes a sub-facility for letters of credit of up to $200.0 million.
| Constellation Brands, Inc. Q2 FY 2024 Form 10-Q |
#WORTHREACHINGFOR I 16
|
||||
| FINANCIAL STATEMENTS | NOTES TO CONSOLIDATED FINANCIAL STATEMENTS | |||||||
We and our subsidiaries are subject to covenants that are contained in the 2022 Credit Agreement, including those restricting the incurrence of additional subsidiary indebtedness, additional liens, mergers and consolidations, transactions with affiliates, and sale and leaseback transactions, in each case subject to numerous conditions, exceptions, and thresholds. The financial covenants are limited to a minimum interest coverage ratio and a maximum net leverage ratio.
Commercial paper program
We have a commercial paper program which provides for the issuance of up to an aggregate principal amount of $2.25 billion of commercial paper. Our commercial paper program is backed by unused commitments under our revolving credit facility under our 2022 Credit Agreement. Accordingly, outstanding borrowings under our commercial paper program reduce the amount available under our revolving credit facility. As of August 31, 2023, we had $467.4 million of outstanding borrowings, net of unamortized discount, under our commercial paper program with a weighted average annual interest rate of 5.8 % and a weighted average remaining term of nine days .
Senior notes
In May 2023, we issued $750.0 million aggregate principal amount of 4.90 % senior notes due May 2033. Proceeds from this offering, net of discount and debt issuance costs, were $739.8 million. Interest on the 4.90 % May 2023 Senior Notes is payable semiannually on May 1 and November 1 of each year, beginning November 1, 2023. The 4.90 % May 2023 Senior Notes are redeemable, in whole or in part, at our option at any time prior to February 1, 2033, at a redemption price equal to 100 % of the outstanding principal amount, plus accrued and unpaid interest and a make-whole payment based on the present value of the future payments at the adjusted treasury rate, as defined in the applicable indenture, plus 25 basis points. On or after February 1, 2033, we may redeem the 4.90 % May 2023 Senior Notes, in whole or in part, at our option at any time at a redemption price equal to 100 % of the outstanding principal amount, plus accrued and unpaid interest. The 4.90 % May 2023 Senior Notes are senior unsecured obligations which rank equally in right of payment to all of our existing and future senior unsecured indebtedness.
Debt payments
As of August 31, 2023, the required principal repayments under long-term debt obligations (excluding unamortized debt issuance costs and unamortized discounts of $59.1 million and $24.5 million, respectively) for the remaining six months of Fiscal 2024 and for each of the five succeeding fiscal years and thereafter are as follows:
| (in millions) | |||||
| Fiscal 2024 | $ | ||||
| Fiscal 2025 | |||||
| Fiscal 2026 | |||||
| Fiscal 2027 | |||||
| Fiscal 2028 | |||||
| Fiscal 2029 | |||||
| Thereafter | |||||
| $ | |||||
9. INCOME TAXES
Our effective tax rate for the six months ended August 31, 2023, and August 31, 2022, was 22.1 % and (53.3 )%, respectively. Our effective tax rate for the three months ended August 31, 2023, and August 31, 2022, was 17.4 % and (13.1 )%, respectively.
For the six months ended August 31, 2023, our effective tax rate was higher than the federal statutory rate of 21% primarily due to an increase in the valuation allowance related to our investment in Canopy, partially offset
| Constellation Brands, Inc. Q2 FY 2024 Form 10-Q |
#WORTHREACHINGFOR I 17
|
||||
| FINANCIAL STATEMENTS | NOTES TO CONSOLIDATED FINANCIAL STATEMENTS | |||||||
by (i) the benefit of lower effective tax rates applicable to our foreign businesses and (ii) a net income tax benefit recognized as a result of a change in tax entity classification.
For the three months ended August 31, 2023, our effective tax rate was lower than the federal statutory rate of 21% primarily due to the benefit of lower effective tax rates applicable to our foreign businesses.
For the six months and three months ended August 31, 2022, our effective tax rate did not approximate the federal statutory rate of 21% primarily due an increase in the valuation allowance related to our investment in Canopy, partially offset by a net income tax benefit recognized from the realization of tax losses related to a prior period divestiture.
10. STOCKHOLDERS’ EQUITY
Common stock
The number of shares of common stock issued and treasury stock, and associated share activity, are as follows:
| Common Stock | Treasury Stock | ||||||||||||||||||||||||||||
| Class A |
Class B (1)
|
Class 1 | Class A |
Class B (1)
|
|||||||||||||||||||||||||
| Balance at February 28, 2023 | |||||||||||||||||||||||||||||
| Share repurchases | — | — | — | — | |||||||||||||||||||||||||
| Conversion of shares | — | ( |
— | — | |||||||||||||||||||||||||
| Exercise of stock options | — | — | ( |
— | |||||||||||||||||||||||||
Vesting of restricted stock units (2)
|
— | — | — | ( |
— | ||||||||||||||||||||||||
Vesting of performance share units (2)
|
— | — | — | ( |
— | ||||||||||||||||||||||||
| Balance at May 31, 2023 | |||||||||||||||||||||||||||||
| Conversion of shares | — | ( |
— | — | |||||||||||||||||||||||||
| Exercise of stock options | — | — | ( |
— | |||||||||||||||||||||||||
| Employee stock purchases | — | — | — | ( |
— | ||||||||||||||||||||||||
Vesting of restricted stock units (2)
|
— | — | — | ( |
— | ||||||||||||||||||||||||
| Balance at August 31, 2023 | |||||||||||||||||||||||||||||
| Balance at February 28, 2022 | |||||||||||||||||||||||||||||
| Share repurchases | — | — | — | — | |||||||||||||||||||||||||
| Conversion of shares | ( |
— | — | — | |||||||||||||||||||||||||
| Exercise of stock options | — | — | ( |
— | |||||||||||||||||||||||||
Vesting of restricted stock units (2)
|
— | — | — | ( |
— | ||||||||||||||||||||||||
Vesting of performance share units (2)
|
— | — | — | ( |
— | ||||||||||||||||||||||||
| Balance at May 31, 2022 | |||||||||||||||||||||||||||||
| Share repurchases | — | — | — | — | |||||||||||||||||||||||||
| Conversion of shares | — | ( |
— | — | |||||||||||||||||||||||||
| Exercise of stock options | — | — | — | ( |
— | ||||||||||||||||||||||||
| Employee stock purchases | — | — | — | ( |
— | ||||||||||||||||||||||||
Vesting of restricted stock units (2)
|
— | — | — | ( |
— | ||||||||||||||||||||||||
| Balance at August 31, 2022 | |||||||||||||||||||||||||||||
(1)Prior to the Reclassification, we had an additional class of common stock with a material number of shares outstanding: Class B Stock. Shares of Class B Stock were convertible into shares of Class A Stock on a one-to-one basis at any time at the option of the holder. In November 2022, we completed the Reclassification at the Effective Time as contemplated by the Reclassification Agreement. Pursuant to the Reclassification, each share of Class B Stock issued and outstanding immediately prior to the Effective Time was reclassified, exchanged, and converted into one share of Class A Stock and the right to receive $64.64 in cash, without interest. The aggregate cash payment to holders of Class B Stock at the Effective Time was $1.5 billion.
| Constellation Brands, Inc. Q2 FY 2024 Form 10-Q |
#WORTHREACHINGFOR I 18
|
||||
| FINANCIAL STATEMENTS | NOTES TO CONSOLIDATED FINANCIAL STATEMENTS | |||||||
| For the Three Months Ended May 31, |
For the Three Months Ended August 31, |
For the Six Months Ended August 31, |
|||||||||||||||
| 2023 | |||||||||||||||||
| Restricted Stock Units | |||||||||||||||||
| Performance Share Units | |||||||||||||||||
| 2022 | |||||||||||||||||
| Restricted Stock Units | |||||||||||||||||
| Performance Share Units | |||||||||||||||||
Stock repurchases
In January 2021, our Board of Directors authorized the repurchase of up to $2.0 billion of our publicly traded common stock. The Board of Directors did not specify a date upon which this authorization would expire. Shares repurchased under the 2021 Authorization become treasury shares. For the six months ended August 31, 2023, we repurchased 153,937 shares of Class A Stock through open market transactions pursuant to this authorization at an aggregate cost of $35.0 million.
As of August 31, 2023, total shares repurchased under this authorization are as follows:
Class A Stock |
|||||||||||||||||
| Repurchase Authorization |
Dollar Value of Shares Repurchased |
Number of Shares Repurchased |
|||||||||||||||
| (in millions, except share data) | |||||||||||||||||
| 2021 Authorization | $ | $ | |||||||||||||||
11. NET INCOME (LOSS) PER COMMON SHARE ATTRIBUTABLE TO CBI
For the six months and three months ended August 31, 2023, net income (loss) per common share – basic for Class A Stock has been computed based on the weighted average shares of common stock outstanding during the period. Net income (loss) per common share – diluted for Class A Stock reflects the weighted average shares of common stock plus the effect of dilutive securities outstanding during the period using the treasury stock method. The effect of dilutive securities includes the impact of outstanding stock-based awards. The dilutive computation does not assume conversion, exercise, or contingent issuance of securities that would have an anti-dilutive effect on the net income (loss) per common share attributable to CBI. The computation of basic and diluted net income (loss) per common share for Class A Stock are as follows:
| For the Six Months Ended August 31, 2023 | For the Three Months Ended August 31, 2023 | ||||||||||
| (in millions, except per share data) | |||||||||||
| Net income (loss) attributable to CBI | $ | $ | |||||||||
| Weighted average common shares outstanding – basic | |||||||||||
| Stock-based awards, primarily stock options | |||||||||||
| Weighted average common shares outstanding – diluted | |||||||||||
| Net income (loss) per common share attributable to CBI – basic | $ | $ | |||||||||
| Net income (loss) per common share attributable to CBI – diluted | $ | $ | |||||||||
For the six months and three months ended August 31, 2022, net income (loss) per common share – diluted for Class A Stock and Class B Stock has been computed using the two-class method. The computation of basic and diluted net income (loss) per common share are as follows:
| Constellation Brands, Inc. Q2 FY 2024 Form 10-Q |
#WORTHREACHINGFOR I 19
|
||||
| FINANCIAL STATEMENTS | NOTES TO CONSOLIDATED FINANCIAL STATEMENTS | |||||||
| For the Six Months Ended August 31, 2022 | For the Three Months Ended August 31, 2022 | ||||||||||||||||||||||
| Class A Stock | Class B Stock | Class A Stock | Class B Stock | ||||||||||||||||||||
| (in millions, except per share data) | |||||||||||||||||||||||
| Net income (loss) attributable to CBI allocated – basic | $ | ( |
$ | ( |
$ | ( |
$ | ( |
|||||||||||||||
| Conversion of Class B common shares into Class A common shares | |||||||||||||||||||||||
| Effect of stock-based awards on allocated net income (loss) | |||||||||||||||||||||||
| Net income (loss) attributable to CBI allocated – diluted | $ | ( |
$ | ( |
$ | ( |
$ | ( |
|||||||||||||||
| Weighted average common shares outstanding – basic | |||||||||||||||||||||||
| Conversion of Class B common shares into Class A common shares | |||||||||||||||||||||||
Stock-based awards, primarily stock options (1)
|
|||||||||||||||||||||||
| Weighted average common shares outstanding – diluted | |||||||||||||||||||||||
| Net income (loss) per common share attributable to CBI – basic | $ | ( |
$ | ( |
$ | ( |
$ | ( |
|||||||||||||||
| Net income (loss) per common share attributable to CBI – diluted | $ | ( |
$ | ( |
$ | ( |
$ | ( |
|||||||||||||||
(1) |
We have excluded the following weighted average common shares outstanding from the calculation of diluted net income (loss) per common share, as the effect of including these would have been anti-dilutive: |
||||||||||||||||
| For the Six Months Ended August 31, 2022 | For the Three Months Ended August 31, 2022 | ||||||||||||||||
| (in millions) | |||||||||||||||||
| Class B Stock | |||||||||||||||||
| Stock-based awards, primarily stock options | |||||||||||||||||
12. COMPREHENSIVE INCOME (LOSS) ATTRIBUTABLE TO CBI
Comprehensive income (loss) consists of net income (loss), foreign currency translation adjustments, unrealized net gain (loss) on derivative instruments, pension/postretirement adjustments, and our share of OCI of equity method investments. The reconciliation of net income (loss) attributable to CBI to comprehensive income (loss) attributable to CBI is as follows:
| Before Tax Amount |
Tax (Expense) Benefit |
Net of Tax Amount |
|||||||||||||||
| (in millions) | |||||||||||||||||
| For the Six Months Ended August 31, 2023 | |||||||||||||||||
| Net income (loss) attributable to CBI | $ | ||||||||||||||||
| Other comprehensive income (loss) attributable to CBI: | |||||||||||||||||
| Foreign currency translation adjustments: | |||||||||||||||||
| Net gain (loss) | $ | $ | |||||||||||||||
| Amounts reclassified | |||||||||||||||||
| Net gain (loss) recognized in other comprehensive income (loss) | |||||||||||||||||
| Constellation Brands, Inc. Q2 FY 2024 Form 10-Q |
#WORTHREACHINGFOR I 20
|
||||
| FINANCIAL STATEMENTS | NOTES TO CONSOLIDATED FINANCIAL STATEMENTS | |||||||
| Before Tax Amount |
Tax (Expense) Benefit |
Net of Tax Amount |
|||||||||||||||
| (in millions) | |||||||||||||||||
| Unrealized gain (loss) on cash flow hedges: | |||||||||||||||||
| Net derivative gain (loss) | ( |
||||||||||||||||
| Amounts reclassified | ( |
( |
|||||||||||||||
| Net gain (loss) recognized in other comprehensive income (loss) | ( |
||||||||||||||||
| Pension/postretirement adjustments: | |||||||||||||||||
| Net actuarial gain (loss) | ( |
( |
|||||||||||||||
| Amounts reclassified | |||||||||||||||||
| Net gain (loss) recognized in other comprehensive income (loss) | ( |
( |
|||||||||||||||
| Share of OCI of equity method investments | |||||||||||||||||
| Net gain (loss) | |||||||||||||||||
| Amounts reclassified | |||||||||||||||||
| Net gain (loss) recognized in other comprehensive income (loss) | |||||||||||||||||
| Other comprehensive income (loss) attributable to CBI | $ | $ | ( |
||||||||||||||
| Comprehensive income (loss) attributable to CBI | $ | ||||||||||||||||
| For the Six Months Ended August 31, 2022 | |||||||||||||||||
| Net income (loss) attributable to CBI | $ | ( |
|||||||||||||||
| Other comprehensive income (loss) attributable to CBI: | |||||||||||||||||
| Foreign currency translation adjustments: | |||||||||||||||||
| Net gain (loss) | $ | ( |
$ | ( |
|||||||||||||
| Amounts reclassified | |||||||||||||||||
| Net gain (loss) recognized in other comprehensive income (loss) | ( |
( |
|||||||||||||||
| Unrealized gain (loss) on cash flow hedges: | |||||||||||||||||
| Net derivative gain (loss) | ( |
||||||||||||||||
| Amounts reclassified | ( |
( |
|||||||||||||||
| Net gain (loss) recognized in other comprehensive income (loss) | ( |
||||||||||||||||
| Pension/postretirement adjustments: | |||||||||||||||||
| Net actuarial gain (loss) | ( |
( |
|||||||||||||||
| Amounts reclassified | |||||||||||||||||
| Net gain (loss) recognized in other comprehensive income (loss) | ( |
( |
|||||||||||||||
| Share of OCI of equity method investments | |||||||||||||||||
| Net gain (loss) | |||||||||||||||||
| Amounts reclassified | |||||||||||||||||
| Net gain (loss) recognized in other comprehensive income (loss) | |||||||||||||||||
| Other comprehensive income (loss) attributable to CBI | $ | $ | ( |
||||||||||||||
| Comprehensive income (loss) attributable to CBI | $ | ( |
|||||||||||||||
| Constellation Brands, Inc. Q2 FY 2024 Form 10-Q |
#WORTHREACHINGFOR I 21
|
||||
| FINANCIAL STATEMENTS | NOTES TO CONSOLIDATED FINANCIAL STATEMENTS | |||||||
| Before Tax Amount |
Tax (Expense) Benefit |
Net of Tax Amount |
|||||||||||||||
| (in millions) | |||||||||||||||||
| For the Three Months Ended August 31, 2023 | |||||||||||||||||
| Net income (loss) attributable to CBI | $ | ||||||||||||||||
| Other comprehensive income (loss) attributable to CBI: | |||||||||||||||||
| Foreign currency translation adjustments: | |||||||||||||||||
| Net gain (loss) | $ | $ | |||||||||||||||
| Amounts reclassified | |||||||||||||||||
| Net gain (loss) recognized in other comprehensive income (loss) | |||||||||||||||||
| Unrealized gain (loss) on cash flow hedges: | |||||||||||||||||
| Net derivative gain (loss) | ( |
||||||||||||||||
| Amounts reclassified | ( |
( |
|||||||||||||||
| Net gain (loss) recognized in other comprehensive income (loss) | ( |
||||||||||||||||
| Pension/postretirement adjustments: | |||||||||||||||||
| Net actuarial gain (loss) | ( |
( |
|||||||||||||||
| Amounts reclassified | |||||||||||||||||
| Net gain (loss) recognized in other comprehensive income (loss) | ( |
( |
|||||||||||||||
| Share of OCI of equity method investments | |||||||||||||||||
| Net gain (loss) | |||||||||||||||||
| Amounts reclassified | |||||||||||||||||
| Net gain (loss) recognized in other comprehensive income (loss) | |||||||||||||||||
| Other comprehensive income (loss) attributable to CBI | $ | $ | ( |
||||||||||||||
| Comprehensive income (loss) attributable to CBI | $ | ||||||||||||||||
| For the Three Months Ended August 31, 2022 | |||||||||||||||||
| Net income (loss) attributable to CBI | $ | ( |
|||||||||||||||
| Other comprehensive income (loss) attributable to CBI: | |||||||||||||||||
| Foreign currency translation adjustments: | |||||||||||||||||
| Net gain (loss) | $ | ( |
$ | ( |
|||||||||||||
| Amounts reclassified | |||||||||||||||||
| Net gain (loss) recognized in other comprehensive income (loss) | ( |
( |
|||||||||||||||
| Unrealized gain (loss) on cash flow hedges: | |||||||||||||||||
| Net derivative gain (loss) | ( |
( |
|||||||||||||||
| Amounts reclassified | ( |
( |
|||||||||||||||
| Net gain (loss) recognized in other comprehensive income (loss) | ( |
( |
|||||||||||||||
| Pension/postretirement adjustments: | |||||||||||||||||
| Net actuarial gain (loss) | |||||||||||||||||
| Amounts reclassified | |||||||||||||||||
| Net gain (loss) recognized in other comprehensive income (loss) | |||||||||||||||||
| Share of OCI of equity method investments | |||||||||||||||||
| Net gain (loss) | ( |
||||||||||||||||
| Amounts reclassified | |||||||||||||||||
| Net gain (loss) recognized in other comprehensive income (loss) | ( |
||||||||||||||||
| Other comprehensive income (loss) attributable to CBI | $ | ( |
$ | ( |
|||||||||||||
| Comprehensive income (loss) attributable to CBI | $ | ( |
|||||||||||||||
| Constellation Brands, Inc. Q2 FY 2024 Form 10-Q |
#WORTHREACHINGFOR I 22
|
||||
| FINANCIAL STATEMENTS | NOTES TO CONSOLIDATED FINANCIAL STATEMENTS | |||||||
Accumulated other comprehensive income (loss), net of income tax effect, includes the following components:
| Foreign Currency Translation Adjustments |
Unrealized Net Gain (Loss) on Derivative Instruments |
Pension/ Postretirement Adjustments |
Share of OCI of Equity Method Investments |
Accumulated Other Comprehensive Income (Loss) |
|||||||||||||||||||||||||
| (in millions) | |||||||||||||||||||||||||||||
| Balance, February 28, 2023 | $ | ( |
$ | $ | ( |
$ | $ | ||||||||||||||||||||||
| Other comprehensive income (loss): | |||||||||||||||||||||||||||||
| Other comprehensive income (loss) before reclassification adjustments | ( |
||||||||||||||||||||||||||||
| Amounts reclassified from accumulated other comprehensive income (loss) | ( |
( |
|||||||||||||||||||||||||||
| Other comprehensive income (loss) | ( |
||||||||||||||||||||||||||||
| Balance, August 31, 2023 | $ | $ | $ | ( |
$ | $ | |||||||||||||||||||||||
13. BUSINESS SEGMENT INFORMATION
Prior to May 31, 2023, our internal management financial reporting consisted of three business divisions: (i) Beer, (ii) Wine and Spirits, and (iii) Canopy and we reported our operating results in four segments: (i) Beer, (ii) Wine and Spirits, (iii) Corporate Operations and Other, and (iv) Canopy. Due to several factors occurring as of May 31, 2023, including those which led to the additional Canopy Equity Method Investment impairment combined with Canopy’s financial results no longer being provided to, or reviewed by, our CODM, and no longer being used to make strategic decisions, allocate resources, or assess performance, we have removed Canopy as a reportable segment. Accordingly, effective May 31, 2023, our internal management financial reporting consists of two business divisions: (i) Beer and (ii) Wine and Spirits and we report our operating results in three segments: (i) Beer, (ii) Wine and Spirits, and (iii) Corporate Operations and Other.
In the Beer segment, our portfolio consists of high-end imported beer brands and ABAs. We have an exclusive perpetual brand license to import, market, and sell our Mexican beer portfolio in the U.S. In the Wine and Spirits segment, we sell a portfolio that includes higher-margin, higher-growth wine brands complemented by certain higher-end spirits brands. Amounts included in the Corporate Operations and Other segment consist of costs of executive management, corporate development, corporate finance, corporate growth and strategy, human resources, internal audit, investor relations, IT, legal, and public relations, as well as our Canopy investment and investments made through our corporate venture capital function. All costs included in the Corporate Operations and Other segment are general costs that are applicable to the consolidated group and are, therefore, not allocated to the other reportable segments. All costs reported within the Corporate Operations and Other segment are not included in our CODM’s evaluation of the operating income (loss) performance of the other reportable segments. The business segments reflect how our operations are managed, how resources are allocated, how operating performance is evaluated by senior management, and the structure of our internal financial reporting. Long-lived tangible assets and total asset information by segment is not provided to, or reviewed by, our CODM as it is not used to make strategic decisions, allocate resources, or assess performance.
In addition, management excludes Comparable Adjustments from its evaluation of the results of each operating segment as these Comparable Adjustments are not reflective of core operations of the segments. Segment operating performance and the incentive compensation of segment management are evaluated based on core segment operating income (loss) which does not include the impact of these Comparable Adjustments.
| Constellation Brands, Inc. Q2 FY 2024 Form 10-Q |
#WORTHREACHINGFOR I 23
|
||||
| FINANCIAL STATEMENTS | NOTES TO CONSOLIDATED FINANCIAL STATEMENTS | |||||||
We evaluate segment operating performance based on operating income (loss) of the respective business units. Comparable Adjustments that impacted comparability in our segment operating income (loss) for each period are as follows:
| For the Six Months Ended August 31, |
For the Three Months Ended August 31, |
||||||||||||||||||||||
| 2023 | 2022 | 2023 | 2022 | ||||||||||||||||||||
| (in millions) | |||||||||||||||||||||||
| Cost of product sold | |||||||||||||||||||||||
| Net gain (loss) on undesignated commodity derivative contracts | $ | ( |
$ | $ | $ | ( |
|||||||||||||||||
| Flow through of inventory step-up | ( |
( |
( |
( |
|||||||||||||||||||
| Settlements of undesignated commodity derivative contracts | ( |
( |
|||||||||||||||||||||
| Net flow through of reserved inventory | |||||||||||||||||||||||
| Recovery of (loss on) inventory write-down | |||||||||||||||||||||||
| Comparable Adjustments, Cost of product sold | ( |
( |
( |
||||||||||||||||||||
| Selling, general, and administrative expenses | |||||||||||||||||||||||
| Restructuring and other strategic business development costs | ( |
( |
( |
( |
|||||||||||||||||||
| Transition services agreements activity | ( |
( |
( |
( |
|||||||||||||||||||
| Transaction, integration, and other acquisition-related costs | ( |
( |
( |
( |
|||||||||||||||||||
| Costs associated with the Reclassification | ( |
( |
|||||||||||||||||||||
Other gains (losses) (1)
|
( |
( |
|||||||||||||||||||||
| Comparable Adjustments, Selling, general, and administrative expenses | ( |
( |
( |
( |
|||||||||||||||||||
| Comparable Adjustments, Operating income (loss) | $ | ( |
$ | ( |
$ | $ | ( |
||||||||||||||||
(1) |
Primarily includes the following: | |||||||||||||||||||||||||
| For the Six Months Ended August 31, |
For the Three Months Ended August 31, |
|||||||||||||||||||||||||
| 2023 | 2022 | 2023 | 2022 | |||||||||||||||||||||||
| (in millions) | ||||||||||||||||||||||||||
| Gain (loss) on sale of business | $ | ( |
$ | $ | ( |
$ | ||||||||||||||||||||
Recognition of a previously deferred gain upon release of a related indemnity |
$ | $ | $ | $ | ||||||||||||||||||||||
| Gain from remeasurement of previously held equity method investments | $ | $ | $ | $ | ||||||||||||||||||||||
| Decreases in estimated fair values of contingent liabilities associated with prior period acquisitions | $ | $ | $ | $ | ||||||||||||||||||||||
The accounting policies of the segments are the same as those described for the Company in Note 1 of our consolidated financial statements included in our 2023 Annual Report. Segment information is as follows:
| For the Six Months Ended August 31, |
For the Three Months Ended August 31, |
||||||||||||||||||||||
| 2023 | 2022 | 2023 | 2022 | ||||||||||||||||||||
| (in millions) | |||||||||||||||||||||||
| Beer | |||||||||||||||||||||||
| Net sales | $ | $ | $ | $ | |||||||||||||||||||
| Segment operating income (loss) | $ | $ | $ | $ | |||||||||||||||||||
| Capital expenditures | $ | $ | $ | $ | |||||||||||||||||||
| Depreciation and amortization | $ | $ | $ | $ | |||||||||||||||||||
| Constellation Brands, Inc. Q2 FY 2024 Form 10-Q |
#WORTHREACHINGFOR I 24
|
||||
| FINANCIAL STATEMENTS | NOTES TO CONSOLIDATED FINANCIAL STATEMENTS | |||||||
| For the Six Months Ended August 31, |
For the Three Months Ended August 31, |
||||||||||||||||||||||
| 2023 | 2022 | 2023 | 2022 | ||||||||||||||||||||
| (in millions) | |||||||||||||||||||||||
| Wine and Spirits | |||||||||||||||||||||||
| Net sales: | |||||||||||||||||||||||
| Wine | $ | $ | $ | $ | |||||||||||||||||||
| Spirits | |||||||||||||||||||||||
| Net sales | $ | $ | $ | $ | |||||||||||||||||||
| Segment operating income (loss) | $ | $ | $ | $ | |||||||||||||||||||
| Income (loss) from unconsolidated investments | $ | $ | $ | $ | |||||||||||||||||||
| Equity method investments | $ | $ | $ | $ | |||||||||||||||||||
| Capital expenditures | $ | $ | $ | $ | |||||||||||||||||||
| Depreciation and amortization | $ | $ | $ | $ | |||||||||||||||||||
| Corporate Operations and Other | |||||||||||||||||||||||
| Segment operating income (loss) | $ | ( |
$ | ( |
$ | ( |
$ | ( |
|||||||||||||||
| Income (loss) from unconsolidated investments | $ | ( |
$ | ( |
$ | ( |
$ | ( |
|||||||||||||||
| Equity method investments | $ | $ | $ | $ | |||||||||||||||||||
| Capital expenditures | $ | $ | $ | $ | |||||||||||||||||||
| Depreciation and amortization | $ | $ | $ | $ | |||||||||||||||||||
| Comparable Adjustments | |||||||||||||||||||||||
| Operating income (loss) | $ | ( |
$ | ( |
$ | $ | ( |
||||||||||||||||
| Income (loss) from unconsolidated investments | $ | ( |
$ | ( |
$ | ( |
$ | ( |
|||||||||||||||
| Consolidated | |||||||||||||||||||||||
| Net sales | $ | $ | $ | $ | |||||||||||||||||||
| Operating income (loss) | $ | $ | $ | $ | |||||||||||||||||||
Income (loss) from unconsolidated investments (1)
|
$ | ( |
$ | ( |
$ | ( |
$ | ( |
|||||||||||||||
| Equity method investments | $ | $ | $ | $ | |||||||||||||||||||
| Capital expenditures | $ | $ | $ | $ | |||||||||||||||||||
| Depreciation and amortization | $ | $ | $ | $ | |||||||||||||||||||
(1) |
Income (loss) from unconsolidated investments consists of: | ||||||||||||||||||||||||||||
| For the Six Months Ended August 31, |
For the Three Months Ended August 31, |
||||||||||||||||||||||||||||
| 2023 | 2022 | 2023 | 2022 | ||||||||||||||||||||||||||
| (in millions) | |||||||||||||||||||||||||||||
Impairment of equity method investments |
$ | ( |
$ | ( |
$ | ( |
$ | ( |
|||||||||||||||||||||
| Unrealized net gain (loss) on securities measured at fair value | ( |
( |
( |
( |
|||||||||||||||||||||||||
| Equity in earnings (losses) from Canopy and related activities | ( |
( |
( |
( |
|||||||||||||||||||||||||
| Equity in earnings (losses) from other equity method investees and related activities | |||||||||||||||||||||||||||||
| $ | ( |
$ | ( |
$ | ( |
$ | ( |
||||||||||||||||||||||
| Constellation Brands, Inc. Q2 FY 2024 Form 10-Q |
#WORTHREACHINGFOR I 25
|
||||
| MD&A | |||||
Item 2. Management’s Discussion and Analysis of Financial Condition and Results of Operations.
Introduction
This MD&A provides additional information on our businesses, current developments, financial condition, cash flows, and results of operations. It should be read in conjunction with our Financial Statements and with our consolidated financial statements and notes included in our 2023 Annual Report. This MD&A is organized as follows:
Overview. This section provides a general description of our business, which we believe is important in understanding the results of our operations, financial condition, and potential future trends.
Strategy. This section provides a description of our strategy and a discussion of significant divestitures, acquisitions, and investments.
Results of operations. This section provides an analysis of our results of operations presented on a business segment basis for the three months ended August 31, 2023, and August 31, 2022, and six months ended August 31, 2023, and August 31, 2022. In addition, a brief description of significant transactions and other items that affect the comparability of the results is provided.
Liquidity and capital resources. This section provides an analysis of our cash flows, outstanding debt, and liquidity position. Included in the analysis of outstanding debt is a discussion of the financial capacity available to fund our on-going operations and future commitments, as well as a discussion of other financing arrangements.
Overview
We are an international producer and marketer of beer, wine, and spirits with operations in the U.S., Mexico, New Zealand, and Italy with powerful, consumer-connected, high-quality brands like Corona Extra, Modelo Especial, the Robert Mondavi Brand Family, Kim Crawford, Meiomi, The Prisoner Wine Company, High West, Casa Noble, and Mi CAMPO. In the U.S., we are one of the top growth contributors at retail among beverage alcohol suppliers. We are the third-largest beer company in the U.S. and continue to strengthen our leadership position as the #1 high-end beer supplier and the #1 share gainer across the U.S. beer market. Within wine and spirits, we are making solid progress in refining our brand portfolio to shift to a higher-end focused business to deliver net sales growth and margin expansion. The strength of our brands makes us a supplier of choice to many of our consumers and our customers, which include wholesale distributors, retailers, and on-premise locations. We conduct our business through entities we wholly own as well as through a variety of joint ventures and other entities.
Effective May 31, 2023, we changed our internal management financial reporting to consist of two business divisions: (i) Beer and (ii) Wine and Spirits and we now report our operating results in three
| Constellation Brands, Inc. Q2 FY 2024 Form 10-Q |
#WORTHREACHINGFOR I 26
|
||||
| MD&A | |||||
segments: (i) Beer, (ii) Wine and Spirits, and (iii) Corporate Operations and Other following the removal of the Canopy operating segment. For additional information, refer to Note 13.
In the Beer segment, our portfolio consists of high-end imported beer brands and ABAs. We have an exclusive perpetual brand license to import, market, and sell our Mexican beer portfolio in the U.S. In the Wine and Spirits segment, we sell a portfolio that includes higher-margin, higher-growth wine brands complemented by certain higher-end spirits brands. Amounts included in the Corporate Operations and Other segment consist of costs of executive management, corporate development, corporate finance, corporate growth and strategy, human resources, internal audit, investor relations, IT, legal, and public relations, as well as our Canopy investment and investments made through our corporate venture capital function. All costs included in the Corporate Operations and Other segment are general costs that are applicable to the consolidated group and are, therefore, not allocated to the other reportable segments. All costs reported within the Corporate Operations and Other segment are not included in our CODM’s evaluation of the operating income (loss) performance of the other reportable segments. The business segments reflect how our operations are managed, how resources are allocated, how operating performance is evaluated by senior management, and the structure of our internal financial reporting.
Strategy
Business strategy
Our overall strategic vision is to consistently deliver industry-leading total stockholder returns over the long-term through a focus on these key pillars:
•continue building strong brands people love with advantaged routes to market;
•build a culture that is consumer-obsessed and leverages robust innovation capabilities to stay on the forefront of consumer trends;
•deploy capital in line with disciplined and balanced priorities; and
•deliver on impactful ESG initiatives that we believe are not only good business, but also good for the world.
We will continue to strive for success by ensuring consumer-led decision making drives all aspects of our business; building a diverse talent pipeline with best-in-class people development; investing in infrastructure that supports and enables our business, including data systems and architecture; and exemplifying intentional and proactive fiscal management. We place focus on positioning our portfolio on higher-margin, higher-growth categories of the beverage alcohol industry to align with consumer-led premiumization trends, which we believe will continue to drive faster growth rates across beer, wine, and spirits. To continue capitalizing on consumer-led premiumization trends, become more competitive, and grow our business, we have employed a strategy dedicated to organic growth and supplemented by targeted investments and acquisitions. We also believe a key component to driving faster growth rates is to invest and strengthen our leadership position within the DTC and 3-tier eCommerce channels. We have launched a multi-year Digital Business Acceleration initiative, which we believe will enable us to drive results by enhancing our technology capabilities in key areas. In Fiscal 2024, we continue to focus our Digital Business Acceleration initiative efforts on procurement, end-to-end supply chain planning, and marketing optimization, as well as introducing a new focus area, logistics. Additionally, we believe our continued focus on maintaining a strong balance sheet provides a solid financial foundation to support our broader strategic initiatives.
Our business strategy for the Beer segment focuses on strengthening our leadership position in the high-end segment of the U.S. beer market and continuing to grow our high-end imported beer brands through maintenance of leading margins, enhancements to our results of operations and operating cash flow, and exploring new avenues for growth. This includes continued focus on growing our beer portfolio in the U.S. through expanding distribution for key brands, including within the 3-tier eCommerce channel, as well as continued expansion, optimization, and/or construction activities at our breweries in Mexico. Additionally, in an effort to compete more fully in growing sectors of the high-end segment of the U.S. beer market, we have leveraged our
| Constellation Brands, Inc. Q2 FY 2024 Form 10-Q |
#WORTHREACHINGFOR I 27
|
||||
| MD&A | |||||
innovation capabilities to create new line extensions behind celebrated, trusted brands and package formats that are intended to meet emerging needs.
Expansion, optimization, and/or construction activities continue under our Mexico Beer Projects to align with our anticipated future growth expectations. Additionally, we are pursuing the sale of the remaining assets at the canceled Mexicali Brewery after exploring various options; however, we may not be successful in completing any such sale or obtaining other forms of recovery.
Our business strategy for the Wine and Spirits segment focuses on higher-end brands, improving margins, and creating operating efficiencies. We continue to refine our portfolio primarily through an enhanced focus on higher-margin, higher-growth wine and spirits brands. Our business is organized into two distinct commercial teams, one focused on our fine wine and craft spirits brands and the other focused on our mainstream and premium brands. While each team has its own distinct strategy, both remain aligned to the goal of accelerating performance by growing organic net sales and expanding margins. In addition, we are advancing our aim to become a global, omni-channel competitor in line with consumer preferences. Our business continues to progressively expand into DTC channels (including hospitality), 3-tier eCommerce, and international markets, while continuing to grow in U.S. 3-tier brick-and-mortar distribution. In markets where it is feasible, we entered into a contractual arrangement with Southern Glazer’s Wine and Spirits to consolidate our U.S. distribution in order to obtain dedicated distributor selling resources which focus on our U.S. wine and spirits portfolio to drive organic growth.
Marketing, sales, and distribution of our products are primarily managed on a geographic basis allowing us to leverage leading market positions. In addition, market dynamics and consumer trends vary across each of our markets. Within our primary market in the U.S., we offer a range of beverage alcohol products across the imported beer, ABA, and branded wine and spirits categories, with generally separate distribution networks utilized for (i) our beer portfolio and (ii) our wine and spirits portfolio. The environment for our products is competitive in each of our markets.
We remain committed to our long-term financial model of: growing sales, expanding margins, and increasing cash flow in order to achieve earnings per share growth as well as our target net leverage ratio and dividend payout ratio; investing to support the growth of our business; and delivering additional returns to stockholders through periodic share repurchases. Our results of operations and financial condition have been affected by inflation, changing prices, reductions in discretionary income of consumers available to purchase our products, and shifting consumer behaviors, as well as other unfavorable global and regional economic conditions, global supply chain disruptions and constraints, geopolitical events, and military conflicts, such as repercussions from the conflict in Ukraine. We expect some or all of these impacts to continue during the remainder of Fiscal 2024 which could have a material impact on our results of operations. We intend to continue to monitor the inflationary environment and the impact on the consumer when we consider passing along rising costs through further selling price increases, subject to normal competitive conditions. In addition, we continue to identify on-going cost savings initiatives, including our commodity and foreign exchange hedging programs. However, there can be no assurance that we will be able to fully mitigate rising costs through increased selling prices and/or cost savings initiatives. Furthermore, to the extent climate-related severe weather events, such as droughts, floods, wildfires, extreme heat, and/or late frosts, continue to occur or accelerate in future periods, it could have a material impact on our results of operations and financial condition.
ESG strategy
During the course of our history, we have been committed to safeguarding our environment, making a positive difference in our communities, and advocating for responsible consumption of beverage alcohol products. We believe our ESG strategy enables us to better meet stakeholder expectations, reflects our Company values, and directly address pressing environmental and societal needs that are important to our stockholders, communities, consumers, and employees.
| Constellation Brands, Inc. Q2 FY 2024 Form 10-Q |
#WORTHREACHINGFOR I 28
|
||||
| MD&A | |||||
Specifically, we have focused on areas where we believe we have the greatest opportunities to make meaningful, positive impacts for people and the planet, and we dedicate our resources towards:
Serving as good stewards of our environment and natural resources
Improve water availability and resilience for our communities where we operate; and reducing GHG emissions through energy conservation and renewable energy initiatives; and reducing operational waste and enhancing our use of returnable, recyclable, or renewable packaging

Enhancing social equity within our industry and communities
Championing the professional development and advancement of women in the beverage alcohol industry and our communities; enhancing economic development and prosperity in disadvantaged communities; and championing an inclusive culture within our organization, characterized by diversity in background and thought, which reflects our consumers and the communities where we live and work
Promoting responsible beverage alcohol consumption
Ensuring the responsible promotion and marketing of our products; and empowering adults to make responsible choices in their alcohol (substance) consumption by supporting fact-based education, engagement programs, and policies
During Second Quarter 2024 we took the following steps to advance our ESG strategy by key area:
Serving as good stewards of our environment and natural resources
•Corona again partnered with Oceanic Global, a non-profit leader in ocean conservation, to evaluate plastic waste usage within marketing materials and organize and support beach cleanup events around the U.S. focused on removing plastic, and is on track to exceed the brand’s goal of removing one million pounds of plastic from the beach, Corona’s packaging, and its branded merchandise by its 100th birthday in calendar year 2025
•completed the transition from hi-cone plastic rings to recyclable paperboard for all applicable 4-pack and 6-pack stock keeping units across our Beer portfolio
Enhancing social equity within our industry and communities
•partnered with National Hispanic Corporate Council and UnidosUS to host events to learn and share diversity, equity, and inclusion best practices, to collectively address top-of-mind issues and concerns affecting the Hispanic/Latinx community, and to seek to inspire attendees to continue creating change across the U.S.
•acquired the Domaine Curry wine brand. Through Second Quarter 2024, we have delivered 85% and 22% of our commitments to our Focus on Female Founders and Focus on Minority Founder Venture programs, respectively
Promoting responsible beverage alcohol consumption
•in collaboration with Responsibility.org, a not-for-profit that aims to empower adults to make a lifetime of responsible alcohol choices, we shared responsible consumption messaging throughout the summer months, including the July 4th holiday, with employees and external audiences
Divestitures, acquisitions, and investments
Beer segment
Craft Beer Divestitures
In June 2023, we completed the Craft Beer Divestitures. Accordingly, our consolidated results of operations include the results of operations of such craft beer brands through the dates of these divestitures. The Craft Beer Divestitures are consistent with our strategic focus on continuing to grow our high-end imported beer brands through maintenance of leading margins and enhancements to our results of operations.
| Constellation Brands, Inc. Q2 FY 2024 Form 10-Q |
#WORTHREACHINGFOR I 29
|
||||
| MD&A | |||||
Daleville Facility
In May 2023, we sold the Daleville Facility in connection with management’s decision to exit the craft beer business. The net cash proceeds from the transaction were used primarily for general corporate purposes.
Wine and Spirits segment
Wine Divestiture
In October 2022, we sold certain of our mainstream and premium wine brands and related inventory. Accordingly, our consolidated results of operations include the results of operations of such mainstream and premium wine brands through the date of divestiture.
Austin Cocktails acquisition
In April 2022, we acquired the remaining 73% ownership interest in Austin Cocktails, which included a portfolio of small batch, RTD cocktails. This transaction primarily included the acquisition of goodwill and a trademark. The results of operations of Austin Cocktails are reported in the Wine and Spirits segment and have been included in our consolidated results of operations from the date of acquisition.
Lingua Franca acquisition
In March 2022, we acquired the Lingua Franca business, including a collection of Oregon-based luxury wines, a vineyard, and a production facility. This transaction also included the acquisition of a trademark and inventory. The results of operations of Lingua Franca are reported in the Wine and Spirits segment and have been included in our consolidated results of operations from the date of acquisition.
Our Wine and Spirits segment divestiture and acquisitions support our strategic focus on consumer-led premiumization trends and meeting the evolving needs of our consumers.
Corporate Operations and Other segment
Corporate ventures
As of August 31, 2023, we evaluated certain equity method investments, made through our corporate venture capital function, and determined there were other-than-temporary impairments due to business underperformance. Investments with a carrying value of $14.9 million were written down to an estimated fair value of $2.6 million, resulting in an impairment of $12.3 million. This loss from impairment was included in income (loss) from unconsolidated investments within our consolidated results for Second Quarter 2024 and Six Months 2024.
Canopy investment
We have an investment in Canopy, a North American cannabis and CPG company providing medical and adult-use cannabis products, which expands our portfolio into adjacent categories. We expect to convert our Canopy common shares into Exchangeable Shares following the completion of the Canopy Transaction.
Canopy Equity Method Investment —
We have evaluated the Canopy Equity Method Investment as of August 31, 2023, and determined that there was not an other-than-temporary impairment. Our conclusion was based primarily on the period of time for which the fair value had been less than the carrying value, including Canopy’s stock price recovery above our carrying value following quarter-end. We will continue to review the Canopy Equity Method Investment for an other-than-temporary impairment.
We evaluated the Canopy Equity Method Investment as of May 31, 2023, and determined there was an other-than-temporary impairment. Our conclusion was based on several contributing factors, including: (i) the fair value being less than the carrying value and the uncertainty surrounding Canopy’s stock price recovering in the near-term, (ii) Canopy recorded significant costs in its fourth quarter of fiscal 2023 results designed to align its Canadian cannabis operations and resources in response to continued unfavorable market trends, (iii) the substantial doubt about Canopy’s ability to continue as a going concern, as disclosed by Canopy, and (iv) Canopy’s identification of material misstatements in certain of its previously reported financial results related to sales in its BioSteel reporting unit that were accounted for incorrectly, including the recording of a goodwill impairment
| Constellation Brands, Inc. Q2 FY 2024 Form 10-Q |
#WORTHREACHINGFOR I 30
|
||||
| MD&A | |||||
during its restated second quarter of fiscal 2023. As a result, the Canopy Equity Method Investment with a carrying value of $266.2 million was written down to its estimated fair value of $142.7 million, resulting in an impairment of $123.5 million. This loss from impairment was included in income (loss) from unconsolidated investments within our consolidated results for Six Months 2024.
Additionally, we evaluated the Canopy Equity Method Investment as of August 31, 2022, and determined that there was an other-than-temporary impairment. Our conclusion was based on several contributing factors, including: (i) the period of time for which the fair value had been less than the carrying value and the uncertainty surrounding Canopy’s stock price recovering in the near-term, (ii) Canopy recording a significant impairment of goodwill related to its cannabis operations during its first quarter of fiscal 2023, and (iii) the uncertainty of U.S. federal cannabis permissibility. As a result, the Canopy Equity Method Investment with a carrying value of $1,695.1 million was written down to its estimated fair value of $634.8 million, resulting in an impairment of $1,060.3 million. This loss from impairment was included in income (loss) from unconsolidated investments within our consolidated results for Second Quarter 2023 and Six Months 2023.
Other Canopy investments —
In July 2022, we received 29.2 million common shares of Canopy following the exchange of C$100.0 million principal amount of our Canopy Debt Securities. In April 2023, we extended the maturity of the remaining C$100.0 million principal amount of our Canopy Debt Securities by exchanging them for the 2023 Canopy Promissory Note. The fair value of the Canopy Debt Securities was $69.6 million as of February 28, 2023. As of May 31, 2023, we determined that the 2023 Canopy Promissory Note had no future economic value and, accordingly, the fair value was reduced to zero.
Plan to convert Canopy common stock ownership —
In October 2022, we entered into a Consent Agreement with Canopy pursuant to which we have provided our consent, subject to certain conditions, to the Canopy Transaction. Assuming the completion of the Canopy Transaction and the transactions contemplated by the Consent Agreement and that we elect to convert our Canopy common shares into Exchangeable Shares:
•we intend to surrender our November 2018 Canopy Warrants to Canopy for cancellation;
•we will only have an interest in Exchangeable Shares, which are non-voting and non-participating securities, and our 2023 Canopy Promissory Note (for which we intend to negotiate an exchange of the principal amount for Exchangeable Shares, although neither we nor Canopy has any binding obligation to do so);
•we intend to terminate all legacy agreements and commercial arrangements between ourselves and Canopy, including the investor rights agreement but excluding the Consent Agreement and certain termination agreements;
•we will have no further governance rights in relation to Canopy, including rights to nominate members to the board of directors of Canopy, or approval rights related to certain transactions;
•all of our nominees will resign from the board of directors of Canopy; and
•as our investment in Canopy common shares makes up our Canopy Equity Method Investment, we expect to no longer apply the equity method to our investment in Canopy, which we expect to instead be accounted for at fair value with changes reported in income (loss) from unconsolidated investments within our consolidated results.
For additional information on these divestitures, acquisitions, and investments refer to Notes 4, 5, and 7.
| Constellation Brands, Inc. Q2 FY 2024 Form 10-Q |
#WORTHREACHINGFOR I 31
|
||||
| MD&A | |||||
Results of Operations
Financial Highlights
References to organic throughout the following discussion exclude the impact of the Wine Divestiture, as appropriate.
Second Quarter 2024 compared with Second Quarter 2023
•Our results of operations were impacted by (i) lower impairment losses related to our equity method investments as compared with Second Quarter 2023, driven by our Canopy Equity Method Investment, (ii) a decrease in equity in losses from Canopy’s results, and (iii) improvements within the Beer segment driven by shipment volume growth.
•Net sales increased 7% largely due to an increase in Beer net sales driven primarily by shipment volume growth and favorable impact from pricing.
•Operating income increased 20% largely due to (i) the improvements within the Beer segment as shipment volume growth exceeded higher operational costs, (ii) gains recognized on undesignated commodity derivative contracts for Second Quarter 2024 compared with losses for Second Quarter 2023, and (iii) Second Quarter 2023 Reclassification costs that did not recur.
•Net income (loss) attributable to CBI and diluted net income (loss) per common share attributable to CBI increased largely due to the items discussed above.
Six Months 2024 compared to Six Months 2023
•Our results of operations were impacted by (i) lower impairment losses related to our equity method investments as compared with Six Months 2023, driven by our Canopy Equity Method Investment, (ii) a decrease in equity in losses from Canopy’s results, (iii) improvements within the Beer segment driven by shipment volume growth, and (iv) a decrease in unrealized net loss from the changes in fair value of our investment in Canopy.
•Net sales increased 7% largely due to an increase in Beer net sales driven primarily by shipment volume growth and favorable impact from pricing.
•Operating income increased 7% largely due to (i) the improvements with the Beer segment as shipment volume exceeded higher operational costs and an increase in media investments, (ii) lower Reclassification costs, and (iii) decreased losses on undesignated commodity derivative contracts, partially offset by increased restructuring and other strategic business development costs as compared to Six Months 2023.
•Net income (loss) attributable to CBI and diluted net income (loss) per common share attributable to CBI increased largely due to the items discussed above.
Comparable Adjustments
Management excludes items that affect comparability from its evaluation of the results of each operating segment as these Comparable Adjustments are not reflective of core operations of the segments. Segment operating performance and the incentive compensation of segment management are evaluated based on core segment operating income (loss) which does not include the impact of these Comparable Adjustments.
| Constellation Brands, Inc. Q2 FY 2024 Form 10-Q |
#WORTHREACHINGFOR I 32
|
||||
| MD&A | |||||
As more fully described herein and in the related Notes, the Comparable Adjustments that impacted comparability in our segment results for each period are as follows:
| Second Quarter 2024 |
Second Quarter 2023 |
Six Months 2024 |
Six Months 2023 |
||||||||||||||||||||
| (in millions) | |||||||||||||||||||||||
| Cost of product sold | |||||||||||||||||||||||
| Net gain (loss) on undesignated commodity derivative contracts | $ | 19.1 | $ | (15.4) | $ | (15.6) | $ | 33.1 | |||||||||||||||
| Settlements of undesignated commodity derivative contracts | 5.6 | (31.3) | 6.2 | (54.6) | |||||||||||||||||||
| Flow through of inventory step-up | (0.8) | (0.9) | (1.5) | (1.9) | |||||||||||||||||||
| Net flow through of reserved inventory | — | 1.2 | — | 1.2 | |||||||||||||||||||
| Recovery of (loss on) inventory write-down | — | — | — | 0.2 | |||||||||||||||||||
| Comparable Adjustments, Cost of product sold | 23.9 | (46.4) | (10.9) | (22.0) | |||||||||||||||||||
| Selling, general, and administrative expenses | |||||||||||||||||||||||
| Transition services agreements activity | (7.0) | (4.5) | (12.7) | (7.9) | |||||||||||||||||||
| Restructuring and other strategic business development costs | (3.4) | (1.2) | (18.3) | (2.6) | |||||||||||||||||||
| Transaction, integration, and other acquisition-related costs | (0.3) | (0.5) | (0.6) | (0.7) | |||||||||||||||||||
| Costs associated with the Reclassification | — | (20.6) | 0.2 | (21.3) | |||||||||||||||||||
Other gains (losses) |
(2.3) | 3.6 | (9.3) | 8.8 | |||||||||||||||||||
| Comparable Adjustments, Selling, general, and administrative expenses | (13.0) | (23.2) | (40.7) | (23.7) | |||||||||||||||||||
| Comparable Adjustments, Operating income (loss) | $ | 10.9 | $ | (69.6) | $ | (51.6) | $ | (45.7) | |||||||||||||||
| Comparable Adjustments, Income (loss) from unconsolidated investments | $ | (7.4) | $ | (1,685.5) | $ | (391.8) | $ | (1,820.9) | |||||||||||||||
Cost of product sold
Undesignated commodity derivative contracts
Net gain (loss) on undesignated commodity derivative contracts represents a net gain (loss) from the changes in fair value of undesignated commodity derivative contracts. The net gain (loss) is reported outside of segment operating results until such time that the underlying exposure is recognized in the segment operating results. At settlement, the net gain (loss) from the changes in fair value of the undesignated commodity derivative contracts is reported in the appropriate operating segment, allowing the results of our operating segments to reflect the economic effects of the commodity derivative contracts without the resulting unrealized mark to fair value volatility.
Flow through of inventory step-up
In connection with acquisitions, the allocation of purchase price in excess of book value for certain inventories on hand at the date of acquisition is referred to as inventory step-up. Inventory step-up represents an assumed manufacturing profit attributable to the acquired business prior to acquisition.
Net flow through of reserved inventory
We sold reserved inventory previously written down following the 2020 U.S. West Coast wildfires.
| Constellation Brands, Inc. Q2 FY 2024 Form 10-Q |
#WORTHREACHINGFOR I 33
|
||||
| MD&A | |||||
Recovery of (loss on) inventory write-down
We recognized a gain from a change in estimate on reserved bulk wine inventory and certain grapes as a result of smoke damage sustained during the 2020 U.S. West Coast wildfires.
Selling, general, and administrative expenses
Transition services agreements activity
We recognized costs in connection with transition services agreements related to the previous sale of a portion of our wine and spirits business.
Restructuring and other strategic business development costs
We recognized costs in connection with certain activities which are intended to streamline, increase efficiencies, and reduce our cost structure primarily within the Wine and Spirits segment.
Transaction, integration, and other acquisition-related costs
We recognized transaction, integration, and other acquisition-related costs in connection with our investments, acquisitions, and divestitures.
Costs associated with the Reclassification
We recognized costs primarily related to professional and consulting fees and all filing and other fees paid to the SEC in connection with the Reclassification.
Other gains (losses)
We recognized other gains (losses) primarily from (i) losses on the sales of the Daleville Facility and Craft Beer Divestitures (Second Quarter 2024, Six Months 2024), (ii) recognition of a previously deferred gain upon release of a related indemnity (Second Quarter 2024, Six Months 2024), (iii) a gain recognized on the remeasurement of our previously held equity interests to the acquisition-date fair value (Six Months 2023), and (iv) a decrease in estimated fair value of a contingent liability associated with a prior period acquisition (Second Quarter 2023, Six Months 2023).
Income (loss) from unconsolidated investments
We recognized income (loss) primarily from (i) comparable adjustments to equity in losses from Canopy’s results, (ii) an impairment of our Canopy Equity Method Investment (Second Quarter 2023, Six Months 2024, and Six Months 2023), (iii) unrealized net losses from the changes in fair value of our securities measured at fair value, and (iv) impairments of certain other equity method investments (Second Quarter 2024, Six Months 2024). For additional information, refer to Notes 4 and 7.
Business Segments
Second Quarter 2024 compared to Second Quarter 2023
Net sales
| Second Quarter 2024 |
Second Quarter 2023 |
Dollar Change |
Percent Change |
||||||||||||||||||||
| (in millions) | |||||||||||||||||||||||
| Beer | $ | 2,392.7 | $ | 2,139.3 | $ | 253.4 | 12 | % | |||||||||||||||
| Wine and Spirits: | |||||||||||||||||||||||
| Wine | 383.9 | 442.0 | (58.1) | (13 | %) | ||||||||||||||||||
| Spirits | 60.2 | 73.8 | (13.6) | (18 | %) | ||||||||||||||||||
| Total Wine and Spirits | 444.1 | 515.8 | (71.7) | (14 | %) | ||||||||||||||||||
| Consolidated net sales | $ | 2,836.8 | $ | 2,655.1 | $ | 181.7 | 7 | % | |||||||||||||||
| Constellation Brands, Inc. Q2 FY 2024 Form 10-Q |
#WORTHREACHINGFOR I 34
|
||||
| MD&A | |||||
 |
Beer segment | Second Quarter 2024 |
Second Quarter 2023 |
Dollar Change |
Percent Change |
|||||||||||||||||||||
| (in millions, branded product, 24-pack, 12-ounce case equivalents) | ||||||||||||||||||||||||||
| Net sales | $ | 2,392.7 | $ | 2,139.3 | $ | 253.4 | 12 | % | ||||||||||||||||||
| Shipments | 123.0 | 113.2 | 8.7 | % | ||||||||||||||||||||||
| Depletions | 7.9 | % | ||||||||||||||||||||||||
The increase in Beer net sales is largely due to (i) $188.2 million of shipment volume growth within our Mexican beer portfolio, which benefited from continued consumer demand, (ii) $59.3 million of favorable impact from pricing in select markets within our Mexican beer portfolio, and (iii) $8.5 million of favorable product mix primarily from a shift in package types.
 |
Wine and Spirits segment | Second Quarter 2024 |
Second Quarter 2023 |
Dollar Change |
Percent Change |
|||||||||||||||||||||
| (in millions, branded product, 9-liter case equivalents) | ||||||||||||||||||||||||||
| Net sales | $ | 444.1 | $ | 515.8 | $ | (71.7) | (14 | %) | ||||||||||||||||||
| Shipments | ||||||||||||||||||||||||||
| Total | 6.1 | 7.4 | (17.6 | %) | ||||||||||||||||||||||
Organic (1)
|
6.1 | 7.2 | (15.3 | %) | ||||||||||||||||||||||
| U.S. Domestic | 5.4 | 6.4 | (15.6 | %) | ||||||||||||||||||||||
Organic U.S. Domestic (1)
|
5.4 | 6.3 | (14.3 | %) | ||||||||||||||||||||||
Depletions (1)
|
(7.8 | %) | ||||||||||||||||||||||||
(1)Includes an adjustment to remove volume associated with the Wine Divestiture for the period June 1, 2022, through August 31, 2022.
The decrease in Wine and Spirits net sales is due to a $57.3 million decrease in organic net sales and $14.4 million from the Wine Divestiture. The decrease in organic net sales is driven by (i) a $73.6 million decrease in branded wine and spirits shipment volume and (ii) a $7.4 million decrease in non-branded net sales primarily due to a decline in bulk sales as compared to Second Quarter 2023, partially offset by (i) $19.4 million from favorable product mix, driven by consumer-led premiumization, and (ii) $4.7 million of favorable impact from pricing. The decrease in branded wine and spirits shipment volume is attributable to declines within our U.S. wholesale market, primarily driven by our lower-end brands. The favorable impact from pricing was driven by price increases and higher contractual distributor payments as compared to Second Quarter 2023, partially offset by increases in promotional activity.
Gross profit
| Second Quarter 2024 |
Second Quarter 2023 |
Dollar Change |
Percent Change |
||||||||||||||||||||
| (in millions) | |||||||||||||||||||||||
| Beer | $ | 1,228.7 | $ | 1,147.6 | $ | 81.1 | 7 | % | |||||||||||||||
| Wine and Spirits | 197.3 | 224.7 | (27.4) | (12 | %) | ||||||||||||||||||
| Comparable Adjustments | 23.9 | (46.4) | 70.3 | NM | |||||||||||||||||||
| Consolidated gross profit | $ | 1,449.9 | $ | 1,325.9 | $ | 124.0 | 9 | % | |||||||||||||||
| Constellation Brands, Inc. Q2 FY 2024 Form 10-Q |
#WORTHREACHINGFOR I 35
|
||||
| MD&A | |||||
|
The increase in Beer gross profit is primarily due to (i) $101.3 million of shipment volume growth and (ii) the $59.3 million favorable impact from pricing, partially offset by $80.0 million of higher cost of product sold. The higher cost of product sold is largely due to (i) $39.4 million of higher material costs, including glass, malt, aluminum, and starch, driven by inflation and global supply chain constraints, (ii) $16.2 million of costs related to a voluntary product recall of select kegs for quality assurance, (iii) $12.1 million of higher depreciation resulting from the Mexico Beer Projects, and (iv) $3.6 million of higher inventory obsolescence as compared to Second Quarter 2023, partially offset by $7.0 million of favorable fixed cost absorption related to increased production levels as compared to Second Quarter 2023. To partially offset the increases in cost of product sold we are executing initiatives that have resulted in nearly $20 million of net cost savings for Second Quarter 2024.
|
||||
|
The decrease in Wine and Spirits gross profit is due to a $18.8 million decrease in organic gross profit and $8.6 million from the Wine Divestiture. The decrease in organic gross profit is attributable to (i) a $36.8 million decrease in branded wine and spirits shipment volume and (ii) a $7.9 million decrease in non-branded net sales, partially offset by (i) $12.0 million of lower cost of product sold, (ii) $8.4 million of favorable product mix, and (iii) the $4.7 million favorable impact from pricing. The decrease in cost of product sold was largely attributable to (i) $9.7 million of decreased transportation and warehousing costs, including ocean freight shipping, and (ii) $2.3 million of cost savings initiatives, primarily resulting in lower grape costs, as well as lower materials and packaging costs, driven by our sustainable packaging projects. |
||||
Gross profit as a percent of net sales increased to 51.1% for Second Quarter 2024 compared with 49.9% for Second Quarter 2023. This increase was largely due to (i) a favorable change of approximately 255 basis points in Comparable Adjustments, (ii) 105 basis points of favorable impact from Beer pricing in select markets, and (iii) approximately 45 basis points of rate growth from lower cost of product sold within the Wine and Spirits segment, partially offset by approximately 290 basis points of rate decline from higher cost of product sold within the Beer segment, driven by the increase in material and other operational costs.
Selling, general, and administrative expenses
| Second Quarter 2024 |
Second Quarter 2023 |
Dollar Change |
Percent Change |
||||||||||||||||||||
| (in millions) | |||||||||||||||||||||||
| Beer | $ | 274.8 | $ | 282.0 | $ | (7.2) | (3 | %) | |||||||||||||||
| Wine and Spirits | 116.6 | 125.3 | (8.7) | (7 | %) | ||||||||||||||||||
| Corporate Operations and Other | 66.8 | 82.3 | (15.5) | (19 | %) | ||||||||||||||||||
| Comparable Adjustments | 13.0 | 23.2 | (10.2) | NM | |||||||||||||||||||
| Consolidated selling, general, and administrative expenses | $ | 471.2 | $ | 512.8 | $ | (41.6) | (8 | %) | |||||||||||||||
|
The decrease in Beer selling, general, and administrative expenses is driven largely by $3.8 million and $3.3 million of decreased marketing spend and general and administrative expenses, respectively. The decrease in marketing spend is primarily driven by the Craft Divestitures. The decrease in general and administrative expenses was driven primarily by favorable foreign currency impact.
|
||||
|
The decrease in Wine and Spirits selling, general, and administrative expenses is primarily due to a $9.8 million decrease in marketing spend driven by less planned media investments for our lower-end brands as compared to Second Quarter 2023 and a reduction in third-party services, partially offset by litigation expenses.
|
||||
| Constellation Brands, Inc. Q2 FY 2024 Form 10-Q |
#WORTHREACHINGFOR I 36
|
||||
| MD&A | |||||
 |
The decrease in Corporate Operations and Other selling, general, and administrative expenses is largely due to (i) a $15 million reduction in third-party services, driven by lower Digital Business Acceleration investments, and (ii) a $7 million decrease in compensation and benefits, including favorability from the November 2022 Reclassification, partially offset by a Second Quarter 2024 loss on the sale of an asset and unfavorable depreciation expense. |
||||
Selling, general, and administrative expenses as a percent of net sales decreased to 16.6% for Second Quarter 2024 as compared to 19.3% for Second Quarter 2023. The decrease is largely driven by (i) approximately 195 basis points and 60 basis points of rate decline from the decreases in Beer and Corporate Operations and Other selling, general, and administrative expenses, respectively, and (ii) a favorable change in Comparable Adjustments, contributing approximately 40 basis points of rate decline.
Operating income (loss)
| Second Quarter 2024 |
Second Quarter 2023 |
Dollar Change |
Percent Change |
||||||||||||||||||||
| (in millions) | |||||||||||||||||||||||
| Beer | $ | 953.9 | $ | 865.6 | $ | 88.3 | 10 | % | |||||||||||||||
| Wine and Spirits | 80.7 | 99.4 | (18.7) | (19 | %) | ||||||||||||||||||
| Corporate Operations and Other | (66.8) | (82.3) | 15.5 | 19 | % | ||||||||||||||||||
| Comparable Adjustments | 10.9 | (69.6) | 80.5 | NM | |||||||||||||||||||
| Consolidated operating income (loss) | $ | 978.7 | $ | 813.1 | $ | 165.6 | 20 | % | |||||||||||||||
|
The increase in Beer operating income is largely attributable to the shipment volume growth within our Mexican beer portfolio and the favorable pricing impact, partially offset by higher material costs. |
||||
|
The decrease in Wine and Spirits operating income is largely attributable to the decline in branded wine and spirits shipment volume, the Wine Divestiture, and the decrease in non-branded net sales, partially offset by the lower cost of product sold and marketing spend. |
||||
|
As previously discussed, the Corporate Operations and Other decrease in operating loss is largely due to the lower Digital Business Acceleration investments and compensation and benefits. |
||||
Income (loss) from unconsolidated investments
| Second Quarter 2024 |
Second Quarter 2023 |
Dollar Change |
Percent Change |
||||||||||||||||||||
| (in millions) | |||||||||||||||||||||||
Impairment of equity method investments |
$ | (12.3) | $ | (1,060.3) | $ | 1,048.0 | 99 | % | |||||||||||||||
| Unrealized net gain (loss) on securities measured at fair value | (2.6) | (9.3) | 6.7 | 72 | % | ||||||||||||||||||
| Equity in earnings (losses) from Canopy and related activities | (12.0) | (650.7) | 638.7 | 98 | % | ||||||||||||||||||
| Equity in earnings (losses) from other equity method investees and related activities | 6.7 | 1.2 | 5.5 | NM | |||||||||||||||||||
| $ | (20.2) | $ | (1,719.1) | $ | 1,698.9 | 99 | % | ||||||||||||||||
Interest expense
Interest expense increased to $110.6 million for Second Quarter 2024 as compared to $94.3 million for Second Quarter 2023. This increase of $16.3 million, or 17%, is due to approximately 35 basis points of higher
| Constellation Brands, Inc. Q2 FY 2024 Form 10-Q |
#WORTHREACHINGFOR I 37
|
||||
| MD&A | |||||
weighted average interest rates and approximately $895 million of higher average borrowings, partially offset by an increase in capitalized interest in connection with the Mexico Beer Projects. The higher weighted average interest rates and average borrowings are largely attributable to funding the aggregate cash payment to holders of Class B Stock in connection with the Reclassification. For additional information, refer to Note 8.
Loss on extinguishment of debt
Loss on extinguishment of debt primarily consists of make-whole payments in connection with early redemption of our 3.20% February 2018 Senior Notes and 4.25% May 2013 Senior Notes (Second Quarter 2023).
(Provision for) benefit from income taxes
The provision for income taxes increased to $147.2 million for Second Quarter 2024 from $132.4 million for Second Quarter 2023. Our effective tax rate for Second Quarter 2024 was 17.4% as compared with (13.1)% for Second Quarter 2023. In comparison to prior year, our income taxes were impacted primarily by:
•an increase in the valuation allowance related to our investment in Canopy, driven by the Canopy Equity Method Investment impairment recognized in the Second Quarter 2023; partially offset by
•a net income tax benefit from the realization of tax losses related to a prior period divestiture recognized in the Second Quarter 2023; and
•the effective tax rates applicable to our foreign businesses.
For additional information, refer to Note 9.
Net income (loss) attributable to CBI
Net income (loss) attributable to CBI increased to $690.0 million for Second Quarter 2024 from $(1,151.2) million for Second Quarter 2023. This increase of $1,841.2 million is largely attributable to (i) the Second Quarter 2023 impairment of our Canopy Equity Method Investment, (ii) the decrease in equity in losses from Canopy’s results, and (iii) the Second Quarter 2024 improvements within the Beer segment as shipment volume growth and favorable pricing exceeded higher operational costs.
Six Months 2024 compared to Six Months 2023
Net sales
| Six Months 2024 |
Six Months 2023 |
Dollar Change |
Percent Change |
||||||||||||||||||||
| (in millions) | |||||||||||||||||||||||
| Beer | $ | 4,491.3 | $ | 4,037.5 | $ | 453.8 | 11 | % | |||||||||||||||
| Wine and Spirits: | |||||||||||||||||||||||
| Wine | 744.9 | 846.1 | (101.2) | (12 | %) | ||||||||||||||||||
| Spirits | 115.5 | 134.7 | (19.2) | (14 | %) | ||||||||||||||||||
| Total Wine and Spirits | 860.4 | 980.8 | (120.4) | (12 | %) | ||||||||||||||||||
| Consolidated net sales | $ | 5,351.7 | $ | 5,018.3 | $ | 333.4 | 7 | % | |||||||||||||||
|
Beer segment | Six Months 2024 |
Six Months 2023 |
Dollar Change |
Percent Change |
|||||||||||||||||||||
| (in millions, branded product, 24-pack, 12-ounce case equivalents) | ||||||||||||||||||||||||||
| Net sales | $ | 4,491.3 | $ | 4,037.5 | $ | 453.8 | 11 | % | ||||||||||||||||||
| Shipments | 230.0 | 212.7 | 8.1 | % | ||||||||||||||||||||||
| Depletions | 6.8 | % | ||||||||||||||||||||||||
| Constellation Brands, Inc. Q2 FY 2024 Form 10-Q |
#WORTHREACHINGFOR I 38
|
||||
| MD&A | |||||
The increase in Beer net sales is largely due to (i) $329.3 million of shipment volume growth within our Mexican beer portfolio, which benefited from continued consumer demand, (ii) $121.7 million of favorable impact from pricing in select markets within our Mexican beer portfolio, and (iii) $6.1 million of favorable product mix primarily from a shift in package types.
|
Wine and Spirits segment | Six Months 2024 |
Six Months 2023 |
Dollar Change |
Percent Change |
|||||||||||||||||||||
| (in millions, branded product, 9-liter case equivalents) | ||||||||||||||||||||||||||
| Net sales | $ | 860.4 | $ | 980.8 | $ | (120.4) | (12 | %) | ||||||||||||||||||
| Shipments | ||||||||||||||||||||||||||
| Total | 12.0 | 14.2 | (15.5 | %) | ||||||||||||||||||||||
Organic (1)
|
12.0 | 13.7 | (12.4 | %) | ||||||||||||||||||||||
| U.S. Domestic | 10.6 | 12.2 | (13.1 | %) | ||||||||||||||||||||||
Organic U.S. Domestic (1)
|
10.6 | 11.9 | (10.9 | %) | ||||||||||||||||||||||
Depletions (1)
|
(7.0 | %) | ||||||||||||||||||||||||
(1)Includes an adjustment to remove volume associated with the Wine Divestiture for the period March 1, 2022, through August 31, 2022.
The decrease in Wine and Spirits net sales is due to a $85.6 million decrease in organic net sales and $34.8 million from the Wine Divestiture. The decrease in organic net sales is driven by (i) a $109.7 million decrease in branded wine and spirits shipment volume and (ii) an $11.1 million decrease in non-branded net sales primarily due to a decline in bulk sales as compared to Six Months 2023, partially offset by (i) $19.4 million of favorable product mix, driven by consumer-led premiumization, and (ii) $16.6 million of favorable impact from pricing. The decrease in branded wine and spirits shipment volume is attributable to declines within our U.S. wholesale market, primarily driven by our lower-end brands. The favorable impact from pricing was driven by price increases, decreases in promotional activity, and higher contractual distributor payments as compared to Six Months 2023.
Gross profit
| Six Months 2024 |
Six Months 2023 |
Dollar Change |
Percent Change |
||||||||||||||||||||
| (in millions) | |||||||||||||||||||||||
| Beer | $ | 2,327.4 | $ | 2,167.1 | $ | 160.3 | 7 | % | |||||||||||||||
| Wine and Spirits | 391.2 | 435.8 | (44.6) | (10 | %) | ||||||||||||||||||
| Comparable Adjustments | (10.9) | (22.0) | 11.1 | NM | |||||||||||||||||||
| Consolidated gross profit | $ | 2,707.7 | $ | 2,580.9 | $ | 126.8 | 5 | % | |||||||||||||||
| Constellation Brands, Inc. Q2 FY 2024 Form 10-Q |
#WORTHREACHINGFOR I 39
|
||||
| MD&A | |||||
|
The increase in Beer gross profit is primarily due to (i) $176.6 million of shipment volume growth, (ii) the $121.7 million favorable impact from pricing, and (iii) $3.7 million of favorable product mix, partially offset by $144.4 million of higher cost of product sold. The higher cost of product sold is primarily due to (i) $82.1 million of higher material costs, including aluminum, malt, glass, and starch, driven by inflation and global supply chain constraints, (ii) $21.3 million of higher depreciation resulting from the Mexico Beer Projects, (iii) $16.2 million of costs related to a voluntary product recall of select kegs for quality assurance, (iv) $8.8 million of increased transportation costs, and (v) a $7.3 million increase in brewery costs primarily driven by increased compensation and benefits, partially offset by $8.0 million of favorable fixed cost absorption related to increased production levels as compared to Six Months 2023. To partially offset the increases in cost of product sold we are executing initiatives that have resulted in approximately $50 million of net cost savings for Six Months 2024.
|
||||
|
The decrease in Wine and Spirits gross profit is due to a $24.1 million decrease in organic gross profit and $20.5 million from the Wine Divestiture. The decrease in organic gross profit is attributable to (i) a $54.2 million decrease in branded wine and spirits shipment volume and (ii) a $10.4 million decrease in non-branded net sales, partially offset by (i) $21.5 million of lower cost of product sold and (ii) the $16.6 million favorable impact from pricing. The decrease in cost of product sold was largely attributable to (i) $14.7 million of decreased transportation and warehousing costs, including ocean freight shipping, and (ii) $8.2 million of cost savings initiatives, primarily resulting in lower grape costs, as well as lower materials and packaging costs, driven by our sustainable packaging projects, partially offset by an increase in inventory obsolescence as compared to Six Months 2023. |
||||
Gross profit as a percent of net sales decreased to 50.6% for Six Months 2024 compared with 51.4% for Six Months 2023. This decrease was largely due to approximately 260 basis points of rate decline from higher cost of product sold within the Beer segment, driven by the increase in material and other operational costs, partially offset by (i) approximately 105 basis points of favorable impact from Beer pricing in select markets, (ii) approximately 40 basis points of rate growth from lower cost of product sold with the Wine and Spirits segment, and (iii) a favorable change of 20 basis points in Comparable Adjustments.
Selling, general, and administrative expenses
| Six Months 2024 |
Six Months 2023 |
Dollar Change |
Percent Change |
||||||||||||||||||||
| (in millions) | |||||||||||||||||||||||
| Beer | $ | 575.7 | $ | 538.7 | $ | 37.0 | 7 | % | |||||||||||||||
| Wine and Spirits | 231.2 | 245.4 | (14.2) | (6 | %) | ||||||||||||||||||
| Corporate Operations and Other | 116.7 | 143.6 | (26.9) | (19 | %) | ||||||||||||||||||
| Comparable Adjustments | 40.7 | 23.7 | 17.0 | NM | |||||||||||||||||||
| Consolidated selling, general, and administrative expenses | $ | 964.3 | $ | 951.4 | $ | 12.9 | 1 | % | |||||||||||||||
|
The increase in Beer selling, general, and administrative expenses is driven largely by $25.1 million and $11.9 million of increased marketing spend and general and administrative expenses, respectively. The increase in marketing spend is primarily driven by ongoing media investments to build awareness of our high-end imported beer brands. The increase in general and administrative expenses was driven primarily by increased legal expenses and higher compensation and benefits, primarily related to incremental headcount to support the growth of our Mexican beer portfolio, partially offset by decreased costs associated with the short-term incentive accrual as compared to Six Months 2023.
|
||||
|
The decrease in Wine and Spirits selling, general, and administrative expenses is primarily due to a $16.4 million decrease in marketing spend driven by less planned media investments for our lower-end brands as compared to Six Months 2023, partially offset by litigation expenses.
|
||||
| Constellation Brands, Inc. Q2 FY 2024 Form 10-Q |
#WORTHREACHINGFOR I 40
|
||||
| MD&A | |||||
|
The decrease in Corporate Operations and Other selling, general, and administrative expenses is largely due to (i) a $27 million reduction in third-party services, driven by lower Digital Business Acceleration investments, and (ii) a $6 million decrease in compensation and benefits, including favorability from the November 2022 Reclassification, partially offset by unfavorable impacts from the sale of assets and depreciation expense.
|
||||
Selling, general, and administrative expenses as a percent of net sales decreased to 18.0% for Six Months 2024 as compared with 19.0% for Six Months 2023. The decrease is largely driven by (i) approximately 90 basis points of rate decline as the increase in Beer net sales exceeded the increase in selling, general, and administrative expenses and (ii) approximately 60 basis points of rate decline from a decrease in the Corporate Operations and Other segment’s selling, general, and administrative expenses, partially offset by an unfavorable change in Comparable Adjustments, contributing approximately 35 basis points of rate growth.
Operating income (loss)
| Six Months 2024 |
Six Months 2023 |
Dollar Change |
Percent Change |
||||||||||||||||||||
| (in millions) | |||||||||||||||||||||||
| Beer | $ | 1,751.7 | $ | 1,628.4 | $ | 123.3 | 8 | % | |||||||||||||||
| Wine and Spirits | 160.0 | 190.4 | (30.4) | (16 | %) | ||||||||||||||||||
| Corporate Operations and Other | (116.7) | (143.6) | 26.9 | 19 | % | ||||||||||||||||||
| Comparable Adjustments | (51.6) | (45.7) | (5.9) | NM | |||||||||||||||||||
| Consolidated operating income (loss) | $ | 1,743.4 | $ | 1,629.5 | $ | 113.9 | 7 | % | |||||||||||||||
|
The increase in Beer operating income is largely attributable to the shipment volume growth within our Mexican beer portfolio and the favorable pricing impact, partially offset by higher material costs and marketing spend. |
||||
|
The decrease in Wine and Spirits operating income is largely attributable to the decline in branded wine and spirits shipment volume, the Wine Divestiture, and the decrease in non-branded net sales, partially offset by the lower cost of product sold and the favorable pricing impact and marketing spend. |
||||
|
As previously discussed, the Corporate Operations and Other increase in operating loss is largely due to the lower Digital Business Acceleration investments and compensation and benefits. |
||||
Income (loss) from unconsolidated investments
| Six Months 2024 |
Six Months 2023 |
Dollar Change |
Percent Change |
||||||||||||||||||||
| (in millions) | |||||||||||||||||||||||
Impairment of equity method investments |
$ | (135.8) | $ | (1,060.3) | $ | 924.5 | 87 | % | |||||||||||||||
| Unrealized net gain (loss) on securities measured at fair value | (74.4) | (31.7) | (42.7) | (135 | %) | ||||||||||||||||||
| Equity in earnings (losses) from Canopy and related activities | (231.8) | (815.7) | 583.9 | 72 | % | ||||||||||||||||||
| Equity in earnings (losses) from other equity method investees | 6.4 | 0.7 | 5.7 | NM | |||||||||||||||||||
| $ | (435.6) | $ | (1,907.0) | $ | 1,471.4 | 77 | % | ||||||||||||||||
Interest expense
Interest expense increased to $228.8 million for Six Months 2024 as compared to $182.8 million for Six Months 2023. This increase of $46.0 million, or 25%, is due to higher average borrowings of approximately
| Constellation Brands, Inc. Q2 FY 2024 Form 10-Q |
#WORTHREACHINGFOR I 41
|
||||
| MD&A | |||||
$1.4 billion and approximately 45 basis points of higher weighted average interest rates, partially offset by an increase in capitalized interest in connection with the Mexico Beer Projects. The higher average borrowings and weighted average interest rates are largely attributable to funding the aggregate cash payment to holders of Class B Stock in connection with the Reclassification. For additional information, refer to Note 8.
Loss on extinguishment of debt
Loss on extinguishment of debt primarily consists of a premium payment and the write-off of debt issuance costs in connection with the tender offers of our 3.20% February 2018 Senior Notes and 4.25% May 2013 Senior Notes and make-whole payments in connection with the early redemption of those notes (Six Months 2023).
(Provision for) benefit from income taxes
The provision for income taxes decreased to $238.4 million for Six Months 2024 from $257.8 million for Six Months 2023. Our effective tax rate for Six Months 2024 was 22.1% as compared with (53.3)% for Six Months 2023. In comparison to prior year, our income taxes were impacted primarily by:
•an increase in the valuation allowance related to our investment in Canopy, driven by the Canopy Equity Method Investment impairment recognized in the Six Months 2023; partially offset by
•a net income tax benefit from the realization of tax losses related to a prior period divestiture recognized in the Six Months 2023;
•a net income tax benefit as a result of a change in tax entity classification recognized in the Six Months 2024; and
•the effective tax rates applicable to our foreign businesses.
For additional information, refer to Note 9.
We continue to expect our reported effective tax rate for Fiscal 2024 to be in the range of 19% to 21%. This range does not reflect any future equity in earnings (losses) from the Canopy Equity Method Investment and related activities.
Net income (loss) attributable to CBI
Net income (loss) attributable to CBI increased to $825.9 million for Six Months 2024 from $(761.7) million for Six Months 2023. This increase of $1,587.6 million is primarily attributable to (i) lower Canopy Equity Method Investment impairment losses, (ii) the decrease in equity in losses from Canopy’s results, and (iii) the Six Months 2024 improvements within the Beer segment as shipment volume growth and favorable pricing exceeded higher operational costs and the increase in media investments.
Liquidity and Capital Resources
General
Our primary source of liquidity has been cash flow from operating activities. Our ability to consistently generate robust cash flow from our operations is one of our most significant financial strengths; it enables us to invest in our people and our brands, make capital investments and strategic acquisitions, provide a cash dividend program, and from time-to-time, repurchase shares of our common stock. Our largest use of cash in our operations is for purchasing and carrying inventories and carrying seasonal accounts receivable. Historically, we have used this cash flow to repay our short-term borrowings and fund capital expenditures. Additionally, our commercial paper program is used to fund our short-term borrowing requirements and to maintain our access to the capital markets. We use our short-term borrowings, including our commercial paper program, to support our working capital requirements and capital expenditures, among other things.
We seek to maintain adequate liquidity to meet working capital requirements, fund capital expenditures, and repay scheduled principal and interest payments on debt. Absent deterioration of market conditions, we
| Constellation Brands, Inc. Q2 FY 2024 Form 10-Q |
#WORTHREACHINGFOR I 42
|
||||
| MD&A | |||||
believe that cash flows from operating and financing activities will provide adequate resources to satisfy our working capital, scheduled principal and interest payments on debt, anticipated dividend payments, periodic share repurchases, and anticipated capital expenditure requirements for both our short-term and long-term capital needs.
We have an agreement with a financial institution for payment services and began to facilitate a voluntary supply chain finance program through this participating financial institution during Fiscal 2023. The program is available to certain of our suppliers allowing them the option to manage their cash flow. We are not a party to the agreements between the participating financial institution and the suppliers in connection with the program. Our rights and obligations to our suppliers, including amounts due and scheduled payment terms, are not impacted. As of August 31, 2023, the amount payable to this participating financial institution for suppliers who voluntarily participate in the supply chain finance program was $4.7 million and was included in accounts payable within our consolidated balance sheet. We account for payments made under the supply chain finance program the same as our other accounts payable, as a reduction to our cash flow from operating activities.
Cash Flows
| Six Months 2024 |
Six Months 2023 |
Dollar Change |
|||||||||||||||
| (in millions) | |||||||||||||||||
| Net cash provided by (used in): | |||||||||||||||||
| Operating activities | $ | 1,622.0 | $ | 1,654.3 | $ | (32.3) | |||||||||||
| Investing activities | (600.9) | (486.0) | (114.9) | ||||||||||||||
| Financing activities | (1,072.4) | (1,198.6) | 126.2 | ||||||||||||||
| Effect of exchange rate changes on cash and cash equivalents | 1.1 | (4.0) | 5.1 | ||||||||||||||
| Net increase (decrease) in cash and cash equivalents | $ | (50.2) | $ | (34.3) | $ | (15.9) | |||||||||||
Operating activities
The decrease in net cash provided by (used in) operating activities consists of:
| Six Months 2024 |
Six Months 2023 |
Dollar Change |
|||||||||||||||
| (in millions) | |||||||||||||||||
| Net income (loss) | $ | 839.9 | $ | (741.4) | $ | 1,581.3 | |||||||||||
| Unrealized net (gain) loss on securities measured at fair value | 74.4 | 31.7 | 42.7 | ||||||||||||||
| Deferred tax provision (benefit) | 26.3 | 208.6 | (182.3) | ||||||||||||||
| Equity in (earnings) losses of equity method investees and related activities, net of distributed earnings | 226.5 | 815.6 | (589.1) | ||||||||||||||
Impairment of equity method investments |
135.8 | 1,060.3 | (924.5) | ||||||||||||||
| Other non-cash adjustments | 388.4 | 374.3 | 14.1 | ||||||||||||||
| Change in operating assets and liabilities, net of effects from purchase and sale of business | (69.3) | (94.8) | 25.5 | ||||||||||||||
| Net cash provided by (used in) operating activities | $ | 1,622.0 | $ | 1,654.3 | $ | (32.3) | |||||||||||
The $25.5 million net change in operating assets and liabilities was largely driven by increases for the Beer segment in (i) inventory levels and (ii) accounts receivable, driven by timing of collections. These changes were partially offset by the timing of collections for (i) recoverable value-added taxes for the Beer segment and (ii) accounts payable for both the Beer and Wine and Spirits segments. Additionally, net cash provided by operating activities benefited from lower income tax payments in Six Months 2024 as compared to Six Months 2023.
| Constellation Brands, Inc. Q2 FY 2024 Form 10-Q |
#WORTHREACHINGFOR I 43
|
||||
| MD&A | |||||
Investing activities
Net cash used in investing activities increased to $600.9 million for Six Months 2024 from $486.0 million for Six Months 2023. This increase of $114.9 million, or 24%, was primarily due to additional capital expenditures of $147.0 million for Six Months 2024 largely related to the Mexico Beer Projects, partially offset by a decrease in business acquisitions of $29.7 million. The Six Months 2023 business acquisitions consisted of Lingua Franca and Austin Cocktails.
Financing activities
The decrease in net cash provided by (used in) financing activities consists of:
| Six Months 2024 |
Six Months 2023 |
Dollar Change |
|||||||||||||||
| (in millions) | |||||||||||||||||
| Net proceeds from (payments of) debt, current and long-term, and related activities | $ | (763.5) | $ | 499.7 | $ | (1,263.2) | |||||||||||
| Dividends paid | (327.6) | (295.3) | (32.3) | ||||||||||||||
| Purchases of treasury stock | (35.0) | (1,400.5) | 1,365.5 | ||||||||||||||
| Net cash provided by stock-based compensation activities | 75.0 | 20.0 | 55.0 | ||||||||||||||
| Distributions to noncontrolling interests | (21.3) | (22.5) | 1.2 | ||||||||||||||
| Net cash provided by (used in) financing activities | $ | (1,072.4) | $ | (1,198.6) | $ | 126.2 | |||||||||||
Debt
Total debt outstanding as of August 31, 2023, amounted to $11,706.5 million, a decrease of $754.8 million from February 28, 2023. This decrease consisted of:
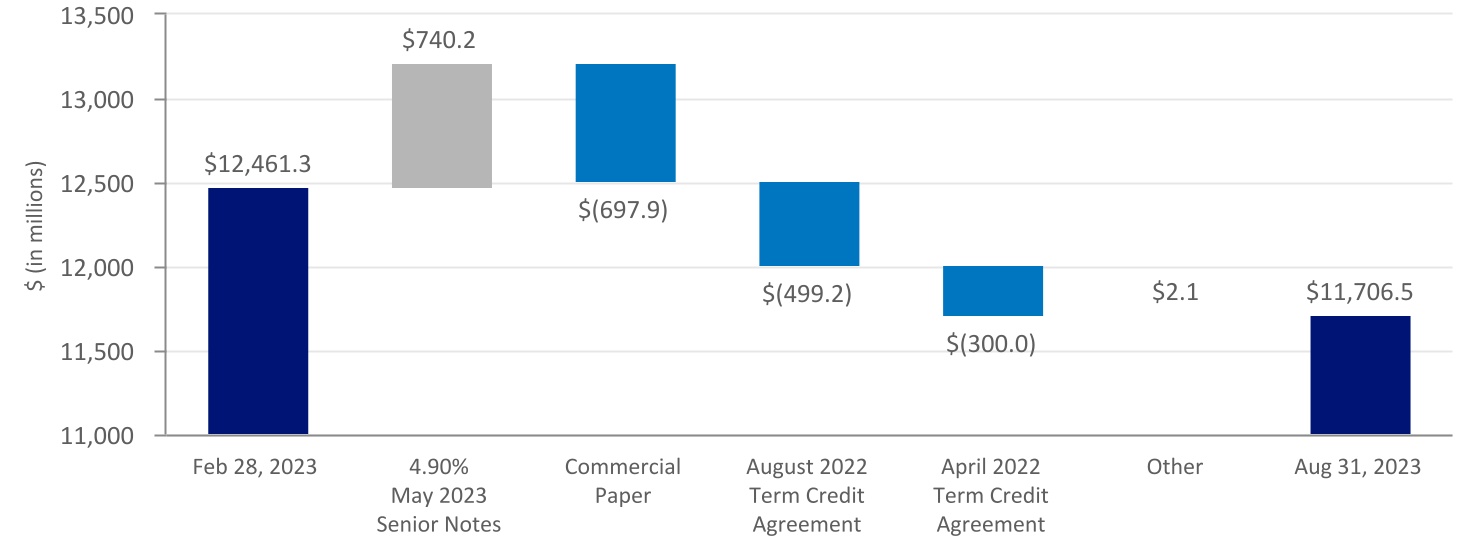
| Debt repayment | Debt issuance | ||||||||||||||||
Bank facilities
In May 2023, we repaid the outstanding three-year term loan facility borrowings under our August 2022 Term Credit Agreement with proceeds from the May 2023 Senior Notes (see “Senior notes” below). In August 2023, we repaid the outstanding five-year term loan facility borrowings under our April 2022 Term Credit Agreement with proceeds from commercial paper borrowings.
| Constellation Brands, Inc. Q2 FY 2024 Form 10-Q |
#WORTHREACHINGFOR I 44
|
||||
| MD&A | |||||
Senior notes
In May 2023, we issued the May 2023 Senior Notes. Proceeds from this offering, net of discount and debt issuance costs, of $739.8 million were used for general corporate purposes, including the repayment of outstanding borrowings under the August 2022 Term Credit Agreement and to reduce outstanding commercial paper borrowings.
General
The majority of our outstanding borrowings as of August 31, 2023, consisted of fixed-rate senior unsecured notes, with maturities ranging from calendar 2024 to calendar 2050.
Additionally, we have a commercial paper program which provides for the issuance of up to an aggregate principal amount of $2.25 billion of commercial paper. Our commercial paper program is backed by unused commitments under our revolving credit facility under our 2022 Credit Agreement. Accordingly, outstanding borrowings under our commercial paper program reduce the amount available under our revolving credit facility.
We do not have purchase commitments from buyers for our commercial paper and, therefore, our ability to issue commercial paper is subject to market demand. If the commercial paper market is not available to us for any reason when commercial paper borrowings mature, we will utilize unused commitments under our revolving credit facility under our 2022 Credit Agreement to repay commercial paper borrowings. We do not expect that fluctuations in demand for commercial paper will affect our liquidity given our borrowing capacity available under our revolving credit facility.
We had the following remaining borrowing capacity available under our 2022 Credit Agreement:
| August 31, 2023 |
September 30, 2023 |
||||||||||
| (in millions) | |||||||||||
Revolving credit facility (1)
|
$ | 1,770.5 | $ | 1,994.0 | |||||||
(1)Net of outstanding revolving credit facility borrowings and outstanding letters of credit under our 2022 Credit Agreement and outstanding borrowings under our commercial paper program (excluding unamortized discount) of $468.0 million and $244.5 million as of August 31, 2023, and September 30, 2023, respectively.
The financial institutions participating in our 2022 Credit Agreement have complied with prior funding requests and we believe they will comply with any future funding requests. However, there can be no assurances that any particular financial institution will continue to do so.
As of August 31, 2023, we and our subsidiaries were subject to covenants that are contained in our 2022 Credit Agreement, including those restricting the incurrence of additional subsidiary indebtedness, additional liens, mergers and consolidations, transactions with affiliates, and sale and leaseback transactions, in each case subject to numerous conditions, exceptions, and thresholds. The financial covenants are limited to a minimum interest coverage ratio and a maximum net leverage ratio, both as defined in our 2022 Credit Agreement. As of August 31, 2023, under our 2022 Credit Agreement, the minimum interest coverage ratio was 2.5x and the maximum net leverage ratio was 4.0x.
Our indentures relating to our outstanding senior notes contain certain covenants, including, but not limited to: (i) a limitation on liens on certain assets, (ii) a limitation on certain sale and leaseback transactions, and (iii) restrictions on mergers, consolidations, and the transfer of all or substantially all of our assets to another person.
As of August 31, 2023, we were in compliance with our covenants under our 2022 Credit Agreement and our indentures, and have met all debt payment obligations.
| Constellation Brands, Inc. Q2 FY 2024 Form 10-Q |
#WORTHREACHINGFOR I 45
|
||||
| MD&A | |||||
For further discussion and presentation of our borrowings and available sources of borrowing, refer to Note 12 of our consolidated financial statements included in our 2023 Annual Report and Note 8.
Common Stock Dividends
On October 4, 2023, our Board of Directors declared a quarterly cash dividend of $0.89 per share of Class A Stock and $0.80 per share of Class 1 Stock payable on November 17, 2023, to stockholders of record of each class as of the close of business on November 3, 2023.
We currently expect to continue to pay a regular quarterly cash dividend to stockholders of our common stock in the future, but such payments are subject to approval of our Board of Directors and are dependent upon our financial condition, results of operations, capital requirements, and other factors, including those set forth under Item 1A. “Risk Factors” of our 2023 Annual Report as supplemented by the additional factors set forth under Item 1A. “Risk Factors” included in this Form 10-Q.
Share Repurchase Program
Our Board of Directors authorized the repurchase of our publicly traded common stock of up to $2.0 billion under the 2021 Authorization. As of August 31, 2023, total shares repurchased under this authorization are as follows:
Class A Stock |
|||||||||||||||||
| Repurchase Authorization | Dollar Value of Shares Repurchased | Number of Shares Repurchased | |||||||||||||||
| (in millions, except share data) | |||||||||||||||||
| 2021 Authorization | $ | 2,000.0 | $ | 1,171.6 | 4,985,847 | ||||||||||||
Share repurchases under the 2021 Authorization may be accomplished at management’s discretion from time to time based on market conditions, our cash and debt position, and other factors as determined by management. Shares may be repurchased through open market or privately negotiated transactions. We may fund future share repurchases with cash generated from operations and/or proceeds from borrowings. Any repurchased shares will become treasury shares, including shares previously repurchased under the 2021 Authorization.
We currently expect to continue to repurchase shares in the future, but such repurchases are dependent upon our financial condition, results of operations, capital requirements, and other factors, including those set forth under Item 1A. “Risk Factors” of our 2023 Annual Report as supplemented by the additional factors set forth under Item 1A. “Risk Factors” included in this Form 10-Q.
For additional information, refer to Note 17 of our consolidated financial statements included in our 2023 Annual Report and Note 10.
Accounting Guidance
Accounting guidance adopted for Six Months 2024 did not have a material impact on our Financial Statements.
Information Regarding Forward-Looking Statements
This Form 10-Q contains “forward-looking statements” within the meaning of Section 27A of the Securities Act and Section 21E of the Exchange Act. These forward-looking statements are subject to a number of risks and uncertainties, many of which are beyond our control, which could cause actual results to differ materially from
| Constellation Brands, Inc. Q2 FY 2024 Form 10-Q |
#WORTHREACHINGFOR I 46
|
||||
| MD&A | |||||
those set forth in, or implied by, such forward-looking statements. All statements other than statements of historical fact included in this Form 10-Q are forward-looking statements, including without limitation:
•The statements under MD&A regarding:
◦our business strategy, growth plans, innovation, and Digital Business Acceleration initiatives, new products, future operations, financial position, net sales, expenses, cost savings initiatives, capital expenditures, effective tax rates and anticipated tax liabilities, expected volume, inventory, and demand levels and trends, long-term financial model, access to capital markets, liquidity and capital resources, and prospects, plans, and objectives of management;
◦our beer expansion, optimization, and/or construction activities, including anticipated scope, capacity, costs, capital expenditures, and timeframes for completion;
◦the potential sale of the remaining assets at the Mexicali Brewery;
◦our ESG strategy, sustainability initiatives, and environmental stewardship targets;
◦anticipated inflationary pressures, changing prices, and reductions in consumer discretionary income as well as other unfavorable global and regional economic conditions, geopolitical events, and military conflicts, and our responses thereto;
◦the potential impact to supply, production levels, and costs due to global supply chain disruptions and constraints and shifting consumer behaviors;
◦expected or potential actions of third parties, including possible changes to laws, rules, and regulations;
◦the future expected balance of supply and demand for and inventory levels of our products;
◦the continued refinement of our wine and spirits portfolio;
◦the availability of a supply chain finance program;
◦the manner, timing, and duration of the share repurchase program and source of funds for share repurchases; and
◦the amount and timing of future dividends.
•The statements regarding:
◦the potential completion of the Canopy Transaction, including the Canopy Amendment, and the transactions contemplated by the Consent Agreement, including conversion of our Canopy common shares for Exchangeable Shares, and related results and impacts of such transactions;
◦the potential exchange of our 2023 Canopy Promissory Note for Exchangeable Shares;
◦our activities surrounding our investment in Canopy;
◦a potential future impairment of our Canopy Equity Method Investment; and
◦our future ownership level in Canopy and our future share of Canopy’s reported earnings and losses.
•The statements regarding the future reclassification of net gains from AOCI.
When used in this Form 10-Q, the words “anticipate,” “intend,” “expect,” and similar expressions are intended to identify forward-looking statements, although not all forward-looking statements contain such identifying words. All forward-looking statements speak only as of the date of this Form 10-Q. We undertake no obligation to update or revise any forward-looking statements, whether as a result of new information, future events, or otherwise. Although we believe that the expectations reflected in the forward-looking statements are reasonable, we can give no assurance that such expectations will prove to be correct. In addition to the risks and uncertainties of ordinary business operations and conditions in the general economy and markets in which we compete, our forward-looking statements contained in this Form 10-Q are also subject to the risk, uncertainty, and possible variance from our current expectations regarding:
•water, agricultural and other raw material, and packaging material supply, production, and/or shipment difficulties which could adversely affect our ability to supply our customers;
•the ability to respond to anticipated inflationary pressures, including reductions in consumer discretionary income and our ability to pass along rising costs through increased selling prices;
•the actual impact to supply, production levels, and costs from global supply chain disruptions and constraints, transportation challenges (including from labor strikes or other labor activities), shifting consumer behaviors, wildfires, and severe weather events, due to, among other reasons, actual supply
| Constellation Brands, Inc. Q2 FY 2024 Form 10-Q |
#WORTHREACHINGFOR I 47
|
||||
| MD&A | |||||
chain and transportation performance, actual consumer behaviors, and the actual severity and geographical reach of wildfires and severe weather events;
•reliance on complex information systems and third‐party global networks;
•the actual balance of supply and demand for our products, the actual performance of our distributors and the actual demand, net sales, channel proportions, and volume trends for our products due to, among other reasons, actual shipments to distributors and actual consumer demand;
•beer operations expansion, optimization, and/or construction activities, scope, capacity, costs (including impairments), capital expenditures, and timing due to, among other reasons, market conditions, our cash and debt position, receipt of required regulatory approvals by the expected dates and on the expected terms, and other factors as determined by management;
•results of the potential sale of the remaining assets at the Mexicali Brewery or obtaining other forms of recovery;
•the impact of the military conflict in Ukraine and associated internal destabilization in Russia, geopolitical tensions, and responses, including on inflation, supply chains, commodities, energy, and cybersecurity;
•contamination and degradation of product quality from diseases, pests, weather, and other conditions;
•communicable disease outbreaks, pandemics, or other widespread public health crises, such as the COVID-19 pandemic, and associated governmental containment actions, which may include the closure of non-essential businesses (including our manufacturing facilities);
•the amount, timing, and source of funds for any share repurchases, if any, which may vary due to market conditions; our cash and debt position; the impact of the beer operations expansion, optimization, and/or construction activities; and other factors as determined by management from time to time;
•the amount and timing of future dividends which are subject to the determination and discretion of our Board of Directors and may be impacted if our ability to use cash flow to fund dividends is affected by unanticipated increases in total net debt, we are unable to generate cash flow at anticipated levels, or we fail to generate expected earnings;
•the accuracy of management’s projections relating to the Canopy investment due to Canopy’s actual results and market and economic conditions, and the impact of our investment in Canopy, including recording our proportional share of Canopy’s estimated pre-tax losses;
•the timeframe and amount of any potential future impairment of our Canopy Equity Method Investment;
•Canopy’s failure to receive the requisite approval of its shareholders necessary to approve the Canopy Transaction, any other delays with respect to, or the failure to complete, the Canopy Transaction, the ability to recognize the anticipated benefits of the Canopy Transaction and the impact of the Canopy Transaction on the market price of Canopy’s common stock;
•completion of the Canopy Transaction, the exchange of our 2023 Canopy Promissory Note for Exchangeable Shares, and the impact from converting our Canopy common shares for Exchangeable Shares on our relationship with and investment in Canopy;
•any impact of U.S. federal laws on Canopy Strategic Transactions or upon the implementation of such Canopy Strategic Transactions, or the impact of any Canopy Strategic Transaction upon our future ownership level in Canopy or our future share of Canopy’s reported earnings and losses;
•the expected impacts of wine and spirits portfolio refinement activities;
•purchase accounting with respect to any transaction, or the assumptions used regarding the assets purchased and liabilities assumed to determine their fair value;
•general economic, geopolitical, domestic, international, and regulatory conditions, world financial market and banking sector instability, including economic slowdown or recession, and a potential U.S. federal government shutdown;
•the ability to continue to recognize anticipated benefits of the Reclassification; and
•our targeted net leverage ratio due to market conditions, our ability to generate cash flow at expected levels, and our ability to generate expected earnings.
For additional information about risks and uncertainties that could cause actual results to differ materially from those set forth in or implied by our forward-looking statements, please refer to Item 1A. “Risk Factors” of our 2023 Annual Report as supplemented by the additional factors set forth under Item 1A. “Risk Factors” included in this Form 10-Q.
| Constellation Brands, Inc. Q2 FY 2024 Form 10-Q |
#WORTHREACHINGFOR I 48
|
||||
| OTHER KEY INFORMATION | |||||
Item 3. Quantitative and Qualitative Disclosures About Market Risk.
As a result of our global operating, investment, acquisition, divestiture, and financing activities, we are exposed to market risk associated with changes in foreign currency exchange rates, commodity prices, and interest rates. To manage the volatility relating to these risks, we periodically purchase and/or sell derivative instruments including foreign currency forward and option contracts, commodity swap contracts, interest rate swap contracts, and Pre-issuance hedge contracts. We use derivative instruments to reduce earnings and cash flow volatility resulting from shifts in market rates, as well as to hedge economic exposures. We do not enter into derivative instruments for trading or speculative purposes.
Foreign currency and commodity price risk
Foreign currency derivative instruments are or may be used to hedge existing foreign currency denominated assets and liabilities, forecasted foreign currency denominated sales/purchases to/from third parties as well as intercompany sales/purchases, intercompany principal and interest payments, and in connection with investments, acquisitions, or divestitures outside the U.S. As of August 31, 2023, we had exposures to foreign currency risk primarily related to the Mexican peso, Canadian dollar, New Zealand dollar, and euro. Approximately 100% of our balance sheet exposures and 81% of our forecasted transactional exposures for the remaining six months of Fiscal 2024 were hedged as of August 31, 2023.
Commodity derivative instruments are or may be used to hedge forecasted commodity purchases from third parties as either economic hedges or accounting hedges. As of August 31, 2023, exposures to commodity price risk which we are currently hedging include aluminum, corn, diesel fuel, and natural gas prices. Approximately 82% of our forecasted transactional exposures for the remaining six months of Fiscal 2024 were hedged as of August 31, 2023.
We have performed a sensitivity analysis to estimate our exposure to market risk of foreign exchange rates and commodity prices reflecting the impact of a hypothetical 10% adverse change in the applicable market. The volatility of the applicable rates and prices is dependent on many factors which cannot be forecasted with reliable accuracy. Gains or losses from the revaluation or settlement of the related underlying positions would substantially offset such gains or losses on the derivative instruments. The aggregate notional value, estimated fair value, and sensitivity analysis for our open foreign currency and commodity derivative instruments are summarized as follows:
| Aggregate Notional Value |
Fair Value, Net Asset (Liability) |
Increase (Decrease) in Fair Value – Hypothetical 10% Adverse Change |
|||||||||||||||||||||||||||||||||
| August 31, 2023 |
August 31, 2022 |
August 31, 2023 |
August 31, 2022 |
August 31, 2023 |
August 31, 2022 |
||||||||||||||||||||||||||||||
| (in millions) | |||||||||||||||||||||||||||||||||||
| Foreign currency contracts | $ | 2,715.8 | $ | 2,733.8 | $ | 322.5 | $ | 95.6 | $ | (173.6) | $ | (187.2) | |||||||||||||||||||||||
| Commodity derivative contracts | $ | 344.6 | $ | 328.9 | $ | (10.5) | $ | 66.5 | $ | 29.3 | $ | (34.6) | |||||||||||||||||||||||
Interest rate risk
The estimated fair value of our fixed interest rate debt is subject to interest rate risk, credit risk, and foreign currency risk. In addition, we also have variable interest rate debt outstanding (primarily SOFR-based), certain of which includes a fixed margin subject to the same risks identified for our fixed interest rate debt.
There were no cash flow designated or undesignated interest rate swap contracts or Pre-issuance hedge contracts outstanding as of August 31, 2023, or August 31, 2022.
We have performed a sensitivity analysis to estimate our exposure to market risk of interest rates reflecting the impact of a hypothetical 1% increase in the prevailing interest rates. The volatility of the applicable rates is dependent on many factors which cannot be forecasted with reliable accuracy.
| Constellation Brands, Inc. Q2 FY 2024 Form 10-Q |
#WORTHREACHINGFOR I 49
|
||||
| OTHER KEY INFORMATION | |||||
The aggregate notional value, estimated fair value, and sensitivity analysis for our outstanding fixed-rate debt, including current maturities, are summarized as follows:
| Aggregate Notional Value |
Fair Value, Net Asset (Liability) |
Increase (Decrease) in Fair Value – Hypothetical 1% Rate Increase |
|||||||||||||||||||||||||||||||||
| August 31, 2023 |
August 31, 2022 |
August 31, 2023 |
August 31, 2022 |
August 31, 2023 |
August 31, 2022 |
||||||||||||||||||||||||||||||
| (in millions) | |||||||||||||||||||||||||||||||||||
| Fixed interest rate debt | $ | 11,322.7 | $ | 10,068.1 | $ | (10,311.8) | $ | (9,309.1) | $ | (622.1) | $ | (648.4) | |||||||||||||||||||||||
A 1% hypothetical change in the prevailing interest rates would have increased interest expense on our variable interest rate debt by $6.0 million and $4.0 million for the six months ended August 31, 2023, and August 31, 2022, respectively.
For additional discussion on our market risk, refer to Notes 3 and 4.
Item 4. Controls and Procedures.
Disclosure controls and procedures
Our Chief Executive Officer and our Chief Financial Officer have concluded, based on their evaluation as of the end of the period covered by this report, that the Company’s “disclosure controls and procedures” (as defined in the Exchange Act Rules 13a-15(e) and 15d-15(e)) are effective to ensure that information required to be disclosed in the reports that we file or submit under the Exchange Act (i) is recorded, processed, summarized, and reported within the time periods specified in the SEC’s rules and forms, and (ii) is accumulated and communicated to our management, including our Chief Executive Officer and our Chief Financial Officer, as appropriate to allow timely decisions regarding required disclosure.
Internal control over financial reporting
In connection with the foregoing evaluation by our Chief Executive Officer and our Chief Financial Officer, no changes were identified in the Company’s “internal control over financial reporting” (as defined in the Exchange Act Rules 13a-15(f) and 15d-15(f)) that occurred during our fiscal quarter ended August 31, 2023, that have materially affected, or are reasonably likely to materially affect, our internal control over financial reporting.
| Constellation Brands, Inc. Q2 FY 2024 Form 10-Q |
#WORTHREACHINGFOR I 50
|
||||
| OTHER KEY INFORMATION | |||||
PART II – OTHER INFORMATION
Item 1. Legal Proceedings.
For additional information regarding Legal Proceedings, see Item 1A. “Risk Factors.”
Item 1A. Risk Factors.
In addition to information discussed elsewhere in this Form 10-Q, you should carefully consider the risk factors disclosed in the 2023 Annual Report. The risk factors associated with our business have not materially changed compared to the risk factors disclosed in the 2023 Annual Report except for the updated risk factor below. The risk factor described below and the additional risks described in the 2023 Annual Report are not the only risks we face. Additional factors not presently known to us or that we currently deem to be immaterial could materially affect our business, liquidity, financial condition, and/or results of operations in future periods. The following risk factor is organized under a relevant heading; however, it may be relevant to other headings as well.
Strategic Risks
Dependence upon trademarks and proprietary rights, failure to protect our intellectual property rights
Our future success depends significantly on our ability to protect our current and future brands and products and to defend our intellectual property rights. We have been granted numerous trademark registrations and use certain trademarks under license covering our brands and products, and we have filed, and expect to continue to file or have filed on our behalf, trademark applications seeking to protect newly developed brands and products. We cannot be sure that trademark registrations will be issued with respect to any of such trademark applications. We could also, by omission, fail to timely renew or protect a trademark and our competitors could challenge, invalidate, or circumvent any existing or future trademarks issued to, or licensed by, us.
Our subsidiaries CB Brand Strategies, LLC, Crown Imports LLC, and Compañía Cervecera de Coahuila, S. de R.L. de C.V. were named as defendants in a lawsuit originally filed in U.S. District Court for the Southern District of New York on February 15, 2021, and most recently amended on March 16, 2022, by Cervecería Modelo de México, S. de R.L. de C.V. and Trademarks Grupo Modelo, S. de R.L. de C.V. captioned Cervecería Modelo de México, S. de R.L. de C.V., et al. v. CB Brand Strategies, LLC, et al., Case No. 21 Civ. 01317-LAK (S.D.N.Y.). The plaintiffs alleged, among other things, that our sub-license of the trademarks for our Mexican beer brands should not permit us to use the Corona brand name on our Corona Hard Seltzer or the Modelo brand name on our Modelo Ranch Water. On August 5, 2022, both the plaintiffs and the defendants filed motions for summary judgment. On November 3, 2022, the court denied our motion for summary judgment. On December 13, 2022, the court denied plaintiffs’ motion for summary judgment. At a trial in March 2023, the jury returned a unanimous verdict in our favor on all counts in the plaintiffs’ complaint, and the court entered judgment dismissing the complaint on March 15, 2023. On April 12, 2023, the plaintiffs filed a motion for judgment as a matter of law or, in the alternative, for a new trial with the court, which motion was denied on April 14, 2023.
On May 12, 2023, the plaintiffs filed a notice of appeal to the U.S. Court of Appeals for the Second Circuit from the final judgment entered in the above-captioned case, rulings and orders incorporated in, antecedent to, or ancillary to that final judgment, and the court’s order denying the plaintiffs’ motion for judgment as a matter of law or, in the alternative, for a new trial in that action. The appeal is captioned Cervecería Modelo de México, S. de R.L. de C.V., et al. v. CB Brand Strategies, LLC, et al., Case No. 23-810 (2d Cir.). The plaintiffs’ principal brief was filed on August 22, 2023. Our response brief is due on or before November 21, 2023, and plaintiffs’ reply brief is due within 21 days after the filing of our response brief.
While we continue to believe this lawsuit is without merit, litigation is inherently unpredictable and subject to substantial uncertainties and unfavorable developments and resolutions could occur. In addition, our cost of defending this litigation has been and could continue to be substantial. If we are not successful, we may not be able to market Corona Hard Seltzer in its current formulation under the Corona brand name or Modelo Ranch Water product in its current formulation under the Modelo brand name and we may be required to pay
| Constellation Brands, Inc. Q2 FY 2024 Form 10-Q |
#WORTHREACHINGFOR I 51
|
||||
| OTHER KEY INFORMATION | |||||
damage awards, each of which may have an adverse effect on our business, liquidity, financial condition and/or results of operations.
We have been and may continue to be subject to other litigation related to our trademarks and intellectual property rights. A substantial adverse judgment or other unfavorable resolution of these matters or our failure to otherwise protect our intellectual property rights as well as the costs associated with such activities could have a material adverse effect on our business, liquidity, financial condition, and/or results of operations.
Item 5. Other Information.
During the three months ended August 31, 2023, none of our directors or officers (as defined in Exchange Act Rule 16a-1(f)) adopted terminated
| Constellation Brands, Inc. Q2 FY 2024 Form 10-Q |
#WORTHREACHINGFOR I 52
|
||||
| OTHER KEY INFORMATION | |||||
Item 6. Exhibits.
| Incorporated by Reference | ||||||||||||||||||||
| Exhibit No. | Exhibit Description | Form | Exhibit | Filing Date | ||||||||||||||||
| 2.1 | 8-K | 2.1 | August 16, 2018 | |||||||||||||||||
| 2.2 | 10-Q | 2.2 | January 9, 2019 | |||||||||||||||||
| 3.1 | 8-K | 3.1 | November 10, 2022 | |||||||||||||||||
| 3.2 | 8-K | 3.2 | November 10, 2022 | |||||||||||||||||
| 4.1 | 8-K | 4.1 | April 23, 2012 | |||||||||||||||||
| 4.2 | 8-K | 4.4 | June 11, 2013 | |||||||||||||||||
| 4.3 | 10-Q | 4.21 | July 10, 2014 | |||||||||||||||||
| 4.4 | 8-K | 4.2 | November 7, 2014 | |||||||||||||||||
| 4.5 | 8-K | 4.1 | December 8, 2015 | |||||||||||||||||
| 4.6 | 10-K | 4.26 | April 25, 2016 | |||||||||||||||||
| 4.7 | 8-K | 4.1 | December 6, 2016 | |||||||||||||||||
| 4.8 | 8-K | 4.2 | May 9, 2017 | |||||||||||||||||
| 4.9 | 8-K | 4.3 | May 9, 2017 | |||||||||||||||||
| 4.10 | 8-K | 4.2 | February 7, 2018 | |||||||||||||||||
| 4.11 | 8-K | 4.3 | February 7, 2018 | |||||||||||||||||
| 4.12 | 8-K | 4.2 | October 29, 2018 | |||||||||||||||||
| Constellation Brands, Inc. Q2 FY 2024 Form 10-Q |
#WORTHREACHINGFOR I 53
|
||||
| OTHER KEY INFORMATION | |||||
| Incorporated by Reference | ||||||||||||||||||||
| Exhibit No. | Exhibit Description | Form | Exhibit | Filing Date | ||||||||||||||||
| 4.13 | 8-K | 4.3 | October 29, 2018 | |||||||||||||||||
| 4.14 | 8-K | 4.4 | October 29, 2018 | |||||||||||||||||
| 4.15 | 8-K | 4.1 | July 29, 2019 | |||||||||||||||||
| 4.16 | 8-K | 4.1 | April 27, 2020 | |||||||||||||||||
| 4.17 | 8-K | 4.2 | April 27, 2020 | |||||||||||||||||
| 4.18 | 8-K | 4.1 | July 26, 2021 | |||||||||||||||||
| 4.19 | 8-K | 4.1 | May 9, 2022 | |||||||||||||||||
| 4.20 | 8-K | 4.2 | May 9, 2022 | |||||||||||||||||
| 4.21 | 8-K | 4.3 | May 9, 2022 | |||||||||||||||||
| 4.22 | 8-K | 4.1 | February 2, 2023 | |||||||||||||||||
| 4.23 | 8-K | 4.1 | May 1, 2023 | |||||||||||||||||
| 4.24 | 8-K | 4.1 | April 15, 2022 | |||||||||||||||||
| 4.25 | 8-K | 4.2 | October 26, 2022 | |||||||||||||||||
| 10.1 | 8-K | 10.1 | July 18, 2023 | |||||||||||||||||
| Constellation Brands, Inc. Q2 FY 2024 Form 10-Q |
#WORTHREACHINGFOR I 54
|
||||
| OTHER KEY INFORMATION | |||||
| Incorporated by Reference | ||||||||||||||||||||
| Exhibit No. | Exhibit Description | Form | Exhibit | Filing Date | ||||||||||||||||
| 10.2 | 8-K | 10.2 | July 18, 2023 | |||||||||||||||||
| 31.1 | ||||||||||||||||||||
| 31.2 | ||||||||||||||||||||
| 32.1 | ||||||||||||||||||||
| 32.2 | ||||||||||||||||||||
| 99.1 | 6-K | 99.4 | April 30, 2019 | |||||||||||||||||
| 99.2 | 6-K | 99.3 | April 30, 2019 | |||||||||||||||||
| 99.3 | 8-K | 99.2 | October 26, 2022 | |||||||||||||||||
| 99.4 | 8-K | 99.1 | July 10, 2023 | |||||||||||||||||
| 101.INS | XBRL Instance Document - the instance document does not appear in the Interactive Data File because its XBRL tags are embedded within the Inline XBRL document (filed herewith). | |||||||||||||||||||
| 101.SCH | XBRL Taxonomy Extension Schema Document (filed herewith). | |||||||||||||||||||
| 101.CAL | XBRL Taxonomy Extension Calculation Linkbase Document (filed herewith). | |||||||||||||||||||
| 101.DEF | XBRL Taxonomy Extension Definition Linkbase Document (filed herewith). | |||||||||||||||||||
| 101.LAB | XBRL Taxonomy Extension Labels Linkbase Document (filed herewith). | |||||||||||||||||||
| 101.PRE | XBRL Taxonomy Extension Presentation Linkbase Document (filed herewith). | |||||||||||||||||||
| 104 | Cover Page Interactive Data File (formatted as Inline XBRL and contained in Exhibit 101). | |||||||||||||||||||
| * | Designates management contract or compensatory plan or arrangement. | ||||
| † | The exhibits, disclosure schedules, and other schedules, as applicable, have been omitted pursuant to Item 601(a)(5) of Regulation S-K. The Company agrees to furnish supplementally a copy of such exhibits, disclosure schedules, and other schedules, as applicable, or any section thereof, to the SEC upon request. | ||||
The Company agrees, upon request of the SEC, to furnish copies of each instrument that defines the rights of holders of long-term debt of the Company or its subsidiaries that is not filed herewith pursuant to Item 601(b)(4)(iii)(A) because the total amount of long-term debt authorized under such instrument does not exceed 10% of the total assets of the Company and its subsidiaries on a consolidated basis.
| Constellation Brands, Inc. Q2 FY 2024 Form 10-Q |
#WORTHREACHINGFOR I 55
|
||||
SIGNATURES
Pursuant to the requirements of the Securities Exchange Act of 1934, the registrant has duly caused this report to be signed on its behalf by the undersigned, thereunto duly authorized.
| CONSTELLATION BRANDS, INC. | |||||||||||
| Date: | October 5, 2023 | By: | /s/ Darrell Hearne | ||||||||
| Darrell Hearne, Senior Vice President and Controller |
|||||||||||
| Date: | October 5, 2023 | By: | /s/ Garth Hankinson | ||||||||
| Garth Hankinson, Executive Vice President and Chief Financial Officer (principal financial officer and principal accounting officer) |
|||||||||||
| Constellation Brands, Inc. Q2 FY 2024 Form 10-Q |
#WORTHREACHINGFOR I 56
|
||||