EX-99.1
Published on October 5, 2023
Exhibit 99.1

Beer Business Generates Double-Digit Net Sales and Operating Income Growth Supporting Uplift in its Fiscal 2024 Guidance to Higher-End of Initial Ranges
Modelo Especial Continues to Deliver Leading Share Gains and
Extends Leading Position in U.S. Beer Category in Dollar Sales in Tracked Channels
Extends Leading Position in U.S. Beer Category in Dollar Sales in Tracked Channels
Raises Earnings Per Share Guidance For Fiscal 2024
| Net Sales |
Operating Income (Loss) |
Net Income (Loss) Attributable to CBI |
Adjusted Earnings Before Interest & Taxes |
Diluted Net Income (Loss) Per Share Attributable to CBI (EPS) |
EPS Excluding Canopy EIE |
|||||||||||||||
Second Quarter Fiscal Year 2024 Financial Highlights (1) | In millions, except per share data
| ||||||||||||||||||||
| Reported | $2,837 | $979 | $690 | $959 | $3.74 | NA | ||||||||||||||
| % Change | 7% | 20% | NM | NM | NM | NA | ||||||||||||||
| Comparable | $2,837 | $968 | $682 | $955 | $3.70 | $3.80 | ||||||||||||||
| % Change | 7% | 10% | 16% | 12% | 17% | 14% | ||||||||||||||
(1) Definitions of reported, comparable, adjusted, organic, and Canopy EIE, as well as reconciliations of non-GAAP financial measures, are contained elsewhere in this news release. Comparable, adjusted, organic, and "excluding Canopy EIE" amounts are non-GAAP financial measures.
NA=Not Applicable NM=Not Meaningful
HIGHLIGHTS
•Achieves reported EPS of $3.74 and comparable EPS of $3.70; excluding Canopy EIE, generates comparable EPS of $3.80
•Beer Business achieves strong net sales and operating income each posting double-digit increases and a high-single digit depletion growth primarily driven by continued momentum of the Modelo brand family
•Wine and Spirits Business delivers strong relative performance, driven by our largest higher-end Wine brands, including Meiomi and Kim Crawford outpacing their corresponding category segment, in Circana channels
•Generates $1.6 billion of operating cash flow, a decrease of 2%, and $1.0 billion of free cash flow, a decrease of 15% driven by brewery capacity investments
•Raises fiscal 2024 reported EPS outlook to $9.60 - $9.80 and comparable EPS outlook to $12.00 - $12.20
•Affirms fiscal 2024 operating cash flow target of $2.4 - $2.6 billion and free cash flow projection of $1.2 - $1.3 billion
•Declares quarterly cash dividend of $0.89 per share Class A Common Stock
 | ||||||||||||||||||||
 |
"Our Beer Business this quarter delivered double-digit net sales and operating income growth. Modelo Especial continued to outperform the market as the top share gainer and solidified its position as the #1 Beer in U.S. tracked channels. Meanwhile, our higher-end wine brands, Meiomi and Kim Crawford outperformed their corresponding segment in tracked channels and we continue to expect solid growth acceleration and margin improvement from our overall Wine and Spirits Business in the second half." |
 |
"The record top-line and operating income performance of our Beer Business has enabled us to keep delivering on our capital allocation priorities, as we continue to move closer to our net leverage ratio target while returning cash to shareholders in-line with our dividend payout ratio target and advancing our modular brewery capacity expansions. We continue to make good progress against our operating and financial plans for Fiscal 24, and our interest expense management actions have enabled us to raise our earnings per share outlook." |
|||||||||||||||||
| Bill Newlands | Garth Hankinson | |||||||||||||||||||
President and Chief Executive Officer |
Chief Financial Officer | |||||||||||||||||||
Constellation Brands, Inc. Q2 FY 2024 Earnings Release |
#WORTHREACHINGFOR I 1
|
||||

 |
beer | ||||||||||||||||
| Shipments | Depletions | Net Sales |
Operating
Income (Loss)
|
||||||||||||||
Three Months Ended | In millions; branded product, 24-pack, 12-ounce case equivalents | |||||||||||||||||
| August 31, 2023 | 123.0 | $2,392.7 | $953.9 | ||||||||||||||
| August 31, 2022 | 113.2 | $2,139.3 | $865.6 | ||||||||||||||
| % Change | 8.7% | 7.9% | 12% | 10% | |||||||||||||
•Constellation’s Beer Business posted a 12% net sales increase driven by an uplift in shipments of 8.7%, reflecting continued strong demand across our high-end portfolio. Depletion volume grew 7.9%, with selling days flat year-over-year, driven by:
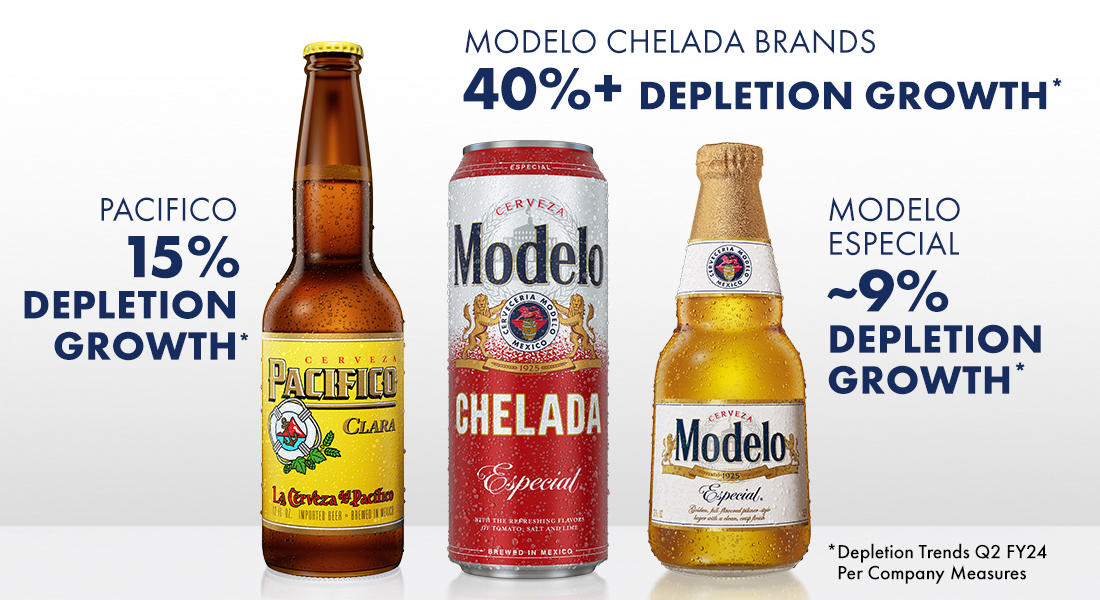
◦Modelo Especial growing nearly 9%;
◦Modelo Chelada brands posting over 40% growth;
◦Corona Extra delivering approximately 1% growth; and
◦Pacifico accelerating growth to 15%.
•In Circana channels, our Beer Business continued to outperform the entire beer and high-end categories in dollar sales growth and volume growth. Constellation was the #1 share gainer in market dollars for a ninth consecutive quarter and now has 6 of the top 15 share gaining brands across Total Beer driven by:
◦Modelo Especial remaining the #1 brand share gainer and the #1 brand in the entire U.S. beer category in dollar sales;
◦Modelo Chelada brands continuing to be the #1 chelada in the U.S. beer market, and holding nearly 70% market share of the entire chelada segment;
◦Corona Extra being the #3 high-end beer brand; and
◦Pacifico remaining the #7 share gainer in the high-end.
•Recent innovations are performing strongly with Modelo Oro holding the #2 new brand spot since its national launch this year, and Corona Non-Alcoholic and Modelo Chelada Sandía Picante reaching the #1 share gainer spot in Non-Alcoholic Beer and #5 overall new brand spot, respectively, since their launch this year.
•Operating margin decreased 60 basis points to 39.9% as benefits from net sales growth, pricing, and operational and cost efficiency initiatives were more than offset by higher raw materials costs due to ongoing inflationary pressures, costs related to a voluntary keg product recall, and incremental depreciation and operating costs from brewery capacity expansions.
•The Beer Business updates guidance and now expects net sales and operating income growth of 8 - 9% and 6 - 7%, respectively, for fiscal 2024.
 |
wine and spirits | ||||||||||||||||||||||
| Shipments |
Organic Shipments (1) (2)
|
Depletions (1) (2)
|
Net Sales (3)
|
Organic
Net Sales (1)
|
Operating
Income (Loss) (3)
|
||||||||||||||||||
| Three Months Ended | In millions; branded product, 9-liter case equivalents | |||||||||||||||||||||||
| August 31, 2023 | 6.1 | 6.1 | $444.1 | $444.1 | $80.7 | ||||||||||||||||||
| August 31, 2022 | 7.4 | 7.2 | $515.8 | $501.4 | $99.4 | ||||||||||||||||||
| % Change | (17.6%) | (15.3%) | (7.8%) | (14%) | (11%) | (19%) | |||||||||||||||||
(2) Includes adjustments to remove volumes associated with the Wine Divestiture (as defined below) for the period June 1, 2022, through August 31, 2022, included in the three months ended August 31, 2022.
(3) Three months ended August 31, 2022, includes $14.4 million of net sales and $7.4 million of gross profit less marketing that are no longer part of the wine and spirits segment results due to the Wine Divestiture.
HIGHLIGHTS
•Our largest higher-end Wine brands, Meiomi and Kim Crawford, delivered 7% and 6% depletion growth, respectively, and outpaced the higher-end wine segment in dollar sales and volume growth in Circana channels. Our crafts spirits portfolio delivered over 30% depletion growth.
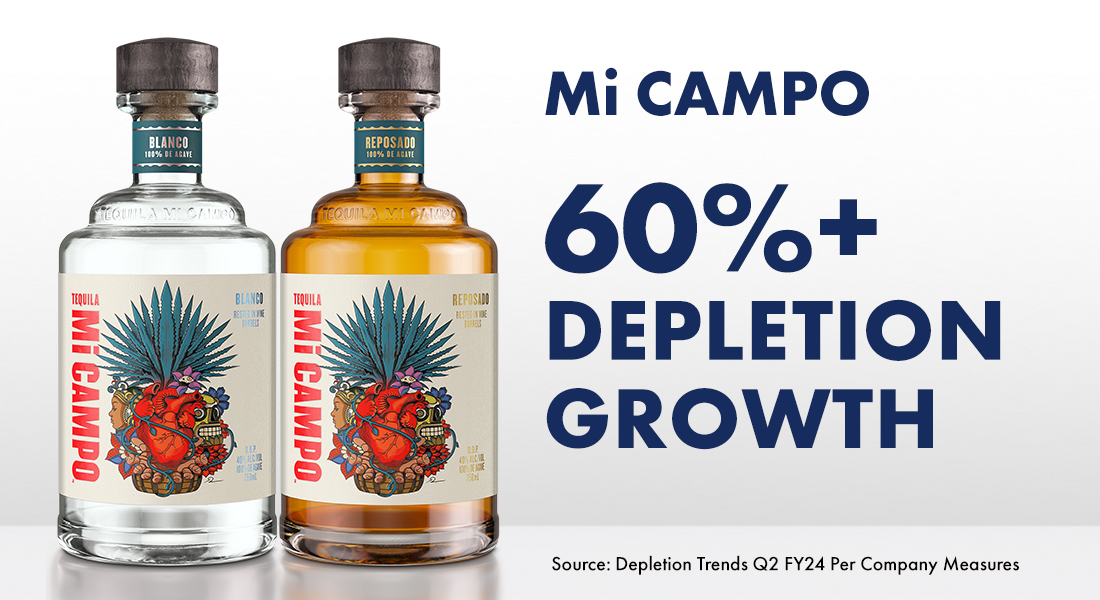
•In our fine wine and craft spirits portfolio, our largest brands, The Prisoner Wine Company portfolio and Mi CAMPO tequila, achieved 2% and over 60% depletion growth, respectively.
•Amongst betterment brands introduced within the last two years, Meiomi Bright maintained the #1 new wine brand position and SIMI Brightful held the #5 position in Circana channels.
•Operating margin decreased 110 basis points to 18.2% as benefits from lower freight and material costs, and planned efficiencies in marketing expense were more than offset by reduced shipments.
•The Wine and Spirits Business continues to expect fiscal 2024 organic net sales decline of 0.5% to growth of 0.5% and operating income growth of 2 - 4%; see Fiscal 2024 Guidance Assumptions under Outlook for more information.
Constellation Brands, Inc. Q2 FY 2024 Earnings Release |
#WORTHREACHINGFOR I 2
|
||||
outlook | |||||||||||||||||||||||
| The table sets forth management's current EPS expectations for fiscal 2024 compared to fiscal 2023 actual results, on a reported basis, a comparable basis, and a comparable basis excluding Canopy equity earnings (losses) and related activities. | |||||||||||||||||||||||
| Reported | Comparable | ||||||||||||||||||||||
| FY24 Estimate | FY23 Actual | FY24 Estimate (Excl. Canopy EIE) | FY23 Actual | FY23 Actual (Excl. Canopy EIE) |
|||||||||||||||||||
| Fiscal Year Ending February 28/29 | $9.60 - $9.80 | $(0.11) | $12.00 - $12.20 | $10.65 | $11.40 | ||||||||||||||||||
| Fiscal 2024 Guidance Assumptions: | |||||||||||||||||||||||
|
•Beer: net sales growth of 8 - 9%; operating income growth of 6 - 7%
•Wine and Spirits: organic net sales decline of 0.5% to growth of 0.5%; operating income growth of 2 - 4%, excluding $38.5 million of net sales and $19.5 million of gross profit less marketing that are no longer part of results
•Corporate expense: $270 million
•Interest expense: $460 million
|
•Tax rate: reported approximately 20%; comparable excluding Canopy equity earnings impact approximately 19%
•Weighted average diluted shares outstanding: approximately 184 million
•Operating cash flow: $2.4 - $2.6 billion
•Capital expenditures: $1.2 - $1.3 billion, including approximately $1 billion targeted for Mexico beer operations activities
•Free cash flow: $1.2 - $1.3 billion
|
||||||||||||||||||||||
The reported EPS guidance includes the fiscal 2024 year to date Canopy impairment and equity earnings and related activities impact. Additionally, the company continues to evaluate the future potential equity earnings impact from the Canopy equity method investment and related activities and, as such, these items have been excluded from the guidance assumptions noted above. | |||||||||||||||||||||||
BEER BUSINESS CAPITAL EXPANSION
As of second quarter fiscal 2024, the company has completed its latest modular brewery capacity expansion project at the Obregon facility and now has a total of approximately 47 million hectoliters of capacity across its existing facilities in Mexico. Looking ahead, the company remains on track to bring on the alternative beverage alcohol (“ABA”) line at the Nava facility towards the end of this fiscal year, and the development of additional modular expansion at Obregon and its third brewery site at Veracruz continue to advance as planned.
CANOPY INVESTMENT
Constellation’s share of Canopy’s equity earnings (losses) and related activities were as follows: | |||||||||||
| Reported | Comparable | ||||||||||
| Three Months Ended I In millions | |||||||||||
August 31, 2023 |
$(12.0) | $(19.5) | |||||||||
August 31, 2022 |
$(650.7) | $(34.8) | |||||||||
QUARTERLY DIVIDEND
On October 4, 2023, Constellation’s board of directors declared a quarterly cash dividend of $0.89 per share of Class A Common Stock payable on November 17, 2023, to stockholders of record as of the close of business on November 3, 2023.
† A copy of this news release, including the attachments and other financial information that may be discussed during the call, will be available on our investor relations website, ir.cbrands.com, prior to the call.

Constellation Brands, Inc. Q2 FY 2024 Earnings Release |
#WORTHREACHINGFOR I 3
|
||||
| CONSTELLATION BRANDS TO HOST INVESTOR DAY | ||||||||
|
Constellation Brands' Investor Day event is scheduled to begin at 2:00 p.m. EDT and is expected to provide investors, analysts, and other stakeholders with a comprehensive overview of the company's continued value creation opportunities supported by its strategic priorities.
During the event, members of Constellation Brands' executive and broader leadership teams will present insights into the company's leading performance and plans for ongoing success, including through: the continued growth of the company’s iconic higher-end beer, wine, and spirits brands portfolio; its efforts to capitalize on emerging beverage trends through its consumer-led approach to innovation; the company’s ambitions to consistently achieve strong revenue growth and profitability, as well as to deliver value to shareholders by deploying capital in-line with disciplined and balanced priorities; and its latest achievements and initiatives to serve as a good steward of the environment, enhance social equity in underserved communities, promote responsible beverage alcohol consumption, and to continue implementing value-additive governance enhancements.
|
 |
|||||||
|
In-person attendance for financial analysts and institutional investors will be by invitation only due to limited capacity, but presentation materials and a live video webcast of the event, as well as a replay of the webcast following the event, will be made available through the company’s investor relations website at ir.cbrands.com under the News & Events section.
When the presentation begins, financial information discussed in the presentation, and a reconciliation of reported GAAP financial measures with comparable and other non-GAAP financial measures, will also be available on the company’s investor relations website under the Financial History section. For anyone unable to participate in the webcast, a replay will be available on the company’s investor relations website through the close of business on May 2, 2024.
| ||||||||
|
ABOUT CONSTELLATION BRANDS
Constellation Brands (NYSE: STZ) is a leading international producer and marketer of beer, wine, and spirits with operations in the U.S., Mexico, New Zealand, and Italy. Our mission is to build brands that people love because we believe elevating human connections is Worth Reaching For. It’s worth our dedication, hard work, and calculated risks to anticipate market trends and deliver more for our consumers, shareholders, employees, and industry. This dedication is what has driven us to become one of the fastest-growing, large CPG companies in the U.S. at retail, and it drives our pursuit to deliver what’s next.
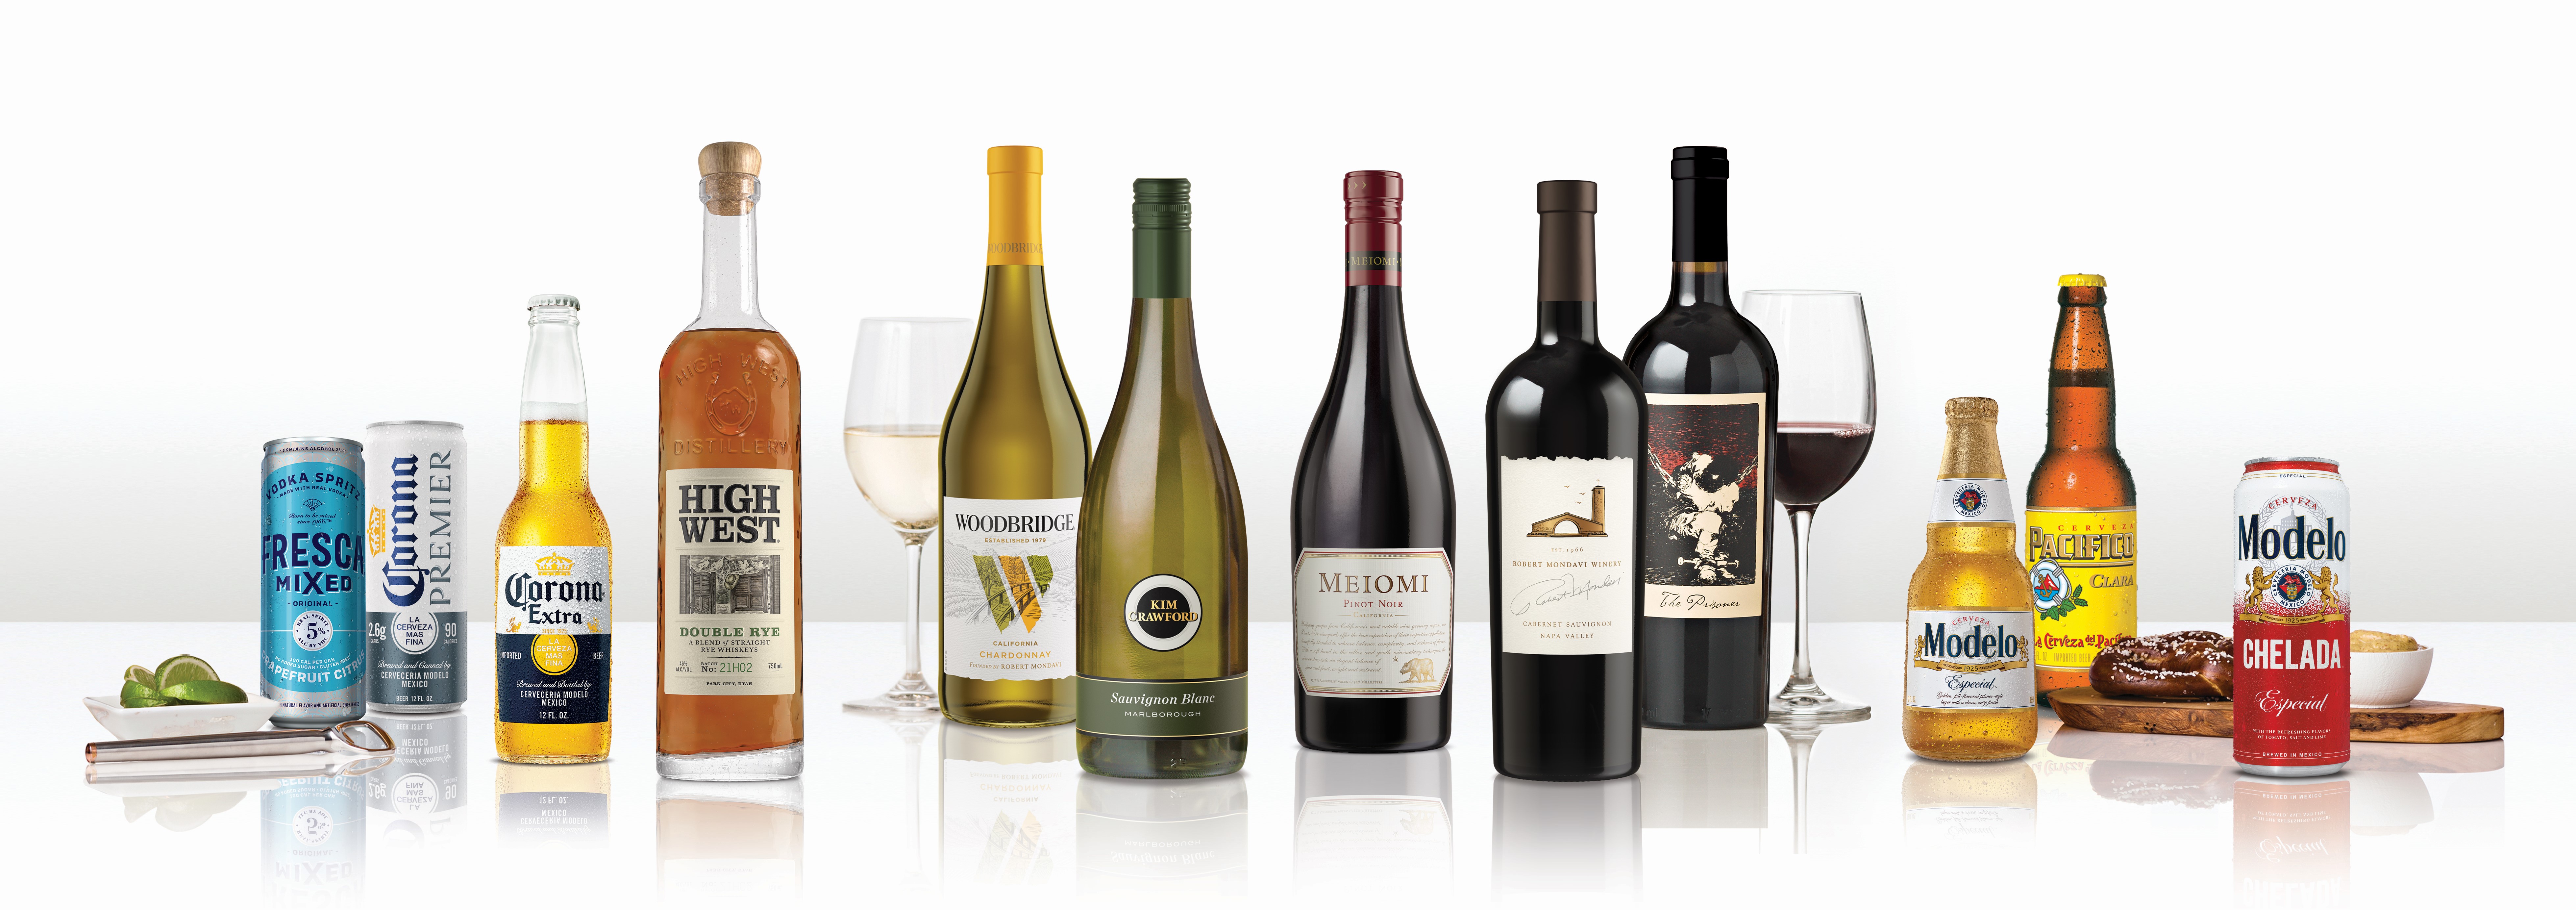
Every day, people reach for our high-end, iconic imported beer brands such as those in the Corona brand family like the flagship Corona Extra, Modelo Especial and the flavorful lineup of Modelo Cheladas, Pacifico, and Victoria; our fine wine and craft spirits brands, including The Prisoner Wine Company, Robert Mondavi Winery, Casa Noble Tequila, and High West Whiskey; and our premium wine brands such as Kim Crawford and Meiomi.
As an agriculture-based company, we have a long history of operating sustainably and responsibly. Our ESG strategy is embedded into our business and our work focuses on serving as good stewards of the environment, enhancing social equity within our industry and communities, and promoting responsible beverage alcohol consumption. These commitments ground our aspirations beyond driving the bottom line as we work to create a future that is truly Worth Reaching For.
To learn more, visit www.cbrands.com and follow us on X, Instagram, and LinkedIn.
| ||
| MEDIA CONTACTS | INVESTOR RELATIONS CONTACTS | ||||||||||||||||
| Amy Martin | 585-678-7141 | amy.martin@cbrands.com | Joseph Suarez | 773-551-4397 | joseph.suarez@cbrands.com | ||||||||||||
| Snehal Shah | 847-385-4940 | snehal.shah@cbrands.com | |||||||||||||||
| David Paccapaniccia | 585-282-7227 | david.paccapaniccia@cbrands.com | |||||||||||||||
Constellation Brands, Inc. Q2 FY 2024 Earnings Release |
#WORTHREACHINGFOR I 4
|
||||
SUPPLEMENTAL INFORMATION
Reported basis (“reported”) are derived from amounts as reported under generally accepted accounting principles in the U.S. Comparable basis (“comparable”) are amounts which exclude items that affect comparability (“comparable adjustments”), as they are not reflective of core operations of the segments. The company’s measure of segment profitability excludes comparable adjustments, which is consistent with the measure used by management to evaluate results. The company discusses various non-GAAP measures in this news release (“release”). Financial statements, as well as supplemental schedules and tables reconciling non-GAAP measures, together with definitions of these measures and the reasons management uses these measures, are included in this release.
FORWARD-LOOKING STATEMENTS
The statements made under the heading Outlook and all statements other than statements of historical fact set forth in this release, including statements regarding our business strategy, growth plans, innovation, new products, future operations, financial position, expected net sales, costs, expenses, operating income, effective tax rates, anticipated tax liabilities, capital expenditures, operating cash flow, and free cash flow, estimated diluted EPS and shares outstanding, future payments of dividends, amount, manner, and timing of share repurchases under the share repurchase authorization, consumer demand, ESG goals and efforts, investor day activities, and prospects, plans, and objectives of management, as well as information concerning expected actions of third parties, are forward-looking statements (collectively, “Projections”) that involve risks and uncertainties that could cause actual results to differ materially from those set forth in or implied by the Projections.
During the current quarter, Constellation may reiterate the Projections. Prior to the start of the company’s quiet period, which will begin at the close of business on November 30, 2023, the public can continue to rely on the Projections as still being Constellation’s current expectations on the matters covered, unless the company publishes a notice stating otherwise. During Constellation’s quiet period, the Projections should not be considered to constitute the company’s expectations and should be considered historical, speaking as of prior to the quiet period only and not subject to update by the company.
The Projections (i) are based on management’s current expectations and, unless otherwise noted, do not take into account the impact of any future acquisition, investment, merger, or other business combination, divestiture (including any associated amount of incremental contingent consideration payment paid or received), restructuring or other strategic business realignment, or financing or share repurchase that may be completed after the issuance of this release; and (ii) should not be construed in any manner as a guarantee that such results will in fact occur.
In addition to the risks and uncertainties of ordinary business operations, the Projections contained in this release are subject to risk, uncertainty, and possible variance from management's expectations regarding:
•water, agricultural and other raw material, and packaging material supply, production, and/or shipment difficulties which could adversely affect our ability to supply our customers;
•inflationary pressures, including reductions in consumer discretionary income and our ability to pass along rising costs to consumers through increased selling prices;
•actual impact to supply, production levels, and costs from global supply chain disruptions and constraints, transportation challenges, shifting consumer behaviors, wildfires, and severe weather events, due to, among other reasons, actual supply chain and transportation performance, consumer behaviors, and the severity and geographical reach of wildfires and severe weather events;
•reliance on complex information systems and third-party global networks;
•actual balance of supply and demand for our products and performance of our distributors;
•actual demand, net sales, channel proportions, and volume trends for our products;
•beer operations expansion, optimization, and/or construction activities, scope, capacity, costs (including impairments), capital expenditures, and timing due to, among other reasons, market conditions, our cash and debt position, receipt of required regulatory approvals in accordance with expected dates and terms, and other factors determined by management;
•contamination and degradation of product quality from diseases, pests, weather, and other conditions;
•communicable disease outbreaks, pandemics, or other widespread public health crises, such as the COVID-19 pandemic, and associated governmental containment actions;
•impact of the military conflict in Ukraine and associated internal destabilization in Russia, geopolitical tensions, and responses, including on inflation, supply chains, commodities, energy, and cybersecurity;
•amount, timing, and source of funds for any share repurchases, exact duration of share repurchase programs, and number of shares outstanding;
•amount and timing of future dividends which are subject to the determination and discretion of our Board of Directors and may be
impacted if our ability to use cash flow to fund dividends is affected by unanticipated increases in total net debt, we are unable to generate cash flow at anticipated levels, or we fail to generate expected earnings;
•accuracy of Projections relating to the Canopy investment, including Canopy's plan to create an exchangeable share structure, conversion of our securities, and related matters;
•timeframe and amount of any potential future impairment of our Canopy investment;
•expected impacts of wine and spirits portfolio refinement activities;
•accuracy of supply projections, including for beer operations expansion, optimization, and construction activities, wine and spirits operating activities, inventory levels, and glass sourcing;
•operating cash flow, free cash flow, effective tax rate, and capital expenditures to support long-term growth;
•accuracy of projections associated with market opportunities, new products, and acquisitions, investments, and divestitures;
•general economic, geopolitical, domestic, international, and regulatory conditions, world financial market and banking sector instability, including economic slowdown or recession, a potential U.S. federal government shutdown, litigation risks, unanticipated environmental liabilities and costs, or enhanced competitive activities;
•changes to international trade agreements, tariffs, accounting standards, elections, assertions, or policies, tax laws, or other governmental regulations, and other factors which could impact our reported financial position, results of operations, effective tax rate, or accuracy of any associated Projections;
•changes in interest rates and the inherent unpredictability of currency fluctuations, commodity prices, and raw materials;
•long-term impacts of the Reclassification (as defined below); and
•other factors and uncertainties disclosed in our filings with the SEC, including our Annual Report on Form 10-K for the fiscal year ended February 28, 2023, and our Quarterly Report on Form 10-Q for the fiscal quarter ended May 31, 2023, which could cause actual future performance to differ from our current expectations.
Constellation Brands, Inc. Q2 FY 2024 Earnings Release |
#WORTHREACHINGFOR I 5
|
||||
CONSTELLATION BRANDS, INC. AND SUBSIDIARIES
CONDENSED CONSOLIDATED BALANCE SHEETS
(in millions)
(unaudited)
| August 31, 2023 |
February 28, 2023 |
||||||||||
| ASSETS | |||||||||||
| Current assets: | |||||||||||
| Cash and cash equivalents | $ | 83.3 | $ | 133.5 | |||||||
| Accounts receivable | 933.2 | 901.6 | |||||||||
| Inventories | 1,814.0 | 1,898.7 | |||||||||
| Prepaid expenses and other | 603.8 | 562.3 | |||||||||
| Total current assets | 3,434.3 | 3,496.1 | |||||||||
| Property, plant, and equipment | 7,580.3 | 6,865.2 | |||||||||
| Goodwill | 7,985.6 | 7,925.4 | |||||||||
| Intangible assets | 2,734.5 | 2,728.1 | |||||||||
| Equity method investments | 277.1 | 663.3 | |||||||||
| Deferred income taxes | 2,147.6 | 2,193.3 | |||||||||
| Other assets | 770.6 | 790.9 | |||||||||
| Total assets | $ | 24,930.0 | $ | 24,662.3 | |||||||
| LIABILITIES AND STOCKHOLDER’S EQUITY | |||||||||||
| Current liabilities: | |||||||||||
| Short-term borrowings | $ | 467.4 | $ | 1,165.3 | |||||||
| Current maturities of long-term debt | 558.3 | 9.5 | |||||||||
| Accounts payable | 978.8 | 941.5 | |||||||||
| Other accrued expenses and liabilities | 853.0 | 852.0 | |||||||||
| Total current liabilities | 2,857.5 | 2,968.3 | |||||||||
| Long-term debt, less current maturities | 10,680.8 | 11,286.5 | |||||||||
| Deferred income taxes and other liabilities | 1,667.7 | 1,673.6 | |||||||||
| Total liabilities | 15,206.0 | 15,928.4 | |||||||||
| CBI stockholders’ equity | 9,390.8 | 8,413.6 | |||||||||
| Noncontrolling interests | 333.2 | 320.3 | |||||||||
| Total stockholders’ equity | 9,724.0 | 8,733.9 | |||||||||
| Total liabilities and stockholders’ equity | $ | 24,930.0 | $ | 24,662.3 | |||||||
Constellation Brands, Inc. Q2 FY 2024 Earnings Release |
#WORTHREACHINGFOR I 6
|
||||
CONSTELLATION BRANDS, INC. AND SUBSIDIARIES
CONSOLIDATED STATEMENTS OF OPERATIONS
(in millions, except per share data)
(unaudited)
| Three Months Ended | Six Months Ended | ||||||||||||||||||||||
| August 31, 2023 |
August 31, 2022 |
August 31, 2023 |
August 31, 2022 |
||||||||||||||||||||
| Sales | $ | 3,053.0 | $ | 2,864.3 | $ | 5,752.5 | $ | 5,405.0 | |||||||||||||||
| Excise taxes | (216.2) | (209.2) | (400.8) | (386.7) | |||||||||||||||||||
| Net sales | 2,836.8 | 2,655.1 | 5,351.7 | 5,018.3 | |||||||||||||||||||
| Cost of product sold | (1,386.9) | (1,329.2) | (2,644.0) | (2,437.4) | |||||||||||||||||||
| Gross profit | 1,449.9 | 1,325.9 | 2,707.7 | 2,580.9 | |||||||||||||||||||
| Selling, general, and administrative expenses | (471.2) | (512.8) | (964.3) | (951.4) | |||||||||||||||||||
| Operating income (loss) | 978.7 | 813.1 | 1,743.4 | 1,629.5 | |||||||||||||||||||
| Income (loss) from unconsolidated investments | (20.2) | (1,719.1) | (435.6) | (1,907.0) | |||||||||||||||||||
| Interest expense | (110.6) | (94.3) | (228.8) | (182.8) | |||||||||||||||||||
| Loss on extinguishment of debt | — | (8.0) | (0.7) | (23.3) | |||||||||||||||||||
| Income (loss) before income taxes | 847.9 | (1,008.3) | 1,078.3 | (483.6) | |||||||||||||||||||
| (Provision for) benefit from income taxes | (147.2) | (132.4) | (238.4) | (257.8) | |||||||||||||||||||
| Net income (loss) | 700.7 | (1,140.7) | 839.9 | (741.4) | |||||||||||||||||||
| Net (income) loss attributable to noncontrolling interests | (10.7) | (10.5) | (14.0) | (20.3) | |||||||||||||||||||
| Net income (loss) attributable to CBI | $ | 690.0 | $ | (1,151.2) | $ | 825.9 | $ | (761.7) | |||||||||||||||
| Net income (loss) per common share attributable to CBI: | |||||||||||||||||||||||
| Basic – Class A Common Stock | $ | 3.76 | $ | (6.30) | $ | 4.50 | $ | (4.13) | |||||||||||||||
| Basic – Class B Convertible Common Stock | NA | $ | (5.73) | NA | $ | (3.77) | |||||||||||||||||
| Diluted – Class A Common Stock | $ | 3.74 | $ | (6.30) | $ | 4.49 | $ | (4.13) | |||||||||||||||
| Diluted – Class B Convertible Common Stock | NA | $ | (5.73) | NA | $ | (3.77) | |||||||||||||||||
| Weighted average common shares outstanding: | |||||||||||||||||||||||
| Basic – Class A Common Stock | 183.498 | 161.730 | 183.384 | 163.532 | |||||||||||||||||||
| Basic – Class B Convertible Common Stock | NA | 23.206 | NA | 23.206 | |||||||||||||||||||
| Diluted – Class A Common Stock | 184.277 | 161.730 | 184.074 | 163.532 | |||||||||||||||||||
| Diluted – Class B Convertible Common Stock | NA | 23.206 | NA | 23.206 | |||||||||||||||||||
| Cash dividends declared per common share: | |||||||||||||||||||||||
| Class A Common Stock | $ | 0.89 | $ | 0.80 | $ | 1.78 | $ | 1.60 | |||||||||||||||
| Class B Convertible Common Stock | NA | $ | 0.72 | NA | $ | 1.44 | |||||||||||||||||
Constellation Brands, Inc. Q2 FY 2024 Earnings Release |
#WORTHREACHINGFOR I 7
|
||||
|
CONSTELLATION BRANDS, INC. AND SUBSIDIARIES
CONSOLIDATED STATEMENTS OF CASH FLOWS
(in millions)
(unaudited)
| |||||||||||
| Six Months Ended | |||||||||||
| August 31, 2023 |
August 31, 2022 |
||||||||||
| CASH FLOWS FROM OPERATING ACTIVITIES | |||||||||||
| Net income (loss) | $ | 839.9 | $ | (741.4) | |||||||
| Adjustments to reconcile net income (loss) to net cash provided by (used in) operating activities: | |||||||||||
| Unrealized net (gain) loss on securities measured at fair value | 74.4 | 31.7 | |||||||||
| Deferred tax provision (benefit) | 26.3 | 208.6 | |||||||||
| Depreciation | 213.7 | 183.5 | |||||||||
| Stock-based compensation | 32.5 | 37.8 | |||||||||
| Equity in (earnings) losses of equity method investees and related activities, net of distributed earnings | 226.5 | 815.6 | |||||||||
| Noncash lease expense | 43.3 | 44.4 | |||||||||
| Amortization of debt issuance costs and loss on extinguishment of debt | 6.1 | 28.2 | |||||||||
Impairment of equity method investments |
135.8 | 1,060.3 | |||||||||
| Gain (loss) on settlement of pre-issuance hedge contracts | 1.2 | 20.7 | |||||||||
| Change in operating assets and liabilities, net of effects from purchase and sale of business: | |||||||||||
| Accounts receivable | (30.0) | (84.8) | |||||||||
| Inventories | 81.3 | (86.3) | |||||||||
| Prepaid expenses and other current assets | (47.9) | 165.6 | |||||||||
| Accounts payable | (56.4) | 188.9 | |||||||||
| Deferred revenue | 17.6 | 9.5 | |||||||||
| Other accrued expenses and liabilities | (33.9) | (287.7) | |||||||||
| Other | 91.6 | 59.7 | |||||||||
| Total adjustments | 782.1 | 2,395.7 | |||||||||
| Net cash provided by (used in) operating activities | 1,622.0 | 1,654.3 | |||||||||
| CASH FLOWS FROM INVESTING ACTIVITIES | |||||||||||
| Purchase of property, plant, and equipment | (582.0) | (435.0) | |||||||||
| Purchase of business, net of cash acquired | (7.5) | (37.2) | |||||||||
| Investments in equity method investees and securities | (27.6) | (21.0) | |||||||||
| Proceeds from sale of assets | 14.8 | 6.6 | |||||||||
| Proceeds from sale of business | 5.4 | — | |||||||||
| Other investing activities | (4.0) | 0.6 | |||||||||
| Net cash provided by (used in) investing activities | (600.9) | (486.0) | |||||||||
Constellation Brands, Inc. Q2 FY 2024 Earnings Release |
#WORTHREACHINGFOR I 8
|
||||
|
CONSTELLATION BRANDS, INC. AND SUBSIDIARIES
CONSOLIDATED STATEMENTS OF CASH FLOWS
(in millions)
(unaudited)
| |||||||||||
| Six Months Ended | |||||||||||
| August 31, 2023 |
August 31, 2022 |
||||||||||
| CASH FLOWS FROM FINANCING ACTIVITIES | |||||||||||
| Proceeds from issuance of long-term debt | 744.8 | 1,846.8 | |||||||||
| Principal payments of long-term debt | (805.1) | (1,654.7) | |||||||||
| Net proceeds from (repayments of) short-term borrowings | (697.9) | 340.9 | |||||||||
| Dividends paid | (327.6) | (295.3) | |||||||||
| Purchases of treasury stock | (35.0) | (1,400.5) | |||||||||
| Proceeds from shares issued under equity compensation plans | 86.2 | 30.5 | |||||||||
| Payments of minimum tax withholdings on stock-based payment awards | (11.2) | (10.5) | |||||||||
| Payments of debt issuance, debt extinguishment, and other financing costs | (5.3) | (33.3) | |||||||||
| Distributions to noncontrolling interests | (21.3) | (22.5) | |||||||||
| Net cash provided by (used in) financing activities | (1,072.4) | (1,198.6) | |||||||||
| Effect of exchange rate changes on cash and cash equivalents | 1.1 | (4.0) | |||||||||
| Net increase (decrease) in cash and cash equivalents | (50.2) | (34.3) | |||||||||
| Cash and cash equivalents, beginning of period | 133.5 | 199.4 | |||||||||
| Cash and cash equivalents, end of period | $ | 83.3 | $ | 165.1 | |||||||
Constellation Brands, Inc. Q2 FY 2024 Earnings Release |
#WORTHREACHINGFOR I 9
|
||||
CONSTELLATION BRANDS, INC. AND SUBSIDIARIES
RECONCILIATION OF REPORTED AND ORGANIC NET SALES
(in millions)
(unaudited)
For periods of acquisition, we define organic net sales as current period reported net sales less net sales of products of acquired businesses reported for the current period, as appropriate. For periods of divestiture, we define organic net sales as prior period reported net sales less net sales of products of divested businesses reported for the prior period, as appropriate. We provide organic net sales because we use this information in monitoring and evaluating the underlying business trends of our core operations. Wine and Spirits net sales are provided by channel and market categories as management uses this information to monitor this business. In addition, we believe this information provides investors, financial analysts covering the Company, rating agencies, and other external users (“our investors”) valuable insight on underlying business trends and results and, in the case of Wine and Spirits, the underlying composition of segment net sales and results, in order to evaluate year-over-year financial performance.
The divestiture impacting the periods below consists of the sale of certain mainstream and premium wine brands and related inventory (the "Wine Divestiture") (sold October 6, 2022).
| Three Months Ended | Six Months Ended | ||||||||||||||||||||||||||||||||||
| August 31, 2023 |
August 31, 2022 |
Percent Change |
August 31, 2023 |
August 31, 2022 |
Percent Change |
||||||||||||||||||||||||||||||
| Consolidated net sales | $ | 2,836.8 | $ | 2,655.1 | 7 | % | $ | 5,351.7 | $ | 5,018.3 | 7 | % | |||||||||||||||||||||||
Wine Divestiture (1)
|
— | (14.4) | — | (34.8) | |||||||||||||||||||||||||||||||
| Consolidated organic net sales | $ | 2,836.8 | $ | 2,640.7 | 7 | % | $ | 5,351.7 | $ | 4,983.5 | 7 | % | |||||||||||||||||||||||
| Beer net sales | $ | 2,392.7 | $ | 2,139.3 | 12 | % | $ | 4,491.3 | $ | 4,037.5 | 11 | % | |||||||||||||||||||||||
Wine and Spirits net sales (2)
|
$ | 444.1 | $ | 515.8 | (14 | %) | $ | 860.4 | $ | 980.8 | (12 | %) | |||||||||||||||||||||||
Wine Divestiture (1)
|
— | (14.4) | — | (34.8) | |||||||||||||||||||||||||||||||
| Wine and Spirits organic net sales | $ | 444.1 | $ | 501.4 | (11 | %) | $ | 860.4 | $ | 946.0 | (9 | %) | |||||||||||||||||||||||
(1)For the periods June 1, 2022, through August 31, 2022, and March 1, 2022, through August 31, 2022, included in the three months and six months ended August 31, 2022, respectively.
(2)Wine and Spirits net sales by channel and market categories are as follows:
| Three Months Ended | Six Months Ended | ||||||||||||||||||||||||||||||||||
| August 31, 2023 | August 31, 2022 | Percent Change |
August 31, 2023 | August 31, 2022 | Percent Change |
||||||||||||||||||||||||||||||
U.S. Wholesale (i)
|
$ | 370.3 | $ | 422.0 | (12 | %) | $ | 714.5 | $ | 797.3 | (10 | %) | |||||||||||||||||||||||
International (i)
|
45.9 | 56.3 | (18 | %) | 90.3 | 112.3 | (20 | %) | |||||||||||||||||||||||||||
| DTC | 11.5 | 12.4 | (7 | %) | 28.7 | 27.6 | 4 | % | |||||||||||||||||||||||||||
| Other | 16.4 | 25.1 | (35 | %) | 26.9 | 43.6 | (38 | %) | |||||||||||||||||||||||||||
| Wine and Spirits net sales | $ | 444.1 | $ | 515.8 | (14 | %) | $ | 860.4 | $ | 980.8 | (12 | %) | |||||||||||||||||||||||
(i)Includes the impacts of the Wine Divestiture.
| |||||||||||||||||||||||||||||||||||
Constellation Brands, Inc. Q2 FY 2024 Earnings Release |
#WORTHREACHINGFOR I 10
|
||||
CONSTELLATION BRANDS, INC. AND SUBSIDIARIES
SUPPLEMENTAL SHIPMENT AND DEPLETION INFORMATION
(in millions)
(unaudited)
| Three Months Ended | Six Months Ended | ||||||||||||||||||||||||||||||||||
| August 31, 2023 |
August 31, 2022 |
Percent Change |
August 31, 2023 |
August 31, 2022 |
Percent Change |
||||||||||||||||||||||||||||||
| Beer | |||||||||||||||||||||||||||||||||||
| (branded product, 24-pack, 12-ounce case equivalents) | |||||||||||||||||||||||||||||||||||
| Shipments | 123.0 | 113.2 | 8.7 | % | 230.0 | 212.7 | 8.1 | % | |||||||||||||||||||||||||||
Depletions (1)
|
7.9 | % | 6.8 | % | |||||||||||||||||||||||||||||||
| Wine and Spirits | |||||||||||||||||||||||||||||||||||
| (branded product, 9-liter case equivalents) | |||||||||||||||||||||||||||||||||||
| Shipments | 6.1 | 7.4 | (17.6 | %) | 12.0 | 14.2 | (15.5 | %) | |||||||||||||||||||||||||||
Organic shipments (2)
|
6.1 | 7.2 | (15.3 | %) | 12.0 | 13.7 | (12.4 | %) | |||||||||||||||||||||||||||
| U.S. Domestic shipments | 5.4 | 6.4 | (15.6 | %) | 10.6 | 12.2 | (13.1 | %) | |||||||||||||||||||||||||||
U.S. Domestic organic shipments (2)
|
5.4 | 6.3 | (14.3 | %) | 10.6 | 11.9 | (10.9 | %) | |||||||||||||||||||||||||||
Depletions (1) (2)
|
(7.8 | %) | (7.0 | %) | |||||||||||||||||||||||||||||||
(1) |
Depletions represent U.S. domestic distributor shipments of our respective branded products to retail customers, based on third-party data. | ||||||||||||||||||||||
(2) |
Includes adjustments to remove volumes associated with the Wine Divestiture for the periods June 1, 2022, through August 31, 2022, and March 1, 2022, through August 31, 2022, included in the three months and six months ended August 31, 2022, respectively. |
||||||||||||||||||||||
Constellation Brands, Inc. Q2 FY 2024 Earnings Release |
#WORTHREACHINGFOR I 11
|
||||
CONSTELLATION BRANDS, INC. AND SUBSIDIARIES
SUMMARIZED SEGMENT INFORMATION
(in millions)
(unaudited)
Management excludes items that affect comparability from its evaluation of the results of each operating segment as these comparable adjustments are not reflective of core operations of the segments. Segment operating performance and the incentive compensation of segment management are evaluated based on core segment operating income (loss) which does not include the impact of these comparable adjustments.
| Three Months Ended | Six Months Ended | ||||||||||||||||||||||||||||||||||
| August 31, 2023 |
August 31, 2022 |
Percent Change |
August 31, 2023 |
August 31, 2022 |
Percent Change |
||||||||||||||||||||||||||||||
| Consolidated | |||||||||||||||||||||||||||||||||||
| Net sales | $ | 2,836.8 | $ | 2,655.1 | 7 | % | $ | 5,351.7 | $ | 5,018.3 | 7 | % | |||||||||||||||||||||||
| Gross profit | $ | 1,449.9 | $ | 1,325.9 | 9 | % | $ | 2,707.7 | $ | 2,580.9 | 5 | % | |||||||||||||||||||||||
| Operating income (loss) | $ | 978.7 | $ | 813.1 | 20 | % | $ | 1,743.4 | $ | 1,629.5 | 7 | % | |||||||||||||||||||||||
Comparable adjustments (1)
|
|||||||||||||||||||||||||||||||||||
| Gross profit | $ | 23.9 | $ | (46.4) | NM | $ | (10.9) | $ | (22.0) | NM | |||||||||||||||||||||||||
| Operating income (loss) | $ | 10.9 | $ | (69.6) | NM | $ | (51.6) | $ | (45.7) | NM | |||||||||||||||||||||||||
| Beer | |||||||||||||||||||||||||||||||||||
| Net sales | $ | 2,392.7 | $ | 2,139.3 | 12 | % | $ | 4,491.3 | $ | 4,037.5 | 11 | % | |||||||||||||||||||||||
| Segment gross profit | $ | 1,228.7 | $ | 1,147.6 | 7 | % | $ | 2,327.4 | $ | 2,167.1 | 7 | % | |||||||||||||||||||||||
| % Net sales | 51.4 | % | 53.6 | % | 51.8 | % | 53.7 | % | |||||||||||||||||||||||||||
| Segment operating income (loss) | $ | 953.9 | $ | 865.6 | 10 | % | $ | 1,751.7 | $ | 1,628.4 | 8 | % | |||||||||||||||||||||||
| % Net sales | 39.9 | % | 40.5 | % | 39.0 | % | 40.3 | % | |||||||||||||||||||||||||||
| Wine and Spirits | |||||||||||||||||||||||||||||||||||
| Wine net sales | $ | 383.9 | $ | 442.0 | (13 | %) | $ | 744.9 | $ | 846.1 | (12 | %) | |||||||||||||||||||||||
| Spirits net sales | 60.2 | 73.8 | (18 | %) | 115.5 | 134.7 | (14 | %) | |||||||||||||||||||||||||||
| Net sales | $ | 444.1 | $ | 515.8 | (14 | %) | $ | 860.4 | $ | 980.8 | (12 | %) | |||||||||||||||||||||||
| Segment gross profit | $ | 197.3 | $ | 224.7 | (12 | %) | $ | 391.2 | $ | 435.8 | (10 | %) | |||||||||||||||||||||||
| % Net sales | 44.4 | % | 43.6 | % | 45.5 | % | 44.4 | % | |||||||||||||||||||||||||||
| Segment operating income (loss) | $ | 80.7 | $ | 99.4 | (19 | %) | $ | 160.0 | $ | 190.4 | (16 | %) | |||||||||||||||||||||||
| % Net sales | 18.2 | % | 19.3 | % | 18.6 | % | 19.4 | % | |||||||||||||||||||||||||||
| Corporate Operations and Other | |||||||||||||||||||||||||||||||||||
| Segment operating income (loss) | $ | (66.8) | $ | (82.3) | 19 | % | $ | (116.7) | $ | (143.6) | 19 | % | |||||||||||||||||||||||
(1)See page 14 for further information on comparable adjustments.
Constellation Brands, Inc. Q2 FY 2024 Earnings Release |
#WORTHREACHINGFOR I 12
|
||||
CONSTELLATION BRANDS, INC. AND SUBSIDIARIES
RECONCILIATIONS OF GAAP TO NON-GAAP FINANCIAL MEASURES
(in millions, except per share data)
(unaudited)
We report our financial results in accordance with GAAP. However, non-GAAP financial measures, as defined in the reconciliation tables below, are provided because we use this information in evaluating the results of our core operations and/or internal goal setting. In addition, we believe this information provides our investors valuable insight on underlying business trends and results in order to evaluate year-over-year financial performance. See the tables below for supplemental financial data and corresponding reconciliations of these non-GAAP financial measures to GAAP financial measures for the periods presented. Non-GAAP financial measures should be considered in addition to, not as a substitute for, or superior to, our reported results prepared in accordance with GAAP.
| Three Months Ended | Six Months Ended | ||||||||||||||||||||||||||||||||||
| August 31, 2023 |
August 31, 2022 |
Percent Change |
August 31, 2023 |
August 31, 2022 |
Percent Change |
||||||||||||||||||||||||||||||
| Operating income (loss) (GAAP) | $ | 978.7 | $ | 813.1 | 20 | % | $ | 1,743.4 | $ | 1,629.5 | 7 | % | |||||||||||||||||||||||
Less: Comparable adjustments (Non-GAAP) (1)
|
10.9 | (69.6) | (51.6) | (45.7) | |||||||||||||||||||||||||||||||
| Comparable operating income (loss) (Non-GAAP) | $ | 967.8 | $ | 882.7 | 10 | % | $ | 1,795.0 | $ | 1,675.2 | 7 | % | |||||||||||||||||||||||
| Net income (loss) attributable to CBI (GAAP) | $ | 690.0 | $ | (1,151.2) | NM | $ | 825.9 | $ | (761.7) | NM | |||||||||||||||||||||||||
|
Plus: Net income (loss) attributable to
noncontrolling interests (GAAP)
|
10.7 | 10.5 | 14.0 | 20.3 | |||||||||||||||||||||||||||||||
| Provision for (benefit from) income taxes (GAAP) | 147.2 | 132.4 | 238.4 | 257.8 | |||||||||||||||||||||||||||||||
| Loss on extinguishment of debt (GAAP) | — | 8.0 | 0.7 | 23.3 | |||||||||||||||||||||||||||||||
| Interest expense (GAAP) | 110.6 | 94.3 | 228.8 | 182.8 | |||||||||||||||||||||||||||||||
| Adjusted EBIT (Non-GAAP) | 958.5 | (906.0) | NM | 1,307.8 | (277.5) | NM | |||||||||||||||||||||||||||||
Less: Comparable adjustments (Non-GAAP) (1)
|
3.5 | (1,755.1) | (443.4) | (1,866.6) | |||||||||||||||||||||||||||||||
| Comparable EBIT (Non-GAAP) | $ | 955.0 | $ | 849.1 | 12 | % | $ | 1,751.2 | $ | 1,589.1 | 10 | % | |||||||||||||||||||||||
| Net income (loss) attributable to CBI (GAAP) | $ | 690.0 | $ | (1,151.2) | NM | $ | 825.9 | $ | (761.7) | NM | |||||||||||||||||||||||||
Less: Comparable adjustments (Non-GAAP) (1)
|
8.2 | (1,739.9) | (390.4) | (1,854.2) | |||||||||||||||||||||||||||||||
| Comparable net income (loss) attributable to CBI (Non-GAAP) | $ | 681.8 | $ | 588.7 | 16 | % | $ | 1,216.3 | $ | 1,092.5 | 11 | % | |||||||||||||||||||||||
| EPS (GAAP) | $ | 3.74 | $ | (6.30) | NM | $ | 4.49 | $ | (4.13) | NM | |||||||||||||||||||||||||
Less: Comparable adjustments (Non-GAAP) (1)
|
0.04 | (9.37) | (2.12) | (9.89) | |||||||||||||||||||||||||||||||
Comparable EPS (Non-GAAP) (2)
|
$ | 3.70 | $ | 3.17 | 17 | % | $ | 6.61 | $ | 5.83 | 13 | % | |||||||||||||||||||||||
Weighted average common shares outstanding - diluted (2)
|
184.277 | 185.737 | 184.074 | 187.540 | |||||||||||||||||||||||||||||||
(1)See page 14 for further information on comparable adjustments.
(2)Comparable basis diluted net income (loss) per share (“comparable EPS”) may not sum due to rounding as each item is computed independently. The comparable adjustments and comparable EPS are calculated on a fully dilutive basis. For the three months and six months ended August 31, 2022, we have excluded 24.007 million and 24.008 million weighted average common shares outstanding, respectively, from the calculation of comparable EPS, as the effect of including these would have been anti-dilutive.
Constellation Brands, Inc. Q2 FY 2024 Earnings Release |
#WORTHREACHINGFOR I 13
|
||||
CONSTELLATION BRANDS, INC. AND SUBSIDIARIES
RECONCILIATIONS OF GAAP TO NON-GAAP FINANCIAL MEASURES (continued)
(in millions, except per share data)
(unaudited)
The comparable adjustments that impacted comparability in our results for each period are as follows:
| Three Months Ended | Six Months Ended | ||||||||||||||||||||||
| August 31, 2023 |
August 31, 2022 |
August 31, 2023 |
August 31, 2022 |
||||||||||||||||||||
| Net gain (loss) on undesignated commodity derivative contracts | $ | 19.1 | $ | (15.4) | $ | (15.6) | $ | 33.1 | |||||||||||||||
| Settlements of undesignated commodity derivative contracts | 5.6 | (31.3) | 6.2 | (54.6) | |||||||||||||||||||
| Flow through of inventory step-up | (0.8) | (0.9) | (1.5) | (1.9) | |||||||||||||||||||
Net flow through of reserved inventory
|
— | 1.2 | — | 1.2 | |||||||||||||||||||
| Recovery of (loss on) inventory write-down | — | — | — | 0.2 | |||||||||||||||||||
| Comparable adjustments, Gross profit | 23.9 | (46.4) | (10.9) | (22.0) | |||||||||||||||||||
| Transition services agreements activity | (7.0) | (4.5) | (12.7) | (7.9) | |||||||||||||||||||
| Restructuring and other strategic business development costs | (3.4) | (1.2) | (18.3) | (2.6) | |||||||||||||||||||
| Transaction, integration, and other acquisition-related costs | (0.3) | (0.5) | (0.6) | (0.7) | |||||||||||||||||||
| Costs associated with the Reclassification | — | (20.6) | 0.2 | (21.3) | |||||||||||||||||||
| Other gains (losses) | (2.3) | 3.6 | (9.3) | 8.8 | |||||||||||||||||||
| Comparable adjustments, Operating income (loss) | 10.9 | (69.6) | (51.6) | (45.7) | |||||||||||||||||||
| Comparable adjustments, Income (loss) from unconsolidated investments | (7.4) | (1,685.5) | (391.8) | (1,820.9) | |||||||||||||||||||
| Comparable adjustments, Adjusted EBIT | 3.5 | (1,755.1) | (443.4) | (1,866.6) | |||||||||||||||||||
| Comparable adjustments, Loss on extinguishment of debt | — | (8.0) | (0.7) | (23.3) | |||||||||||||||||||
| Comparable adjustments, (Provision for) benefit from income taxes | 4.7 | 23.2 | 53.7 | 35.7 | |||||||||||||||||||
| Comparable adjustments, Net income (loss) attributable to CBI | $ | 8.2 | $ | (1,739.9) | $ | (390.4) | $ | (1,854.2) | |||||||||||||||
Undesignated commodity derivative contracts
Net gain (loss) on undesignated commodity derivative contracts represents a net gain (loss) from the changes in fair value of undesignated commodity derivative contracts. The net gain (loss) is reported outside of segment operating results until such time that the underlying exposure is recognized in the segment operating results. At settlement, the net gain (loss) from the changes in fair value of the undesignated commodity derivative contracts is reported in the appropriate operating segment, allowing the results of our operating segments to reflect the economic effects of the commodity derivative contracts without the resulting unrealized mark to fair value volatility.
Flow through of inventory step-up
In connection with acquisitions, the allocation of purchase price in excess of book value for certain inventories on hand at the date of acquisition is referred to as inventory step-up. Inventory step-up represents an assumed manufacturing profit attributable to the acquired business prior to acquisition.
Net flow through of reserved inventory
We sold reserved inventory previously written down following the 2020 U.S. West Coast wildfires.
Recovery of (loss on) inventory write-down
We recognized a gain from a change in estimate on reserved bulk wine inventory and certain grapes as a result of smoke damage sustained during the 2020 U.S. West Coast wildfires.
Transition services agreements activity
We recognized costs in connection with transition services agreements related to the previous sale of a portion of our wine and spirits business.
Restructuring and other strategic business development costs
We recognized costs in connection with certain activities which are intended to streamline, increase efficiencies, and reduce our cost structure primarily within the Wine and Spirits segment.
Constellation Brands, Inc. Q2 FY 2024 Earnings Release |
#WORTHREACHINGFOR I 14
|
||||
CONSTELLATION BRANDS, INC. AND SUBSIDIARIES
RECONCILIATIONS OF GAAP TO NON-GAAP FINANCIAL MEASURES (continued)
(in millions, except per share data)
(unaudited)
Transaction, integration, and other acquisition-related costs
We recognized transaction, integration, and other acquisition-related costs in connection with our investments, acquisitions, and divestitures.
Costs associated with the Reclassification
We recognized costs primarily related to professional and consulting fees and all filing and other fees paid to the Securities and Exchange Commission in connection with the reclassification, conversion, and exchange of our Class B Convertible Common Stock into our Class A Common Stock (the "Reclassification").
Other gains (losses)
Primarily includes the following:
| Three Months Ended | Six Months Ended | ||||||||||||||||||||||
| August 31, 2023 |
August 31, 2022 |
August 31, 2023 |
August 31, 2022 |
||||||||||||||||||||
| Gain (loss) on sale of business | $ | (7.9) | $ | — | $ | (14.9) | $ | — | |||||||||||||||
Recognition of a previously deferred gain upon release of a related indemnity |
$ | 5.6 | $ | — | $ | 5.6 | $ | — | |||||||||||||||
| Decrease (increase) in estimated fair values of contingent liabilities associated with prior period acquisitions | $ | — | $ | 4.4 | $ | — | $ | 4.4 | |||||||||||||||
| Gain from remeasurement of previously held equity method investments | $ | — | $ | — | $ | — | $ | 5.2 | |||||||||||||||
Comparable adjustments, Income (loss) from unconsolidated investments
Primarily includes the following:
| Three Months Ended | Six Months Ended | ||||||||||||||||||||||
| August 31, 2023 |
August 31, 2022 |
August 31, 2023 |
August 31, 2022 |
||||||||||||||||||||
Impairment of equity method investments |
$ | (12.3) | $ | (1,060.3) | $ | (135.8) | $ | (1,060.3) | |||||||||||||||
Unrealized gain (loss) from the changes in fair value of our securities measured at fair value |
$ | (2.6) | $ | (9.3) | $ | (74.4) | $ | (31.7) | |||||||||||||||
Comparable adjustments to Canopy EIE (see page 16 for further information) |
$ | 7.5 | $ | (615.9) | $ | (181.5) | $ | (728.9) | |||||||||||||||
Comparable adjustments, Loss on extinguishment of debt
We recognized losses primarily from a premium payment and the write-off of debt issuance costs in connection with tender offers of certain senior notes and make-whole payments resulting from the early redemption of certain senior notes.
Comparable adjustments, (Provision for) benefit from income taxes
The effective tax rate applied to each comparable adjustment amount is generally based upon the jurisdiction in which the comparable adjustment was recognized. Comparable adjustments, (Provision for) benefit from income taxes also include items solely impacting income taxes and consist of the following:
| Three Months Ended | Six Months Ended | ||||||||||||||||||||||
| August 31, 2023 |
August 31, 2022 |
August 31, 2023 |
August 31, 2022 |
||||||||||||||||||||
| Net income tax benefit recognized as a result of a change in tax entity classification | $ | 2.3 | $ | — | $ | 31.2 | $ | — | |||||||||||||||
| Net income tax benefit recognized as a result of a legislative update in Switzerland | $ | — | $ | — | $ | 4.7 | $ | — | |||||||||||||||
| Net income tax benefit related to a prior period divestiture | $ | — | $ | 150.4 | $ | — | $ | 150.4 | |||||||||||||||
| Net income tax (provision) benefit recognized for adjustments to valuation allowances | $ | — | $ | (192.0) | $ | — | $ | (192.0) | |||||||||||||||
Constellation Brands, Inc. Q2 FY 2024 Earnings Release |
#WORTHREACHINGFOR I 15
|
||||
CONSTELLATION BRANDS, INC. AND SUBSIDIARIES
RECONCILIATIONS OF GAAP TO NON-GAAP FINANCIAL MEASURES (continued)
(in millions, except per share data)
(unaudited)
Canopy Equity Earnings (Losses) and Related Activities (“Canopy EIE”)
The measures that exclude all of our equity in the earnings (losses) of Canopy and related activities on a reported basis are defined as "excluding Canopy EIE." Financial measures excluding Canopy EIE are non-GAAP and are provided because management uses this information to monitor our investment in Canopy. In addition, we believe this information provides our investors valuable insight to understand how management views the Company’s performance and on underlying business trends and results in order to evaluate year-over-year financial performance of our ongoing core business, including relative to industry competitors.
| Three Months Ended | Six Months Ended | ||||||||||||||||||||||
| August 31, 2023 |
August 31, 2022 |
August 31, 2023 |
August 31, 2022 |
||||||||||||||||||||
| (in millions) | |||||||||||||||||||||||
Equity earnings (losses) and related activities, Canopy EIE (GAAP) (1)
|
$ | (12.0) | $ | (650.7) | $ | (231.8) | $ | (815.7) | |||||||||||||||
(Provision for) benefit from income taxes (2)
|
1.7 | 28.2 | 8.2 | 48.4 | |||||||||||||||||||
Net income (loss) attributable to CBI, Canopy EIE (GAAP) (1)
|
$ | (10.3) | $ | (622.5) | $ | (223.6) | $ | (767.3) | |||||||||||||||
Equity earnings (losses) and related activities, Canopy EIE (GAAP) (1)
|
$ | (12.0) | $ | (650.7) | $ | (231.8) | $ | (815.7) | |||||||||||||||
| Net (gain) loss on fair value financial instruments | (15.0) | 52.7 | (8.1) | 61.6 | |||||||||||||||||||
| (Gain) loss on dilution of Canopy stock ownership | 4.2 | 93.5 | 7.8 | 94.0 | |||||||||||||||||||
| Acquisition costs | 1.8 | 1.1 | 2.7 | 1.5 | |||||||||||||||||||
| Restructuring and other strategic business development costs | 0.4 | 1.8 | 161.0 | 102.7 | |||||||||||||||||||
| Goodwill impairment | — | 460.8 | 14.1 | 460.8 | |||||||||||||||||||
| Other (gains) losses, net | 1.1 | 6.0 | 4.0 | 8.3 | |||||||||||||||||||
| Comparable adjustments, Canopy EIE (Non-GAAP) | (7.5) | 615.9 | 181.5 | 728.9 | |||||||||||||||||||
Comparable equity earnings (losses), Canopy EIE (Non-GAAP) (1)
|
(19.5) | (34.8) | (50.3) | (86.8) | |||||||||||||||||||
Comparable (provision for) benefit from income taxes (Non-GAAP) (2)
|
1.7 | 4.5 | 8.2 | 11.7 | |||||||||||||||||||
Comparable net income (loss) attributable to CBI, Canopy EIE (Non-GAAP) (1)
|
$ | (17.8) | $ | (30.3) | $ | (42.1) | $ | (75.1) | |||||||||||||||
| Three Months Ended | Six Months Ended | ||||||||||||||||||||||
| August 31, 2023 |
August 31, 2022 |
August 31, 2023 |
August 31, 2022 |
||||||||||||||||||||
| EPS, Canopy EIE (GAAP) | $ | (0.06) | $ | (3.35) | $ | (1.21) | $ | (4.09) | |||||||||||||||
| Comparable adjustments, Canopy EIE (Non-GAAP) | (0.04) | 3.19 | 0.99 | 3.69 | |||||||||||||||||||
Comparable EPS, Canopy EIE (Non-GAAP) (3)
|
$ | (0.10) | $ | (0.16) | $ | (0.23) | $ | (0.40) | |||||||||||||||
Constellation Brands, Inc. Q2 FY 2024 Earnings Release |
#WORTHREACHINGFOR I 16
|
||||
CONSTELLATION BRANDS, INC. AND SUBSIDIARIES
RECONCILIATIONS OF GAAP TO NON-GAAP FINANCIAL MEASURES (continued)
(in millions, except per share data)
(unaudited)
Three Months Ended |
|||||||||||||||||||||||||||||||||||
| August 31, 2023 | August 31, 2022 | ||||||||||||||||||||||||||||||||||
| Income (loss) before income taxes |
(Provision for) benefit from income taxes (2)
|
Effective tax rate (4)
|
Income (loss) before income taxes |
(Provision for) benefit from income taxes (2)
|
Effective tax rate (4)
|
||||||||||||||||||||||||||||||
| Reported basis (GAAP) | $ | 847.9 | $ | (147.2) | 17.4 | % | $ | (1,008.3) | $ | (132.4) | (13.1) | % | |||||||||||||||||||||||
| Comparable adjustments - (Non-GAAP) | (3.5) | (4.7) | 1,763.1 | (23.2) | |||||||||||||||||||||||||||||||
| Comparable basis (Non-GAAP) | 844.4 | (151.9) | 18.0 | % | 754.8 | (155.6) | 20.6 | % | |||||||||||||||||||||||||||
| Less: Comparable basis, Canopy EIE (Non-GAAP) | (19.5) | 1.7 | (34.8) | 4.5 | |||||||||||||||||||||||||||||||
| Comparable basis, excluding Canopy EIE (Non-GAAP) | $ | 863.9 | $ | (153.6) | 17.8 | % | $ | 789.6 | $ | (160.1) | 20.3 | % | |||||||||||||||||||||||
| Three Months Ended | Six Months Ended | ||||||||||||||||||||||
| August 31, 2023 |
August 31, 2022 |
August 31, 2023 |
August 31, 2022 |
||||||||||||||||||||
Comparable EPS (Non-GAAP) (5)
|
$ | 3.70 | $ | 3.17 | $ | 6.61 | $ | 5.83 | |||||||||||||||
| Comparable EPS, Canopy EIE (Non-GAAP) | 0.10 | 0.16 | 0.23 | 0.40 | |||||||||||||||||||
Comparable EPS, excluding Canopy EIE (Non-GAAP) (3)
|
$ | 3.80 | $ | 3.33 | $ | 6.84 | $ | 6.23 | |||||||||||||||
(1)Equity earnings (losses) and related activities are included in income (loss) from unconsolidated investments.
(2)The benefit from income taxes effective tax rate applied to our Canopy EIE is generally based on the tax rates of the legal entities that hold our investment. The comparable adjustment effective tax rate applied to each comparable adjustment amount is generally based upon the jurisdiction in which the adjustment was recognized.
(3)May not sum due to rounding as each item is computed independently. The comparable adjustments and comparable EPS are calculated on a fully dilutive basis.
(4)Effective tax rate is not considered a GAAP financial measure, for purposes of this reconciliation, we derived the reported GAAP measure based on GAAP results, which serves as the basis for the reconciliation to the comparable non-GAAP financial measure.
(5)See reconciliation of the applicable non-GAAP financial measures on page 13.
| EPS Guidance | Range for the Year Ending February 29, 2024 | ||||||||||
| Forecasted EPS (GAAP) | $ | 9.60 | $ | 9.80 | |||||||
Comparable adjustments (Non-GAAP) (1)
|
2.17 | 2.17 | |||||||||
| Comparable basis, Canopy EIE (Non-GAAP) | 0.23 | 0.23 | |||||||||
Forecasted comparable EPS, excluding Canopy EIE (Non-GAAP) (2)
|
$ | 12.00 | $ | 12.20 | |||||||
Constellation Brands, Inc. Q2 FY 2024 Earnings Release |
#WORTHREACHINGFOR I 17
|
||||
CONSTELLATION BRANDS, INC. AND SUBSIDIARIES
RECONCILIATIONS OF GAAP TO NON-GAAP FINANCIAL MEASURES (continued)
(in millions, except per share data)
(unaudited)
| Actual for the Year Ended February 28, 2023 | |||||
EPS (GAAP) (3)
|
$ | (0.11) | |||
Reclassification (Non-GAAP) (4)
|
(0.27) | ||||
Comparable adjustments (Non-GAAP) (1)
|
11.03 | ||||
Comparable EPS (Non-GAAP) (2)
|
10.65 | ||||
| Comparable basis, Canopy EIE (Non-GAAP) | 0.75 | ||||
Comparable EPS, excluding Canopy EIE (Non-GAAP) (2)
|
$ | 11.40 | |||
(1) |
Comparable adjustments include: (2)(5)
|
Estimated for the Year Ending February 29, 2024 | Actual for the Year Ended February 28, 2023 | |||||||||||
| (Income) loss from unconsolidated investments | $ | 2.11 | $ | 9.92 | ||||||||||
| Transition services agreements activity | $ | 0.10 | $ | 0.08 | ||||||||||
| Restructuring and other strategic business development costs | $ | 0.08 | $ | 0.04 | ||||||||||
| Net (gain) loss on undesignated commodity derivative contracts | $ | 0.06 | $ | 0.06 | ||||||||||
| Net (gain) loss on sale of business | $ | 0.06 | $ | (0.05) | ||||||||||
| Flow through of inventory step-up | $ | 0.01 | $ | 0.02 | ||||||||||
| Net income tax benefit recognized as a result of a change in tax entity classification | $ | (0.17) | $ | — | ||||||||||
| Net income tax provision (benefit) recognized as a result of a legislative update in Switzerland | $ | (0.03) | $ | 0.06 | ||||||||||
| Settlements of undesignated commodity derivative contracts | $ | (0.03) | $ | 0.31 | ||||||||||
| Other (gains) losses | $ | (0.03) | $ | (0.11) | ||||||||||
| Net income tax provision recognized for adjustments to valuation allowances | $ | — | $ | 1.03 | ||||||||||
| Impairments of assets | $ | — | $ | 0.27 | ||||||||||
| Costs associated with the Reclassification | $ | — | $ | 0.20 | ||||||||||
| Loss on extinguishment of debt | $ | — | $ | 0.10 | ||||||||||
| Transaction, integration, and other acquisition-related costs | $ | — | $ | 0.01 | ||||||||||
| Net income tax benefit related to a prior period divestiture | $ | — | $ | (0.89) | ||||||||||
| Net flow through of reserved inventory | $ | — | $ | (0.01) | ||||||||||
(2) |
May not sum due to (i) rounding as each item is computed independently and (ii) income allocated through the date of the Reclassification for the year ended February 28, 2023. The comparable adjustments and comparable EPS are calculated on a fully dilutive basis. |
|||||||||||||
(3) |
EPS was computed using the two-class method, until such conversion took place pursuant to Reclassification. |
|||||||||||||
(4) |
Adjustment for income allocated through the date of the Reclassification. | |||||||||||||
(5) |
See page 14 for further information on comparable adjustments. |
|||||||||||||
Constellation Brands, Inc. Q2 FY 2024 Earnings Release |
#WORTHREACHINGFOR I 18
|
||||
CONSTELLATION BRANDS, INC. AND SUBSIDIARIES
RECONCILIATIONS OF GAAP TO NON-GAAP FINANCIAL MEASURES (continued)
(in millions, except per share data)
(unaudited)
|
Free Cash Flow Guidance
Free cash flow, as defined in the reconciliation below, is considered a liquidity measure and is considered to provide useful information to investors about the amount of cash generated, which can then be used, after required debt service and dividend payments, for other general corporate purposes. A limitation of free cash flow is that it does not represent the total increase or decrease in the cash balance for the period. Free cash flow should be considered in addition to, not as a substitute for, or superior to, cash flow from operating activities prepared in accordance with GAAP.
| |||||||||||
| Range for the Year Ending February 29, 2024 |
|||||||||||
| Net cash provided by operating activities (GAAP) | $ | 2,400.0 | $ | 2,600.0 | |||||||
| Purchase of property, plant, and equipment | (1,200.0) | (1,300.0) | |||||||||
| Free cash flow (Non-GAAP) | $ | 1,200.0 | $ | 1,300.0 | |||||||
| Six Months Ended | |||||||||||
| August 31, 2023 |
August 31, 2022 |
||||||||||
| Net cash provided by operating activities (GAAP) | $ | 1,622.0 | $ | 1,654.3 | |||||||
| Purchase of property, plant, and equipment | (582.0) | (435.0) | |||||||||
| Free cash flow (Non-GAAP) | $ | 1,040.0 | $ | 1,219.3 | |||||||
Constellation Brands, Inc. Q2 FY 2024 Earnings Release |
#WORTHREACHINGFOR I 19
|
||||