EX-99.1
Published on January 5, 2023
Exhibit 99.1

Constellation Delivers Strong Business Performance in Q3 Fiscal 2023
Beer Business Continues to Generate Industry-Leading Growth
Beer Business Fiscal 2023 Net Sales and Operating Income Growth Outlook Raised
| Net Sales |
Operating Income |
Net Income (Loss) Attributable to CBI |
Earnings Before Interest & Taxes (EBIT) |
Diluted Net Income (Loss) Per Share Attributable to CBI (EPS) |
Diluted EPS Excluding Canopy |
|||||||||||||||
Third Quarter Fiscal Year 2023 Financial Highlights (1) | In millions, except per share data
| ||||||||||||||||||||
| Reported | $2,437 | $747 | $468 | NA | $2.52 | NA | ||||||||||||||
| % Change | 5% | (11%) | (1%) | NA | 2% | NA | ||||||||||||||
| Comparable | $2,437 | $770 | $525 | $764 | $2.83 | $3.01 | ||||||||||||||
| % Change | 5% | (7%) | (11%) | (3%) | (9%) | (12%) | ||||||||||||||
(1) Definitions of reported, comparable, and organic, as well as reconciliations of non-GAAP financial measures, are contained elsewhere in this news release.
NA=Not Applicable
HIGHLIGHTS
•Generates reported basis EPS of $2.52 and comparable basis EPS of $2.83, including Canopy equity losses of $0.18; excluding Canopy equity losses, achieves comparable basis EPS of $3.01
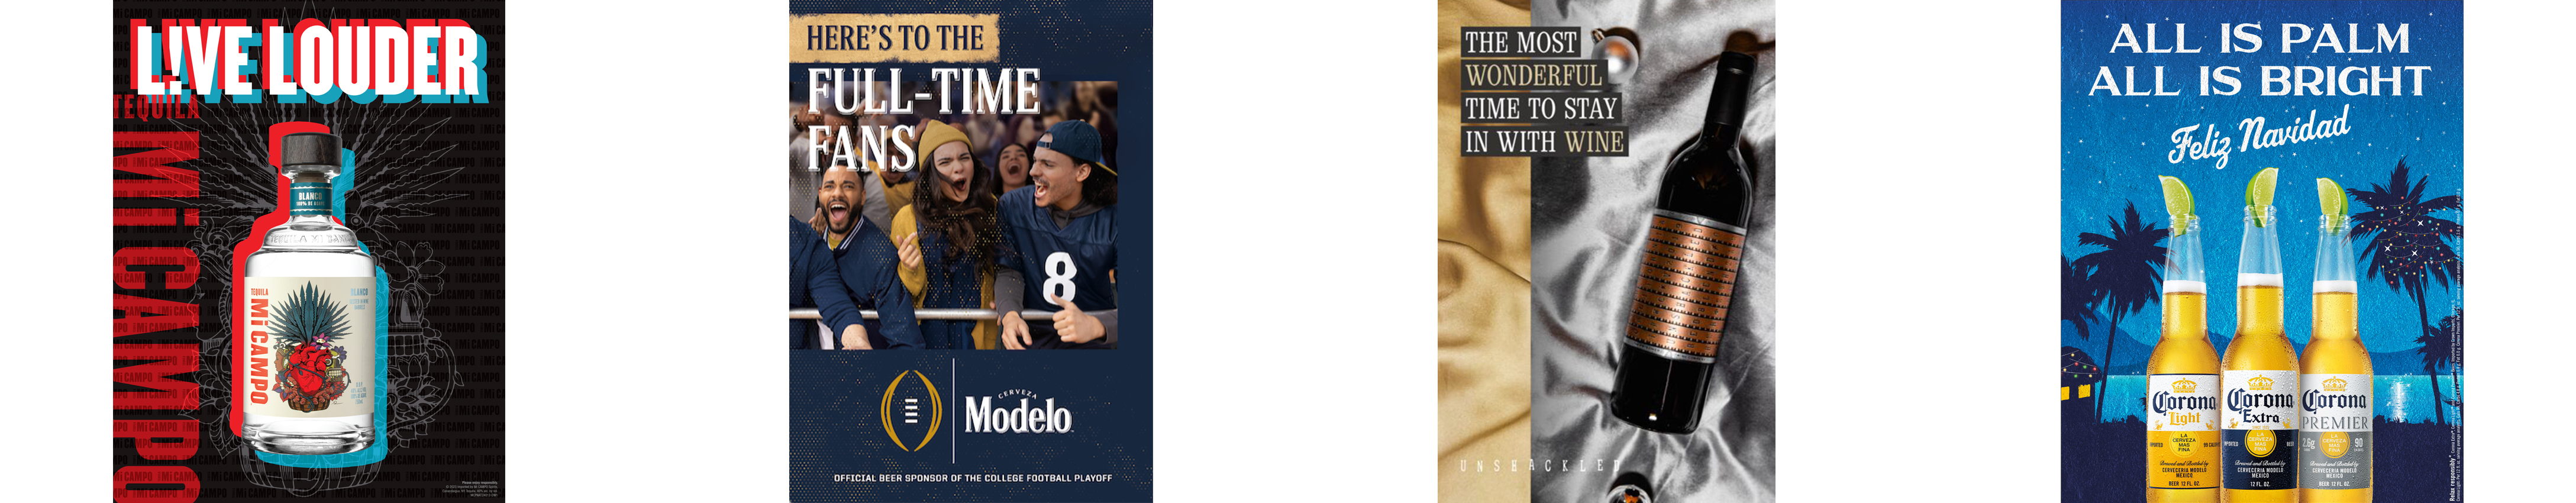
•Beer Business achieves strong net sales and solid depletion increases primarily driven by continued growth of Modelo Especial and Modelo Chelada brands
•Wine and Spirits Business delivers strong relative performance across higher-end wine and craft spirits portions of the portfolio outpacing corresponding segments of U.S. wine and spirits categories in dollar sales growth in IRI channels
•Generates $2.3 billion of operating cash flow, a decrease of 7%, and $1.6 billion of free cash flow, a decrease of 13%
•Updates fiscal 2023 reported basis EPS outlook to $0.15 - $0.35 and comparable basis EPS outlook to $11.00 - $11.20
•Affirms fiscal 2023 operating cash flow target of $2.6 - $2.8 billion and increases free cash flow projection to $1.5 - $1.6 billion
•Declares quarterly cash dividend of $0.80 per share Class A Common Stock
•Surpasses goal to return $5 billion to shareholders in dividends and share repurchases between fiscal 2020 and fiscal 2023 upon payment of latest quarterly cash dividend declared
•Completes elimination of Class B Common Stock including cash payment of $64.64 per share, or approximately $1.5 billion in aggregate, to holders of Class B Common Stock
 | ||||||||||||||||||||
 |
"Our Beer Business continued to outperform the market as the top share gainer for the sixth consecutive quarter. Our Wine and Spirits Business further advanced its strategy with our largest higher-end brands delivering growth significantly above the category segments. Looking ahead, we remain confident that we can continue to build on our strong track-record of solid growth and value creation." |
 |
"The solid top-line performance of our Beer Business has given us confidence to again raise our outlook for the full-year increasing the low-end of our net sales and operating income growth ranges. And, the capacity added by productivity initiatives at our existing brewery operations gave us flexibility in our capex plans, yielding a higher free cash flow estimate for the year. We are also now on-track to surpass our goal to return $5 billion to shareholders by fiscal year-end upon payment of this quarter's declared dividend." |
|||||||||||||||||
| Bill Newlands | Garth Hankinson | |||||||||||||||||||
President and Chief Executive Officer |
Chief Financial Officer | |||||||||||||||||||
Constellation Brands, Inc. Q3 FY 2023 Earnings Release |
#WORTHREACHINGFOR I 1
|
||||

 |
beer | ||||||||||||||||
| Shipments | Depletions | Net Sales |
Operating
Income
|
||||||||||||||
Three Months Ended | In millions; branded product, 24-pack, 12-ounce case equivalents | |||||||||||||||||
| November 30, 2022 | 97.8 | $1,891.9 | $710.0 | ||||||||||||||
| November 30, 2021 | 95.2 | $1,752.6 | $723.6 | ||||||||||||||
| % Change | 2.7% | 5.7% | 8% | (2%) | |||||||||||||
•Constellation’s Beer Business posted depletion growth of almost 6%, driven by the continued growth of Modelo Especial and strong momentum in the Modelo Chelada brands. Depletion volume selling days were flat year-over-year.
•In IRI channels, our Beer Business continued to outpace the entire beer and high-end categories in dollar sales growth and volume growth; Constellation was the #1 share gainer in market dollars for a sixth consecutive quarter, adding 1.5 points in the beer category and 2.3 points in the high-end segment, and now has 5 of the top 15 share gaining high-end brands.
•Modelo Especial grew depletions by over 4% and remained the #1 brand in the high-end and #1 brand share gainer in the entire U.S. beer category in IRI dollar sales.
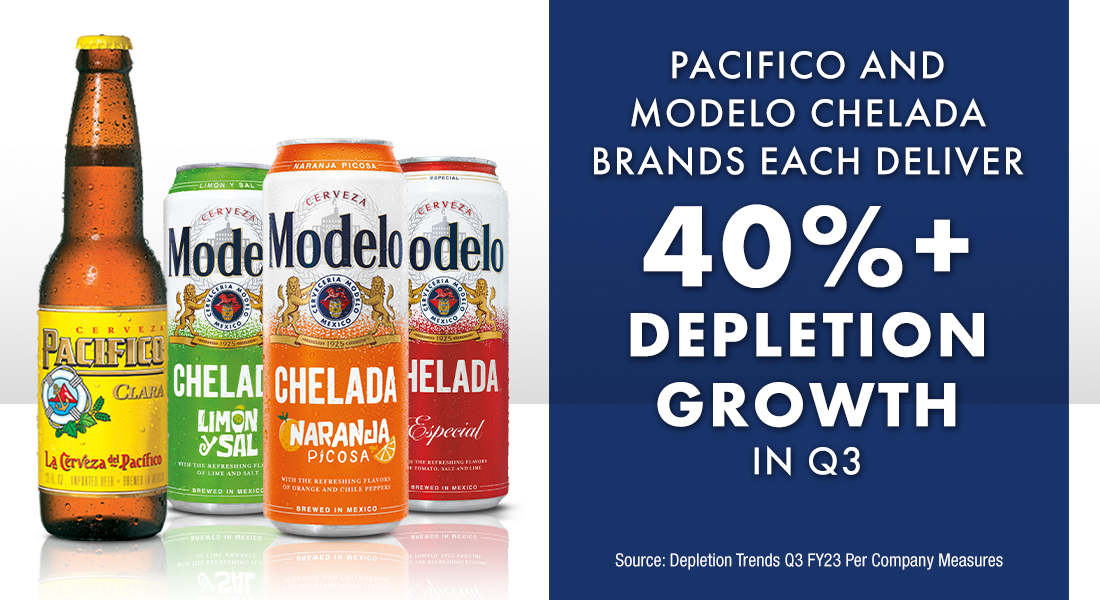
•Modelo Chelada brands continued to be the #1 chelada in the U.S. beer market, posting over 40% depletion growth and held 60% market share of the entire chelada segment.
•Corona Extra reported depletion growth of more than 1% and remained the #3 share gainer in the entire U.S. beer category in IRI channels.
•Pacifico accelerated depletion growth to more than 40% and rose to #7 top share gainer in the U.S. beer category in IRI channels.
•Operating margin decreased 380 basis points to 37.5% as benefits from net sales growth were more than offset by increased raw materials, packaging, and logistics costs due to ongoing inflationary pressures, incremental operating costs from brewery capacity expansions, and increased marketing spend as a result of shifts in timing due to sports advertisement investments.
•The Beer Business now expects net sales and operating income growth of 9 - 10% and 4 - 5%, respectively, for fiscal 2023 reflecting the strong performance of the core beer portfolio.
 |
wine and spirits | ||||||||||||||||||||||
| Shipments |
Organic Shipments (1)
|
Depletions (1)
|
Net Sales (2)
|
Organic
Net Sales (1)
|
Operating
Income (2)
|
||||||||||||||||||
| Three Months Ended | In millions; branded product, 9-liter case equivalents | |||||||||||||||||||||||
| November 30, 2022 | 6.9 | 6.9 | $544.6 | $544.6 | $134.8 | ||||||||||||||||||
| November 30, 2021 | 8.1 | 7.9 | $568.0 | $550.6 | $144.5 | ||||||||||||||||||
| % Change | (14.8%) | (12.7%) | (5.6%) | (4%) | (1%) | (7%) | |||||||||||||||||
(2) Three months ended November 30, 2021, includes $17.4 million of net sales and $10.6 million of gross profit less marketing that are no longer part of the wine and spirits segment results due to the 2022 Wine Divestiture.
HIGHLIGHTS
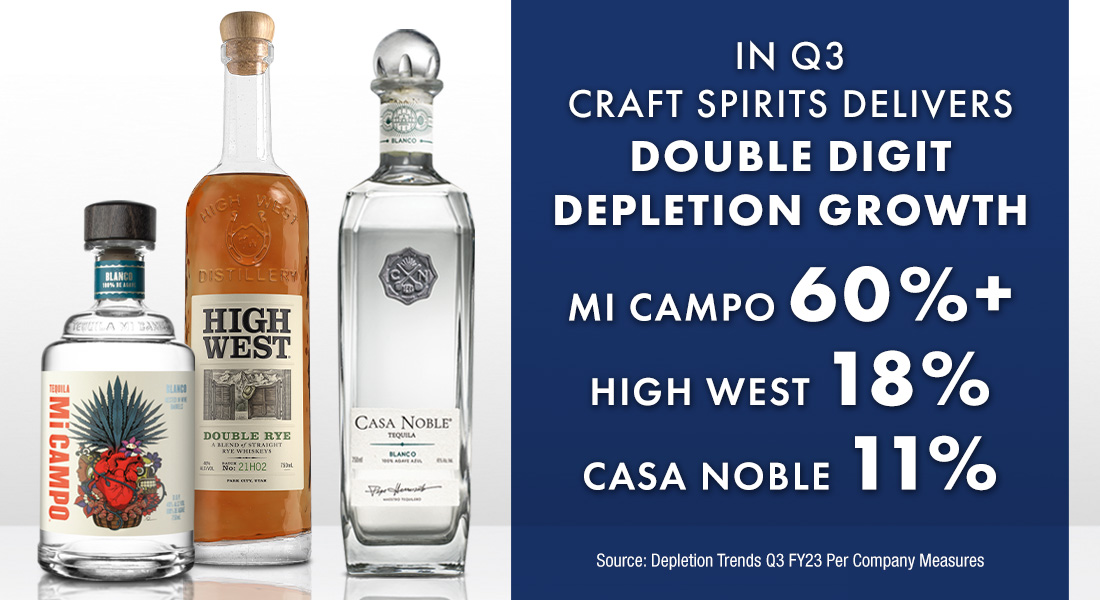
•Constellation's Aspira portfolio (fine wine and craft spirits brands) posted 9% depletion growth, driven by 7% depletion growth from The Prisoner brand family and double-digit depletion growth from Mi CAMPO Tequila, High West Whiskey, and Casa Noble Tequila.
•In IRI channels, our premium wine and craft spirits portfolios outperformed their corresponding segments in dollar sales growth; our premium wine portfolio also gained share in the entire U.S. wine category.
•International tequila shipments grew five times, driven by the continued success of Casa Noble and Mi CAMPO in our targeted international metropolitan markets.
•Our DTC channels delivered organic net sales growth of 23%; our 3-Tier eCommerce continues to lead with dollar sales growth 9 points ahead of the market.
•Innovation in our Wine and Spirits Business continues to succeed with Kim Crawford Sparkling Prosecco as the #2 new wine brand and Meiomi Red Blend as the #2 new wine SKU.
•Operating margin decreased 60 basis points to 24.8% as benefits from mix improvement and a planned decrease in marketing spend were more than offset by decreased shipment volumes including the most recent wine divestiture, increased COGS driven by higher transportation costs, and increased compensation and benefit expenses primarily related to DTC investments.
•The Wine and Spirits Business continues to expect fiscal 2023 organic net sales decline of 0 - 2% and operating income growth of 3 - 5%; see Fiscal 2023 Guidance Assumptions under Outlook for more information.
Constellation Brands, Inc. Q3 FY 2023 Earnings Release |
#WORTHREACHINGFOR I 2
|
||||
outlook | |||||||||||||||||||||||
| The table sets forth management's current EPS expectations for fiscal 2023 compared to fiscal 2022 actual results, on a reported basis, a comparable basis, and a comparable basis excluding Canopy equity earnings (losses) and related activities. | |||||||||||||||||||||||
| Reported Basis | Comparable Basis | ||||||||||||||||||||||
| FY23 Estimate | FY22 Actual | FY23 Estimate (Excl. Canopy) | FY22 Actual | FY22 Actual (Excl. Canopy) |
|||||||||||||||||||
| Fiscal Year Ending February 28 | $0.15 - $0.35 | $(0.22) | $11.00 - $11.20 | $10.20 | $10.99 | ||||||||||||||||||
| Fiscal 2023 Guidance Assumptions: | |||||||||||||||||||||||
|
•Beer: net sales growth 9 - 10%; operating income growth 4 - 5%
•Wine and Spirits: organic net sales decline 0 - 2% and operating income growth 3 - 5%, excluding $44 million of net sales and $26 million of gross profit less marketing that are no longer part of the Wine and Spirits Business results
•Interest expense: approximately $390 - $400 million
•Tax rate: reported approximately 74%; comparable excluding Canopy equity earnings impact approximately 20%
|
•Weighted average diluted shares outstanding: approximately 186.5 million
•Operating cash flow: $2.6 - $2.8 billion
•Capital expenditures: $1.1 - $1.2 billion, including approximately $1.0 billion targeted for Mexico beer operations expansion, optimization, and/or construction activities
•Free cash flow: $1.5 - $1.6 billion
|
||||||||||||||||||||||
| The reported basis EPS guidance includes the fiscal 2023 year to date Canopy equity earnings and related activities impact. Our guidance does not reflect future changes in the fair value of the company’s investment in Canopy’s warrants and debt securities. Additionally, the company continues to evaluate the future potential equity earnings impact from the Canopy equity method investment and related activities and, as such, these items have been excluded from the guidance assumptions noted above. | |||||||||||||||||||||||
BEER BUSINESS CAPITAL EXPANSION
The company plans to invest in the next increment of capacity in Mexico that will provide the long-term flexibility needed to support the expected future growth of its high-end Mexican beer portfolio. As previously announced, total capital expenditures for the Beer Business are expected to be $5.0 billion to $5.5 billion over fiscal 2023 to fiscal 2026, with the majority of the spend expected to occur in the first three years of that timeframe. The investment will support the addition of up to 30 million hectoliters of modular capacity and includes the construction of a new brewery in Southeast Mexico in the state of Veracruz, as well as continued modular capacity expansion, optimization, and/or construction activities at the company's existing sites in Nava and Obregon.
 |
canopy
Constellation’s share of Canopy’s equity earnings (losses) and related activities were as follows:
|
||||||||||
| Reported Basis |
Comparable Basis |
||||||||||
| Three Months Ended I In millions | |||||||||||
November 30, 2022 |
$(60.8) | $(36.7) | |||||||||
November 30, 2021 |
$(4.2) | $(68.4) | |||||||||
As of August 31, 2022, we evaluated our equity method investment in Canopy and determined there was an other-than-temporary impairment based on several contributing factors, including: (i) the period of time for which the fair value had been less than the carrying value and the uncertainty surrounding Canopy’s stock price recovering in the near-term, (ii) Canopy's goodwill impairment of their cannabis operations, and (iii) the uncertainty of U.S. federal cannabis permissibility. As a result, a $1,060.3 million impairment was recorded for the second quarter fiscal 2023, which is included above in the fiscal 2023 reported basis EPS outlook.
QUARTERLY DIVIDEND
On January 4, 2023, Constellation’s board of directors declared a quarterly cash dividend of $0.80 per share of Class A Common Stock payable on February 22, 2023, to stockholders of record as of the close of business on February 8, 2023.
† A copy of this news release, including the attachments and other financial information that may be discussed during the call, will be available on our investor relations website, ir.cbrands.com, prior to the call.

Constellation Brands, Inc. Q3 FY 2023 Earnings Release |
#WORTHREACHINGFOR I 3
|
||||
| ADVANCING A FUTURE WORTH REACHING FOR | ||||||||
During the third quarter, we published our 2022 ESG Impact Report, which highlights established commitments and targets to positively impact the planet and its people, and progress made toward achieving them. The table below summarizes some of these important updates on our ongoing efforts to address pressing environmental and societal needs that are important to our communities, consumers, and employees. In addition, to enable us to better meet stakeholder expectations regarding information provided on these topics, the ESG Impact Report was prepared with reference to the Sustainability Accounting Standards Board alcoholic beverages standard, considered the recommendations of the Task Force on Climate-related Financial Disclosures in developing and disclosing Constellation’s approach to managing climate risk and opportunity, and referenced the United Nations Sustainability Development Goals.
|
 |
|||||||
| Focus Areas & Approach |
Commitments & Notable Progress (3)
|
|||||||
|
Serving as good stewards of our environment and natural resources
•Modeling water stewardship for the beverage alcohol industry
•Reducing greenhouse gas (GHG) emissions through energy conservation and renewable energy initiatives
|
•Established and began implementing a three-year strategy and operating plans to restore approximately 1.1 billion gallons of water withdrawals from local watersheds, while improving accessibility and the quality of water for communities where the company operates between fiscal 2023 and fiscal 2025
•Established and began implementing a three-year strategy and operating plans to reduce Scope 1 and Scope 2 GHG emissions by 15% by fiscal 2025 (from a fiscal 2020 baseline)
|
|||||||
|
Enhancing social equity within our industry and communities
•Championing the professional development and advancement of women in the beverage alcohol industry and local communities
•Enhancing economic development and prosperity in disadvantaged communities
•Championing an inclusive culture characterized by diversity in background and thought, which reflects the consumers and communities that the company serves
|
•Invested approximately $75 million in female-led or founded businesses and approximately $15 million in minority owned businesses through August 2022 progressing toward the established goals to invest $100 million in each by fiscals 2029 and 2031, respectively
•Helped more than 3,500 women receive services and training to help advance their careers in partnership with Dress for Success and more than 4,700 Hispanic families strengthen their financial security through financial empowerment and housing counseling programs through support of UnidosUS in calendar year 2021
•Increased female representation and overall ethnic diversity among Constellation’s U.S. salaried employee population to 43% and 22%, respectively, in fiscal 2022 progressing toward the established goals of 50% and 30%, respectively, by fiscal 2026
|
|||||||
|
Promoting responsible beverage alcohol consumption
•Ensuring the responsible promotion and marketing of the company’s products
|
•Had zero instances of non-compliance with industry or regulatory labeling and/or marketing codes in fiscal 2022
•Supported the efforts of Responsibility.org to empower adults to make a lifetime of responsible alcohol choices as part of a balanced lifestyle and help eliminate drunk driving
|
|||||||
(3) Progress measures as presented in 2022 ESG Impact Report.
| ||||||||
|
ABOUT CONSTELLATION BRANDS
At Constellation Brands (NYSE: STZ), our mission is to build brands that people love because we believe sharing a toast, unwinding after a day, celebrating milestones, and helping people connect, are Worth Reaching For. It’s worth our dedication, hard work, and the bold calculated risks we take to deliver more for our consumers, trade partners, shareholders, and communities in which we live and work. It’s what has made us one of the fastest-growing large CPG companies in the U.S. at retail, and it drives our pursuit to deliver what’s next.
Today, we are a leading international producer and marketer of beer, wine, and spirits with operations in the U.S., Mexico, New Zealand, and Italy. Every day, people reach for our high-end, iconic imported beer brands such as Corona Extra, Corona Light, Corona Premier, Modelo Especial, Modelo Negra, and Pacifico, our fine wine and craft spirits brands, including The Prisoner Wine Company, Robert Mondavi Winery, Casa Noble Tequila, and High West Whiskey, and our premium wine brands such as Meiomi and Kim Crawford.
But we won’t stop here. Our visionary leadership team and passionate employees from barrel room to boardroom are reaching for the next level, to explore the boundaries of the beverage alcohol industry and beyond. Join us in discovering what’s Worth Reaching For.
To learn more, visit www.cbrands.com and follow us on Twitter, Instagram, and LinkedIn.
| ||
| MEDIA CONTACTS | INVESTOR RELATIONS CONTACTS | ||||||||||||||||
| Mike McGrew | 773-251-4934 | michael.mcgrew@cbrands.com | Joseph Suarez | 773-551-4397 | joseph.suarez@cbrands.com | ||||||||||||
| Amy Martin | 585-678-7141 | amy.martin@cbrands.com | Snehal Shah | 847-385-4940 | snehal.shah@cbrands.com | ||||||||||||
| David Paccapaniccia | 585-282-7227 | david.paccapaniccia@cbrands.com | |||||||||||||||
Constellation Brands, Inc. Q3 FY 2023 Earnings Release |
#WORTHREACHINGFOR I 4
|
||||
SUPPLEMENTAL INFORMATION
Reported basis (“reported”) are amounts as reported under generally accepted accounting principles in the U.S. Comparable basis (“comparable”) are amounts which exclude items that affect comparability (“comparable adjustments”), as they are not reflective of core operations of the segments. The company’s measure of segment profitability excludes comparable adjustments, which is consistent with the measure used by management to evaluate results. The company discusses various non-GAAP measures in this news release. Financial statements, as well as supplemental schedules and tables reconciling non-GAAP measures, together with definitions of these measures and the reasons management uses these measures, are included in this news release.
FORWARD-LOOKING STATEMENTS
The statements made under the heading Outlook and all statements other than statements of historical fact set forth in this news release, including statements regarding our business strategy, future operations, business, financial position, expected net sales and operating income, projected costs and expenses, expected effective tax rates and anticipated tax liabilities, estimated diluted EPS and shares outstanding, expected capital expenditures, operating cash flow, and free cash flow, future payments of dividends, amount, manner, and timing of share repurchases under the share repurchase authorization, consumer demand, ESG goals and efforts, and prospects, plans, and objectives of management, as well as information concerning expected actions of third parties, are forward-looking statements (collectively, “Projections”) that involve risks and uncertainties that could cause actual results to differ materially from those set forth in or implied by the Projections.
During the current quarter, Constellation may reiterate the Projections. Prior to the start of the company’s quiet period, which will begin at the close of business on February 28, 2023, the public can continue to rely on the Projections as still being Constellation’s current expectations on the matters covered, unless the company publishes a notice stating otherwise. During Constellation’s quiet period, the Projections should not be considered to constitute the company’s expectations and should be considered historical, speaking as of prior to the quiet period only and not subject to update by the company.
The Projections are based on management’s current expectations and, unless otherwise noted, do not take into account the impact of any future acquisition, investment, merger, or any other business combination, divestiture, restructuring or other strategic business realignments, financing or share repurchase that may be completed after the issuance of this release, or the amount of incremental contingent consideration payment paid or received in association with divestitures. The Projections should not be construed in any manner as a guarantee that such results will in fact occur.
In addition to the risks and uncertainties of ordinary business operations, the Projections contained in this news release are subject to risk uncertainty, and possible variance from management's expectations regarding:
•water, agricultural and other raw material, and packaging material supply, production, and/or shipment difficulties which could adversely affect our ability to supply our customers;
•inflationary pressures and our ability to pass along rising costs to consumers through increased selling prices;
•actual impact to supply, production levels, and costs from global supply chain logistics, transportation challenges, wildfires, and severe weather events, due to, among other reasons, actual supply chain and transportation performance and the actual severity and geographical reach of wildfires and severe weather events;
•actual balance of supply and demand for our products and percentage of our portfolio distributed through any particular distributor;
•actual demand, net sales, channel proportions, and volume trends for our products;
•beer operations expansion, optimization, and/or construction activities, scope, capacity, costs (including impairments), capital expenditures, and timing due to, among other reasons, market conditions, our cash and debt position, receipt of required regulatory approvals in accordance with expected dates and terms, results of discussions with government officials in Mexico, the actual amount of non-recoverable brewery construction assets and other costs, and other factors determined by management;
•duration and impact of the COVID-19 pandemic, including but not limited to new variants, vaccine efficacy and immunization rates, closures of non-essential businesses, which may include our manufacturing facilities, and other associated governmental containment actions, and the increase in cyber-security attacks that have occurred while non-production employees work remotely;
•impact of the military conflict in Ukraine and associated geopolitical tensions and responses, including on inflation, supply chains, commodities, energy, and cyber-security;
•amount, timing, and source of funds for any share repurchases, exact duration of share repurchase programs, and number of shares outstanding;
•amount and timing of future dividends which are subject to the determination and discretion of our Board of Directors and may be
impacted if our ability to use cash flow to fund dividends is affected by unanticipated increases in total net debt, we are unable to generate cash flow at anticipated levels, or we fail to generate expected earnings;
•fair value and accuracy of projections relating to the Canopy investment, including Canopy's plan to create an exchangeable share structure, conversion of our securities and related matters;
•amount of contingent consideration, if any, received in divestitures depending upon actual future brand performance;
•expected impacts of wine and spirits portfolio refinement activities;
•accuracy of supply projections, including relating to beer operations expansion, optimization, and construction activities, wine and spirits operating activities, product inventory levels, and glass sourcing;
•operating cash flow, free cash flow, effective tax rate, and capital expenditures to support long-term growth;
•accuracy of projections associated with market opportunities, new products, and previously announced acquisitions, investments, and divestitures;
•general economic, geopolitical, domestic, international, and regulatory conditions, world financial market instability, economic slowdown or recession, health epidemics or pandemics, litigation risks, unanticipated environmental liabilities and costs, or enhanced competitive activities;
•changes to international trade agreements, tariffs, accounting standards, elections, assertions, or policies, tax laws, or other governmental regulations, and other factors which could impact the company’s reported financial position, results of operations, effective tax rate, or accuracy of any associated Projections;
•changes in interest rates and the inherent unpredictability of currency fluctuations, commodity prices, and raw materials;
•long-term impacts of the reclassification; and
•other factors and uncertainties disclosed in company filings with the SEC, including its Annual Report on Form 10-K for the fiscal year ended February 28, 2022, and its Quarterly Report on Form 10-Q for the fiscal quarter ended August 31, 2022, which could cause actual future performance to differ from current expectations.
Constellation Brands, Inc. Q3 FY 2023 Earnings Release |
#WORTHREACHINGFOR I 5
|
||||
CONSTELLATION BRANDS, INC. AND SUBSIDIARIES
CONDENSED CONSOLIDATED BALANCE SHEETS
(in millions)
(unaudited)
| November 30, 2022 |
February 28, 2022 |
||||||||||
| ASSETS | |||||||||||
| Current assets: | |||||||||||
| Cash and cash equivalents | $ | 185.0 | $ | 199.4 | |||||||
| Accounts receivable | 921.0 | 899.0 | |||||||||
| Inventories | 1,802.0 | 1,573.2 | |||||||||
| Prepaid expenses and other | 617.9 | 658.1 | |||||||||
| Total current assets | 3,525.9 | 3,329.7 | |||||||||
| Property, plant, and equipment | 6,523.8 | 6,059.6 | |||||||||
| Goodwill | 7,896.6 | 7,862.4 | |||||||||
| Intangible assets | 2,741.5 | 2,755.2 | |||||||||
| Equity method investments | 771.4 | 2,688.7 | |||||||||
| Securities measured at fair value | 95.0 | 191.4 | |||||||||
| Deferred income taxes | 2,241.7 | 2,351.5 | |||||||||
| Other assets | 667.1 | 617.3 | |||||||||
| Total assets | $ | 24,463.0 | $ | 25,855.8 | |||||||
| LIABILITIES AND STOCKHOLDER’S EQUITY | |||||||||||
| Current liabilities: | |||||||||||
| Short-term borrowings | $ | 875.6 | $ | 323.0 | |||||||
| Current maturities of long-term debt | 9.6 | 605.3 | |||||||||
| Accounts payable | 1,008.1 | 899.2 | |||||||||
| Other accrued expenses and liabilities | 831.7 | 871.3 | |||||||||
| Total current liabilities | 2,725.0 | 2,698.8 | |||||||||
| Long-term debt, less current maturities | 11,287.1 | 9,488.2 | |||||||||
| Deferred income taxes and other liabilities | 1,734.2 | 1,621.0 | |||||||||
| Total liabilities | 15,746.3 | 13,808.0 | |||||||||
| CBI stockholders’ equity | 8,389.5 | 11,731.9 | |||||||||
| Noncontrolling interests | 327.2 | 315.9 | |||||||||
| Total stockholders’ equity | 8,716.7 | 12,047.8 | |||||||||
| Total liabilities and stockholders’ equity | $ | 24,463.0 | $ | 25,855.8 | |||||||
Constellation Brands, Inc. Q3 FY 2023 Earnings Release |
#WORTHREACHINGFOR I 6
|
||||
CONSTELLATION BRANDS, INC. AND SUBSIDIARIES
CONSOLIDATED STATEMENTS OF OPERATIONS
(in millions, except per share data)
(unaudited)
| Three Months Ended | Nine Months Ended | ||||||||||||||||||||||
| November 30, 2022 |
November 30, 2021 |
November 30, 2022 |
November 30, 2021 |
||||||||||||||||||||
| Sales | $ | 2,624.6 | $ | 2,507.0 | $ | 8,029.6 | $ | 7,260.3 | |||||||||||||||
| Excise taxes | (188.1) | (186.4) | (574.8) | (542.1) | |||||||||||||||||||
| Net sales | 2,436.5 | 2,320.6 | 7,454.8 | 6,718.2 | |||||||||||||||||||
| Cost of product sold | (1,209.6) | (1,094.9) | (3,647.0) | (3,143.5) | |||||||||||||||||||
| Gross profit | 1,226.9 | 1,225.7 | 3,807.8 | 3,574.7 | |||||||||||||||||||
| Selling, general, and administrative expenses | (480.2) | (385.8) | (1,431.6) | (1,254.6) | |||||||||||||||||||
| Impairment of brewery construction in progress | — | — | — | (665.9) | |||||||||||||||||||
| Operating income (loss) | 746.7 | 839.9 | 2,376.2 | 1,654.2 | |||||||||||||||||||
| Income (loss) from unconsolidated investments | (37.2) | (171.8) | (1,944.2) | (1,541.8) | |||||||||||||||||||
| Interest expense | (98.7) | (88.0) | (281.5) | (270.5) | |||||||||||||||||||
| Loss on extinguishment of debt | — | — | (23.3) | (29.4) | |||||||||||||||||||
| Income (loss) before income taxes | 610.8 | 580.1 | 127.2 | (187.5) | |||||||||||||||||||
| (Provision for) benefit from income taxes | (131.1) | (99.3) | (388.9) | (217.1) | |||||||||||||||||||
| Net income (loss) | 479.7 | 480.8 | (261.7) | (404.6) | |||||||||||||||||||
| Net (income) loss attributable to noncontrolling interests | (12.0) | (10.0) | (32.3) | (31.2) | |||||||||||||||||||
| Net income (loss) attributable to CBI | $ | 467.7 | $ | 470.8 | $ | (294.0) | $ | (435.8) | |||||||||||||||
| Net income (loss) per common share attributable to CBI: | |||||||||||||||||||||||
| Basic – Class A Common Stock | $ | 2.58 | $ | 2.53 | $ | (1.48) | $ | (2.31) | |||||||||||||||
| Basic – Class B Convertible Common Stock | $ | 1.78 | $ | 2.30 | $ | (2.01) | $ | (2.10) | |||||||||||||||
| Diluted – Class A Common Stock | $ | 2.52 | $ | 2.48 | $ | (1.48) | $ | (2.31) | |||||||||||||||
| Diluted – Class B Convertible Common Stock | $ | 1.78 | $ | 2.29 | $ | (2.01) | $ | (2.10) | |||||||||||||||
| Weighted average common shares outstanding: | |||||||||||||||||||||||
| Basic – Class A Common Stock | 166.677 | 164.999 | 164.573 | 167.692 | |||||||||||||||||||
| Basic – Class B Convertible Common Stock | 23.206 | 23.222 | 23.206 | 23.230 | |||||||||||||||||||
| Diluted – Class A Common Stock | 185.291 | 189.939 | 164.573 | 167.692 | |||||||||||||||||||
| Diluted – Class B Convertible Common Stock | 23.206 | 23.222 | 23.206 | 23.230 | |||||||||||||||||||
| Cash dividends declared per common share: | |||||||||||||||||||||||
| Class A Common Stock | $ | 0.80 | $ | 0.76 | $ | 2.40 | $ | 2.28 | |||||||||||||||
| Class B Convertible Common Stock | $ | 0.72 | $ | 0.69 | $ | 2.16 | $ | 2.07 | |||||||||||||||
Constellation Brands, Inc. Q3 FY 2023 Earnings Release |
#WORTHREACHINGFOR I 7
|
||||
|
CONSTELLATION BRANDS, INC. AND SUBSIDIARIES
CONSOLIDATED STATEMENTS OF CASH FLOWS
(in millions)
(unaudited)
| |||||||||||
| Nine Months Ended | |||||||||||
| November 30, 2022 |
November 30, 2021 |
||||||||||
| CASH FLOWS FROM OPERATING ACTIVITIES | |||||||||||
| Net income (loss) | $ | (261.7) | $ | (404.6) | |||||||
| Adjustments to reconcile net income (loss) to net cash provided by (used in) operating activities: | |||||||||||
| Unrealized net (gain) loss on securities measured at fair value | 39.1 | 1,534.8 | |||||||||
| Deferred tax provision (benefit) | 218.4 | 58.5 | |||||||||
| Depreciation | 278.4 | 248.6 | |||||||||
| Stock-based compensation | 56.1 | 33.8 | |||||||||
| Equity in (earnings) losses of equity method investees and related activities, net of distributed earnings | 845.4 | 6.0 | |||||||||
| Noncash lease expense | 66.7 | 60.9 | |||||||||
| Amortization of debt issuance costs and loss on extinguishment of debt | 31.1 | 37.5 | |||||||||
| Impairment of equity method investment | 1,060.3 | — | |||||||||
| Impairment of brewery construction in progress | — | 665.9 | |||||||||
| Gain (loss) on settlement of pre-issuance hedge contracts | 20.7 | — | |||||||||
| Change in operating assets and liabilities, net of effects from purchase and sale of business: | |||||||||||
| Accounts receivable | (25.3) | (134.8) | |||||||||
| Inventories | (259.3) | (218.4) | |||||||||
| Prepaid expenses and other current assets | 204.7 | (114.7) | |||||||||
| Accounts payable | 187.4 | 340.5 | |||||||||
| Deferred revenue | (5.1) | 124.3 | |||||||||
| Other accrued expenses and liabilities | (247.0) | 200.9 | |||||||||
| Other | 70.7 | 4.9 | |||||||||
| Total adjustments | 2,542.3 | 2,848.7 | |||||||||
| Net cash provided by (used in) operating activities | 2,280.6 | 2,444.1 | |||||||||
| CASH FLOWS FROM INVESTING ACTIVITIES | |||||||||||
| Purchase of property, plant, and equipment | (683.8) | (598.7) | |||||||||
| Purchase of business, net of cash acquired | (37.1) | (53.5) | |||||||||
| Investments in equity method investees and securities | (29.5) | (28.6) | |||||||||
| Proceeds from sale of assets | 6.6 | 4.0 | |||||||||
| Proceeds from sale of business | 96.7 | 4.6 | |||||||||
| Other investing activities | 0.5 | (2.0) | |||||||||
| Net cash provided by (used in) investing activities | (646.6) | (674.2) | |||||||||
Constellation Brands, Inc. Q3 FY 2023 Earnings Release |
#WORTHREACHINGFOR I 8
|
||||
|
CONSTELLATION BRANDS, INC. AND SUBSIDIARIES
CONSOLIDATED STATEMENTS OF CASH FLOWS
(in millions)
(unaudited)
| |||||||||||
| Nine Months Ended | |||||||||||
| November 30, 2022 |
November 30, 2021 |
||||||||||
| CASH FLOWS FROM FINANCING ACTIVITIES | |||||||||||
| Proceeds from issuance of long-term debt | 2,845.8 | 995.6 | |||||||||
| Principal payments of long-term debt | (1,657.3) | (1,363.5) | |||||||||
| Net proceeds from (repayments of) short-term borrowings | 552.6 | 243.0 | |||||||||
| Dividends paid | (441.1) | (430.5) | |||||||||
| Purchases of treasury stock | (1,400.5) | (1,390.5) | |||||||||
| Proceeds from shares issued under equity compensation plans | 36.7 | 159.7 | |||||||||
| Payments of minimum tax withholdings on stock-based payment awards | (10.5) | (9.8) | |||||||||
| Payments of debt issuance, debt extinguishment, and other financing costs | (34.1) | (35.0) | |||||||||
| Distributions to noncontrolling interests | (37.5) | (36.9) | |||||||||
| Payment to holders of Class B Stock in connection with the Reclassification | (1,500.0) | — | |||||||||
| Net cash provided by (used in) financing activities | (1,645.9) | (1,867.9) | |||||||||
| Effect of exchange rate changes on cash and cash equivalents | (2.5) | (1.3) | |||||||||
| Net increase (decrease) in cash and cash equivalents | (14.4) | (99.3) | |||||||||
| Cash and cash equivalents, beginning of period | 199.4 | 460.6 | |||||||||
| Cash and cash equivalents, end of period | $ | 185.0 | $ | 361.3 | |||||||
Constellation Brands, Inc. Q3 FY 2023 Earnings Release |
#WORTHREACHINGFOR I 9
|
||||
CONSTELLATION BRANDS, INC. AND SUBSIDIARIES
RECONCILIATION OF REPORTED AND ORGANIC NET SALES
(in millions)
(unaudited)
For periods of acquisition, we define organic net sales as current period reported net sales less net sales of products of acquired businesses reported for the current period, as appropriate. For periods of divestiture, we define organic net sales as prior period reported net sales less net sales of products of divested businesses reported for the prior period, as appropriate. We provide organic net sales because we use this information in monitoring and evaluating the underlying business trends of our core operations. In addition, we believe this information provides investors valuable insight on underlying business trends and results in order to evaluate year-over-year financial performance.
The divestiture impacting the periods below consists of the sale of certain mainstream and premium wine brands and related inventory (the "2022 Wine Divestiture") (sold October 6, 2022).
| Three Months Ended | Nine Months Ended | ||||||||||||||||||||||||||||||||||
| November 30, 2022 |
November 30, 2021 |
Percent Change |
November 30, 2022 |
November 30, 2021 |
Percent Change |
||||||||||||||||||||||||||||||
| Consolidated net sales | $ | 2,436.5 | $ | 2,320.6 | 5 | % | $ | 7,454.8 | $ | 6,718.2 | 11 | % | |||||||||||||||||||||||
Less: 2022 Wine Divestiture (1)
|
— | (17.4) | — | (17.4) | |||||||||||||||||||||||||||||||
| Consolidated organic net sales | $ | 2,436.5 | $ | 2,303.2 | 6 | % | $ | 7,454.8 | $ | 6,700.8 | 11 | % | |||||||||||||||||||||||
| Beer net sales | $ | 1,891.9 | $ | 1,752.6 | 8 | % | $ | 5,929.4 | $ | 5,185.9 | 14 | % | |||||||||||||||||||||||
| Wine and Spirits net sales | $ | 544.6 | $ | 568.0 | (4 | %) | $ | 1,525.4 | $ | 1,532.3 | — | % | |||||||||||||||||||||||
Less: 2022 Wine Divestiture (1)
|
— | (17.4) | — | (17.4) | |||||||||||||||||||||||||||||||
| Wine and Spirits organic net sales | $ | 544.6 | $ | 550.6 | (1 | %) | $ | 1,525.4 | $ | 1,514.9 | 1 | % | |||||||||||||||||||||||
(1)For the period October 6, 2021, through November 30, 2021, included in the three months and nine months ended November 30, 2021.
Constellation Brands, Inc. Q3 FY 2023 Earnings Release |
#WORTHREACHINGFOR I 10
|
||||
CONSTELLATION BRANDS, INC. AND SUBSIDIARIES
SUPPLEMENTAL SHIPMENT AND DEPLETION INFORMATION
(unaudited)
| Three Months Ended | Nine Months Ended | ||||||||||||||||||||||||||||||||||
| November 30, 2022 |
November 30, 2021 |
Percent Change |
November 30, 2022 |
November 30, 2021 |
Percent Change |
||||||||||||||||||||||||||||||
| Beer | |||||||||||||||||||||||||||||||||||
| (in millions, branded product, 24-pack, 12-ounce case equivalents) | |||||||||||||||||||||||||||||||||||
| Shipments | 97.8 | 95.2 | 2.7 | % | 310.5 | 281.0 | 10.5 | % | |||||||||||||||||||||||||||
Depletions (1)
|
5.7 | % | 7.8 | % | |||||||||||||||||||||||||||||||
| Wine and Spirits | |||||||||||||||||||||||||||||||||||
| (in millions, branded product, 9-liter case equivalents) | |||||||||||||||||||||||||||||||||||
| Shipments | 6.9 | 8.1 | (14.8 | %) | 21.1 | 22.2 | (5.0 | %) | |||||||||||||||||||||||||||
Organic shipments (2)
|
6.9 | 7.9 | (12.7 | %) | 21.1 | 22.0 | (4.1 | %) | |||||||||||||||||||||||||||
| U.S. Domestic shipments | 6.0 | 7.0 | (14.3 | %) | 18.2 | 19.3 | (5.7 | %) | |||||||||||||||||||||||||||
U.S. Domestic organic shipments (2)
|
6.0 | 6.8 | (11.8 | %) | 18.2 | 19.1 | (4.7 | %) | |||||||||||||||||||||||||||
Depletions (1) (2)
|
(5.6 | %) | (2.3 | %) | |||||||||||||||||||||||||||||||
(1) |
Depletions represent U.S. domestic distributor shipments of our respective branded products to retail customers, based on third-party data. | ||||||||||||||||||||||
(2) |
Includes adjustments to remove shipment and depletion volume associated with the 2022 Wine Divestiture for the period October 6, 2021, through November 30, 2021, included in the three months and nine months ended November 30, 2021. | ||||||||||||||||||||||
Constellation Brands, Inc. Q3 FY 2023 Earnings Release |
#WORTHREACHINGFOR I 11
|
||||
CONSTELLATION BRANDS, INC. AND SUBSIDIARIES
SUMMARIZED SEGMENT AND INCOME (LOSS) FROM UNCONSOLIDATED INVESTMENTS INFORMATION
(in millions)
(unaudited)
| Three Months Ended | Nine Months Ended | ||||||||||||||||||||||||||||||||||
| November 30, 2022 |
November 30, 2021 |
Percent Change |
November 30, 2022 |
November 30, 2021 |
Percent Change |
||||||||||||||||||||||||||||||
| Beer | |||||||||||||||||||||||||||||||||||
| Segment net sales | $ | 1,891.9 | $ | 1,752.6 | 8 | % | $ | 5,929.4 | $ | 5,185.9 | 14 | % | |||||||||||||||||||||||
| Segment gross profit | $ | 989.5 | $ | 958.1 | 3 | % | $ | 3,156.6 | $ | 2,835.8 | 11 | % | |||||||||||||||||||||||
| % Net sales | 52.3 | % | 54.7 | % | 53.2 | % | 54.7 | % | |||||||||||||||||||||||||||
| Segment operating income (loss) | $ | 710.0 | $ | 723.6 | (2 | %) | $ | 2,338.4 | $ | 2,089.7 | 12 | % | |||||||||||||||||||||||
| % Net sales | 37.5 | % | 41.3 | % | 39.4 | % | 40.3 | % | |||||||||||||||||||||||||||
| Wine and Spirits | |||||||||||||||||||||||||||||||||||
| Wine net sales | $ | 470.5 | $ | 506.2 | (7 | %) | $ | 1,316.6 | $ | 1,351.1 | (3 | %) | |||||||||||||||||||||||
| Spirits net sales | 74.1 | 61.8 | 20 | % | 208.8 | 181.2 | 15 | % | |||||||||||||||||||||||||||
| Segment net sales | $ | 544.6 | $ | 568.0 | (4 | %) | $ | 1,525.4 | $ | 1,532.3 | — | % | |||||||||||||||||||||||
| Segment gross profit | $ | 262.6 | $ | 269.6 | (3 | %) | $ | 698.4 | $ | 707.6 | (1 | %) | |||||||||||||||||||||||
| % Net sales | 48.2 | % | 47.5 | % | 45.8 | % | 46.2 | % | |||||||||||||||||||||||||||
| Segment operating income (loss) | $ | 134.8 | $ | 144.5 | (7 | %) | $ | 325.2 | $ | 348.9 | (7 | %) | |||||||||||||||||||||||
| % Net sales | 24.8 | % | 25.4 | % | 21.3 | % | 22.8 | % | |||||||||||||||||||||||||||
| Segment income (loss) from unconsolidated investments | $ | 35.4 | $ | 33.4 | 6 | % | $ | 40.3 | $ | 33.6 | 20 | % | |||||||||||||||||||||||
| Corporate Operations and Other | |||||||||||||||||||||||||||||||||||
| Segment operating income (loss) | $ | (75.1) | $ | (44.3) | (70 | %) | $ | (218.7) | $ | (161.7) | (35 | %) | |||||||||||||||||||||||
| Segment income (loss) from unconsolidated investments | $ | (4.4) | $ | (1.3) | NM | $ | (8.7) | $ | (2.1) | NM | |||||||||||||||||||||||||
Canopy equity earnings (losses) (1)
|
$ | (36.7) | $ | (68.4) | 46 | % | $ | (123.4) | $ | (142.6) | 13 | % | |||||||||||||||||||||||
| Consolidated operating income (loss) | $ | 746.7 | $ | 839.9 | (11 | %) | $ | 2,376.2 | $ | 1,654.2 | 44 | % | |||||||||||||||||||||||
| Comparable Adjustments | 23.0 | (16.1) | NM | 68.7 | 622.7 | (89 | %) | ||||||||||||||||||||||||||||
| Comparable operating income (loss) | $ | 769.7 | $ | 823.8 | (7 | %) | $ | 2,444.9 | $ | 2,276.9 | 7 | % | |||||||||||||||||||||||
| Consolidated income (loss) from unconsolidated investments | $ | (37.2) | $ | (171.8) | 78 | % | $ | (1,944.2) | $ | (1,541.8) | (26 | %) | |||||||||||||||||||||||
| Comparable Adjustments | 31.5 | 135.5 | (77 | %) | 1,852.4 | 1,430.7 | 29 | % | |||||||||||||||||||||||||||
| Comparable income (loss) from unconsolidated investments | $ | (5.7) | $ | (36.3) | 84 | % | $ | (91.8) | $ | (111.1) | 17 | % | |||||||||||||||||||||||
Consolidated EBIT (2)
|
$ | 764.0 | $ | 787.5 | (3 | %) | $ | 2,353.1 | $ | 2,165.8 | 9 | % | |||||||||||||||||||||||
| NM=Not Meaningful | |||||||||||||||||||||||||||||||||||
(1) |
We recognize our equity in earnings (losses) for Canopy Growth Corporation ("Canopy") on a two-month lag. The summarized financial information below represents 100% of Canopy’s reported results, prepared in accordance with generally accepted accounting principles in the U.S. (“GAAP”), and converted from Canadian dollars to U.S. dollars using the applicable weighted average exchange rates.
|
||||||||||||||||||||||||||||||||||||||||
| Three Months Ended | Nine Months Ended | ||||||||||||||||||||||||||||||||||||||||
| November 30, 2022 |
November 30, 2021 |
Percent Change |
November 30, 2022 |
November 30, 2021 |
Percent Change |
||||||||||||||||||||||||||||||||||||
| Net sales | $ | 90.2 | $ | 104.3 | (14 | %) | $ | 264.7 | $ | 332.4 | (20 | %) | |||||||||||||||||||||||||||||
| Gross profit (loss) | $ | 2.9 | $ | (56.5) | 105 | % | $ | (123.9) | $ | (26.6) | NM | ||||||||||||||||||||||||||||||
| % Net sales | 3.2 | % | (54.2) | % | (46.8) | % | (8.0) | % | |||||||||||||||||||||||||||||||||
| Operating income (loss) | $ | (134.6) | $ | (171.0) | 21 | % | $ | (1,992.6) | $ | (508.0) | NM | ||||||||||||||||||||||||||||||
| % Net sales | NM | NM | NM | NM | |||||||||||||||||||||||||||||||||||||
(2) |
|||||||||||||||||||||||||||||||||||||||||
Constellation Brands, Inc. Q3 FY 2023 Earnings Release |
#WORTHREACHINGFOR I 12
|
||||
CONSTELLATION BRANDS, INC. AND SUBSIDIARIES
RECONCILIATIONS OF GAAP TO NON-GAAP FINANCIAL MEASURES
(in millions, except per share data)
(unaudited)
We report our financial results in accordance with GAAP. However, non-GAAP financial measures, as defined in the reconciliation tables below, are provided because we use this information in evaluating the results of our core operations and/or internal goal setting. In addition, we believe this information provides investors valuable insight on underlying business trends and results in order to evaluate year-over-year financial performance. See the tables below for supplemental financial data and corresponding reconciliations of these non-GAAP financial measures to GAAP financial measures for the periods presented. Non-GAAP financial measures should be considered in addition to, not as a substitute for, or superior to, our reported results prepared in accordance with GAAP. Please refer to our investor relations website at ir.cbrands.com/financial-information/financial-history-non-gaap for a more detailed description and further discussion of these non-GAAP financial measures.
| Three Months Ended November 30, 2022 | Three Months Ended November 30, 2021 | Percent Change - Reported Basis (GAAP) |
Percent Change - Comparable Basis (Non-GAAP) |
||||||||||||||||||||||||||||||||
| Reported Basis (GAAP) |
Comparable Adjustments |
Comparable Basis (Non-GAAP) |
Reported Basis (GAAP) |
Comparable Adjustments |
Comparable Basis (Non-GAAP) |
||||||||||||||||||||||||||||||
| Net sales | $ | 2,436.5 | $ | 2,436.5 | $ | 2,320.6 | $ | 2,320.6 | 5 | % | 5 | % | |||||||||||||||||||||||
| Cost of product sold | (1,209.6) | $ | 25.2 | (1,094.9) | $ | 2.0 | |||||||||||||||||||||||||||||
| Gross profit | 1,226.9 | 25.2 | $ | 1,252.1 | 1,225.7 | 2.0 | $ | 1,227.7 | — | % | 2 | % | |||||||||||||||||||||||
| Selling, general, and administrative expenses | (480.2) | (2.2) | (385.8) | (18.1) | |||||||||||||||||||||||||||||||
| Operating income (loss) | 746.7 | 23.0 | $ | 769.7 | 839.9 | (16.1) | $ | 823.8 | (11 | %) | (7 | %) | |||||||||||||||||||||||
| Income (loss) from unconsolidated investments | (37.2) | 31.5 | (171.8) | 135.5 | |||||||||||||||||||||||||||||||
| EBIT | $ | 764.0 | $ | 787.5 | NA | (3 | %) | ||||||||||||||||||||||||||||
| Interest expense | (98.7) | (88.0) | |||||||||||||||||||||||||||||||||
| Income (loss) before income taxes | 610.8 | 54.5 | $ | 665.3 | 580.1 | 119.4 | $ | 699.5 | 5 | % | (5 | %) | |||||||||||||||||||||||
(Provision for) benefit from income taxes (1)
|
(131.1) | 2.5 | (99.3) | 1.9 | |||||||||||||||||||||||||||||||
| Net income (loss) | 479.7 | 57.0 | 480.8 | 121.3 | |||||||||||||||||||||||||||||||
| Net (income) loss attributable to noncontrolling interests | (12.0) | (10.0) | |||||||||||||||||||||||||||||||||
| Net income (loss) attributable to CBI | $ | 467.7 | $ | 57.0 | $ | 524.7 | $ | 470.8 | $ | 121.3 | $ | 592.1 | (1 | %) | (11 | %) | |||||||||||||||||||
EPS (2)
|
$ | 2.52 | $ | 0.31 | $ | 2.83 | $ | 2.48 | $ | 0.64 | $ | 3.12 | 2 | % | (9 | %) | |||||||||||||||||||
| Weighted average common shares outstanding – diluted | 185.291 | 185.291 | 189.939 | 189.939 | |||||||||||||||||||||||||||||||
| Gross margin | 50.4 | % | 51.4 | % | 52.8 | % | 52.9 | % | |||||||||||||||||||||||||||
| Operating margin | 30.6 | % | 31.6 | % | 36.2 | % | 35.5 | % | |||||||||||||||||||||||||||
| Effective tax rate | 21.5 | % | 19.3 | % | 17.1 | % | 13.9 | % | |||||||||||||||||||||||||||
Constellation Brands, Inc. Q3 FY 2023 Earnings Release |
#WORTHREACHINGFOR I 13
|
||||
| Three Months Ended November 30, 2022 | Three Months Ended November 30, 2021 | ||||||||||||||||||||||||||||
| Comparable Adjustments |
Acquisitions,
Divestitures,
and Related
Costs (3)
|
Restructuring
and Other Strategic Business Development Costs (4)
|
Other (5)
|
Total |
Acquisitions,
Divestitures,
and Related
Costs (3)
|
Restructuring and Other Strategic Business Development Costs |
Other (5)
|
Total | |||||||||||||||||||||
| Cost of product sold | $ | (2.1) | $ | (1.1) | $ | (22.0) | $ | (25.2) | $ | (0.1) | $ | — | $ | (1.9) | $ | (2.0) | |||||||||||||
| Selling, general, and administrative expenses | $ | 9.8 | $ | (0.2) | $ | (7.4) | $ | 2.2 | $ | 7.5 | $ | 0.2 | $ | 10.4 | $ | 18.1 | |||||||||||||
| Operating income (loss) | $ | 7.7 | $ | (1.3) | $ | (29.4) | $ | (23.0) | $ | 7.4 | $ | 0.2 | $ | 8.5 | $ | 16.1 | |||||||||||||
| Income (loss) from unconsolidated investments | $ | (4.0) | $ | (12.9) | $ | (14.6) | $ | (31.5) | $ | (0.7) | $ | (0.7) | $ | (134.1) | $ | (135.5) | |||||||||||||
(Provision for) benefit from income taxes (1)
|
$ | (11.6) | $ | 0.4 | $ | 8.7 | $ | (2.5) | $ | 1.5 | $ | (0.1) | $ | (3.3) | $ | (1.9) | |||||||||||||
| Net income (loss) attributable to CBI | $ | (7.9) | $ | (13.8) | $ | (35.3) | $ | (57.0) | $ | 8.2 | $ | (0.6) | $ | (128.9) | $ | (121.3) | |||||||||||||
EPS (2)
|
$ | (0.04) | $ | (0.07) | $ | (0.19) | $ | (0.31) | $ | 0.04 | $ | — | $ | (0.68) | $ | (0.64) | |||||||||||||
(1) The effective tax rate applied to each Comparable Adjustment amount is generally based upon the jurisdiction in which the Comparable Adjustment was recognized. For the three months ended November 30, 2022, the (provision for) benefit from income taxes includes net income tax expense related to a prior period divestiture. For the nine months ended November 30, 2022, the (provision for) benefit from income taxes includes a net income tax expense recognized as a result of an adjustment to a valuation allowance, partially offset by a net income tax benefit recognized from the realization of tax losses related to a prior period divestiture. For the nine months ended November 30, 2021, the (provision for) benefit from income taxes includes a net income tax provision recognized as a result of a legislative update in Switzerland, partially offset by a net income tax benefit recognized as a result of adjustments to valuation allowances.
(2) May not sum due to rounding as each item is computed independently. The comparable adjustments and comparable basis diluted net income (loss) per share are calculated on a fully dilutive basis. (6)
(3) For the three months ended November 30, 2022, acquisitions, divestitures, and related costs largely consist of a net gain recognized in connection with the 2022 Wine Divestiture, partially offset by net income tax expense related to a prior period divestiture. For the three months ended November 30, 2021, adjustments consist primarily of a gain related to the remeasurement of our previously held equity interest in My Favorite Neighbor, LLC to the acquisition date fair value, partially offset by transition services agreements activity related to the previous sale of a portion of our wine and spirits business.
(4) For the three months ended November 30, 2022, restructuring and other strategic business development costs consist predominantly of equity losses from Canopy largely related to costs designed to improve their organizational focus, streamline operations, and align product capability with projected demand.
(5) For the three months ended November 30, 2022, other consists primarily of (i) a net loss from the mark to fair value of undesignated commodity derivative contracts, (ii) costs associated with the reclassification, conversion, and exchange of our Class B Convertible Common Stock into our Class A Common Stock (the "Reclassification"), (iii) an unrealized net loss from the mark to fair value of our investment in Canopy, and (iv) costs associated with Canopy equity earnings (losses). For the three months ended November 30, 2021, adjustments consist primarily of (i) an unrealized net loss from the mark to fair value of our investment in Canopy and (ii) a net loss from the mark to fair value of undesignated commodity derivative contracts, partially offset by (i) a net gain associated with Canopy equity earnings (losses), (ii) net flow through of reserved inventory following the 2020 U.S. West Coast wildfires, and (iii) a gain from a property tax settlement.
Constellation Brands, Inc. Q3 FY 2023 Earnings Release |
#WORTHREACHINGFOR I 14
|
||||
CONSTELLATION BRANDS, INC. AND SUBSIDIARIES
RECONCILIATIONS OF GAAP TO NON-GAAP FINANCIAL MEASURES (continued)
(in millions except per share data)
(unaudited)
| Nine Months Ended November 30, 2022 | Nine Months Ended November 30, 2021 | Percent Change - Reported Basis (GAAP) |
Percent Change - Comparable Basis (Non-GAAP) |
||||||||||||||||||||||||||||||||
| Reported Basis (GAAP) |
Comparable Adjustments |
Comparable Basis (Non-GAAP) |
Reported Basis (GAAP) |
Comparable Adjustments |
Comparable Basis (Non-GAAP) |
||||||||||||||||||||||||||||||
| Net sales | $ | 7,454.8 | $ | 7,454.8 | $ | 6,718.2 | $ | 6,718.2 | 11 | % | 11 | % | |||||||||||||||||||||||
| Cost of product sold | (3,647.0) | $ | 47.2 | (3,143.5) | $ | (31.3) | |||||||||||||||||||||||||||||
| Gross profit | 3,807.8 | 47.2 | $ | 3,855.0 | 3,574.7 | (31.3) | $ | 3,543.4 | 7 | % | 9 | % | |||||||||||||||||||||||
| Selling, general, and administrative expenses | (1,431.6) | 21.5 | (1,254.6) | (11.9) | |||||||||||||||||||||||||||||||
| Impairment of brewery construction in progress | — | (665.9) | 665.9 | ||||||||||||||||||||||||||||||||
| Operating income (loss) | 2,376.2 | 68.7 | $ | 2,444.9 | 1,654.2 | 622.7 | $ | 2,276.9 | 44 | % | 7 | % | |||||||||||||||||||||||
| Income (loss) from unconsolidated investments | (1,944.2) | 1,852.4 | (1,541.8) | 1,430.7 | |||||||||||||||||||||||||||||||
| EBIT | $ | 2,353.1 | $ | 2,165.8 | NA | 9 | % | ||||||||||||||||||||||||||||
| Interest expense | (281.5) | (270.5) | |||||||||||||||||||||||||||||||||
| Loss on extinguishment of debt | (23.3) | 23.3 | (29.4) | 29.4 | |||||||||||||||||||||||||||||||
| Income (loss) before income taxes | 127.2 | 1,944.4 | $ | 2,071.6 | (187.5) | 2,082.8 | $ | 1,895.3 | NM | 9 | % | ||||||||||||||||||||||||
(Provision for) benefit from income taxes (1)
|
(388.9) | (33.2) | (217.1) | (138.9) | |||||||||||||||||||||||||||||||
| Net income (loss) | (261.7) | 1,911.2 | (404.6) | 1,943.9 | |||||||||||||||||||||||||||||||
| Net (income) loss attributable to noncontrolling interests | (32.3) | (31.2) | |||||||||||||||||||||||||||||||||
| Net income (loss) attributable to CBI | $ | (294.0) | $ | 1,911.2 | $ | 1,617.2 | $ | (435.8) | $ | 1,943.9 | $ | 1,508.1 | 33 | % | 7 | % | |||||||||||||||||||
EPS (2)
|
$ | (1.48) | $ | 10.23 | $ | 8.66 | $ | (2.31) | $ | 10.09 | $ | 7.82 | 36 | % | 11 | % | |||||||||||||||||||
Weighted average common shares outstanding – diluted (6)
|
164.573 | 22.220 | 186.793 | 167.692 | 25.037 | 192.729 | |||||||||||||||||||||||||||||
| Gross margin | 51.1 | % | 51.7 | % | 53.2 | % | 52.7 | % | |||||||||||||||||||||||||||
| Operating margin | 31.9 | % | 32.8 | % | 24.6 | % | 33.9 | % | |||||||||||||||||||||||||||
| Effective tax rate | 305.7 | % | 20.4 | % | (115.8) | % | 18.8 | % | |||||||||||||||||||||||||||
Constellation Brands, Inc. Q3 FY 2023 Earnings Release |
#WORTHREACHINGFOR I 15
|
||||
| Nine Months Ended November 30, 2022 | Nine Months Ended November 30, 2021 | ||||||||||||||||||||||||||||
| Comparable Adjustments |
Acquisitions,
Divestitures,
and Related
Costs (7)
|
Restructuring
and Other Strategic Business Development Costs (8)
|
Other (9)
|
Total |
Acquisitions,
Divestitures,
and Related
Costs (7)
|
Restructuring
and Other Strategic Business Development Costs (8)
|
Other (9)
|
Total | |||||||||||||||||||||
| Cost of product sold | $ | (4.0) | $ | (1.1) | $ | (42.1) | $ | (47.2) | $ | — | $ | (2.6) | $ | 33.9 | $ | 31.3 | |||||||||||||
| Selling, general, and administrative expenses | $ | 6.4 | $ | (2.8) | $ | (25.1) | $ | (21.5) | $ | 2.9 | $ | 0.1 | $ | 8.9 | $ | 11.9 | |||||||||||||
| Impairment of brewery construction in progress | $ | — | $ | — | $ | — | $ | — | $ | — | $ | — | $ | (665.9) | $ | (665.9) | |||||||||||||
| Operating income (loss) | $ | 2.4 | $ | (3.9) | $ | (67.2) | $ | (68.7) | $ | 2.9 | $ | (2.5) | $ | (623.1) | $ | (622.7) | |||||||||||||
| Income (loss) from unconsolidated investments | $ | (5.5) | $ | (115.6) | $ | (1,731.3) | $ | (1,852.4) | $ | (4.0) | $ | (70.7) | $ | (1,356.0) | $ | (1,430.7) | |||||||||||||
| Loss on extinguishment of debt | $ | — | $ | — | $ | (23.3) | $ | (23.3) | $ | — | $ | — | $ | (29.4) | $ | (29.4) | |||||||||||||
(Provision for) benefit from income taxes (1)
|
$ | 141.0 | $ | 5.1 | $ | (112.9) | $ | 33.2 | $ | 5.8 | $ | 3.3 | $ | 129.8 | $ | 138.9 | |||||||||||||
| Net income (loss) attributable to CBI | $ | 137.9 | $ | (114.4) | $ | (1,934.7) | $ | (1,911.2) | $ | 4.7 | $ | (69.9) | $ | (1,878.7) | $ | (1,943.9) | |||||||||||||
EPS (2)
|
$ | 0.74 | $ | (0.61) | $ | (10.36) | $ | (10.23) | $ | 0.02 | $ | (0.36) | $ | (9.75) | $ | (10.09) | |||||||||||||
(6) We have excluded the following weighted average common shares outstanding from the calculation of diluted net income (loss) per common share, as the effect of including these would have been anti-dilutive, in millions:
| For the Nine Months Ended November 30, |
|||||||||||
| 2022 | 2021 | ||||||||||
| Class B Convertible Common Stock | 21.434 | 23.230 | |||||||||
| Stock-based awards, primarily stock options | 0.786 | 1.807 | |||||||||
(7) For the nine months ended November 30, 2022, acquisitions, divestitures, and related costs largely consist of a net income tax benefit recognized from the realization of tax losses related to a prior period divestiture and a net gain recognized in connection with the 2022 Wine Divestiture. For the nine months ended November 30, 2021, adjustments consist primarily of a gain related to the remeasurement of our previously held equity interest in My Favorite Neighbor, LLC to the acquisition date fair value, partially offset by transition services agreements activity related to the previous sale of a portion of our wine and spirits business.
(8) For the nine months ended November 30, 2022, and November 30, 2021, restructuring and other strategic business development costs consist primarily of equity losses from Canopy related to costs designed to improve their organizational focus, streamline operations, and align product capability with projected demand.
(9) For the nine months ended November 30, 2022, other consists primarily of (i) an impairment of our Canopy equity method investment, (ii) costs associated with Canopy equity earnings (losses), largely driven by its goodwill impairment, (iii) a net income tax expense recognized as a result of an adjustment to a valuation allowance, (iv) an unrealized net loss from the mark to fair value of our investment in Canopy, (v) a net loss from the mark to fair value of undesignated commodity derivative contracts, and (vi) costs associated with the Reclassification. For the nine months ended November 30, 2021, adjustments consist primarily of (i) an unrealized net loss from the mark to fair value of our investment in Canopy, (ii) an impairment of long-lived assets in connection with certain assets at the canceled Mexicali Brewery construction project, (iii) a loss on extinguishment of debt, and (iv) a net income tax provision recognized as a result of a legislative update in Switzerland, partially offset by (i) a net gain associated with Canopy equity earnings (losses), (ii) a net gain from the mark to fair value of undesignated commodity derivative contracts, (iii) net flow through of reserved inventory following the 2020 U.S. West Coast wildfires, and (iv) a gain from a property tax settlement.
Constellation Brands, Inc. Q3 FY 2023 Earnings Release |
#WORTHREACHINGFOR I 16
|
||||
CONSTELLATION BRANDS, INC. AND SUBSIDIARIES
RECONCILIATIONS OF GAAP TO NON-GAAP FINANCIAL MEASURES (continued)
(in millions, except per share data)
(unaudited)
Canopy Equity Earnings (Losses) and Related Activities (“Canopy EIE”)
Canopy EIE non-GAAP financial measures are provided because management uses this information to monitor our investment in Canopy. In addition, we believe this information provides investors valuable insight on underlying business trends and results in order to evaluate year-over-year financial performance.
| Three Months Ended | Nine Months Ended | ||||||||||||||||||||||
| November 30, 2022 |
November 30, 2021 |
November 30, 2022 |
November 30, 2021 |
||||||||||||||||||||
Equity earnings (losses) and related activities - reported basis, Canopy EIE (GAAP) (1)
|
$ | (60.8) | $ | (4.2) | $ | (876.5) | $ | (39.5) | |||||||||||||||
Comparable Adjustments (2)(3)
|
24.1 | (64.2) | 753.0 | (103.1) | |||||||||||||||||||
| Equity earnings (losses) and related activities - comparable basis, Canopy EIE (Non-GAAP) | (36.7) | (68.4) | (123.5) | (142.6) | |||||||||||||||||||
(Provision for) benefit from income taxes (3)
|
3.4 | 10.0 | 15.1 | 23.6 | |||||||||||||||||||
| Net income (loss) attributable to CBI - comparable basis, Canopy EIE (Non-GAAP) | $ | (33.3) | $ | (58.4) | $ | (108.4) | $ | (119.0) | |||||||||||||||
| Three Months Ended | Nine Months Ended | ||||||||||||||||||||||
| November 30, 2022 |
November 30, 2021 |
November 30, 2022 |
November 30, 2021 |
||||||||||||||||||||
| EPS - reported basis, Canopy EIE (GAAP) | $ | (0.31) | $ | 0.02 | $ | (4.41) | $ | (0.05) | |||||||||||||||
| Comparable Adjustments - Canopy EIE (Non-GAAP) | 0.13 | (0.32) | 3.83 | (0.57) | |||||||||||||||||||
EPS - comparable basis, Canopy EIE (Non-GAAP) (4)
|
$ | (0.18) | $ | (0.31) | $ | (0.58) | $ | (0.62) | |||||||||||||||
| Three Months Ended | |||||||||||||||||||||||||||||||||||
| November 30, 2022 | November 30, 2021 | ||||||||||||||||||||||||||||||||||
| Income (loss) before income taxes |
(Provision for) benefit from income taxes (3)
|
Effective tax rate (5)
|
Income (loss) before income taxes |
(Provision for) benefit from income taxes (3)
|
Effective tax rate (5)
|
||||||||||||||||||||||||||||||
| Reported basis (GAAP) | $ | 610.8 | $ | (131.1) | 21.5 | % | $ | 580.1 | $ | (99.3) | 17.1 | % | |||||||||||||||||||||||
| Comparable Adjustments - (Non-GAAP) | 54.5 | 2.5 | 119.4 | 1.9 | |||||||||||||||||||||||||||||||
| Comparable basis (Non-GAAP) | 665.3 | (128.6) | 19.3 | % | 699.5 | (97.4) | 13.9 | % | |||||||||||||||||||||||||||
| Comparable basis, Canopy EIE (Non-GAAP) | (36.7) | 3.4 | (68.4) | 10.0 | |||||||||||||||||||||||||||||||
| Comparable basis, excluding Canopy EIE (Non-GAAP) | $ | 702.0 | $ | (132.0) | 18.8 | % | $ | 767.9 | $ | (107.4) | 14.0 | % | |||||||||||||||||||||||
| Three Months Ended | Nine Months Ended | ||||||||||||||||||||||
| November 30, 2022 |
November 30, 2021 |
November 30, 2022 |
November 30, 2021 |
||||||||||||||||||||
EPS - comparable basis (Non-GAAP) (6)
|
$ | 2.83 | $ | 3.12 | $ | 8.66 | $ | 7.82 | |||||||||||||||
| Comparable basis, Canopy EIE (Non-GAAP) | 0.18 | 0.31 | 0.58 | 0.62 | |||||||||||||||||||
EPS - comparable basis, excluding Canopy EIE (Non-GAAP) (4)
|
$ | 3.01 | $ | 3.42 | $ | 9.24 | $ | 8.44 | |||||||||||||||
(1) |
Equity earnings (losses) and related activities are included in income (loss) from unconsolidated investments. | |||||||||||||
(2) |
Comparable Adjustments, Canopy EIE include: a goodwill impairment, restructuring and other strategic business development costs, unrealized net (gain) loss from the mark to fair value of securities measured at fair value and related activities, acquisition costs, and other (gains) losses. | |||||||||||||
Constellation Brands, Inc. Q3 FY 2023 Earnings Release |
#WORTHREACHINGFOR I 17
|
||||
(3) |
The Comparable Adjustment effective tax rate applied to each Comparable Adjustment amount is generally based upon the jurisdiction in which the adjustment was recognized. The benefit from income taxes effective tax rate applied to our Canopy equity earnings (losses) and related activities is generally based on the tax rates of the legal entities that hold our investment. | |||||||||||||
(4) |
May not sum due to rounding as each item is computed independently. The comparable adjustments and comparable basis diluted net income per share are calculated on a fully dilutive basis. |
|||||||||||||
(5) |
Effective tax rate is not considered a GAAP financial measure, for purposes of this reconciliation, we derived the reported GAAP measure based on GAAP results, which serves as the basis for the reconciliation to the comparable non-GAAP financial measure. | |||||||||||||
(6) |
||||||||||||||
| EPS Guidance | Range for the Year Ending February 28, 2023 | ||||||||||
| Forecasted EPS - reported basis (GAAP) | $ | 0.15 | $ | 0.35 | |||||||
Acquisitions, divestitures, and related costs (1)
|
(0.71) | (0.71) | |||||||||
Restructuring and other strategic business development costs (2)
|
0.61 | 0.61 | |||||||||
Other (3)
|
10.37 | 10.37 | |||||||||
| Comparable basis, Canopy EIE (Non-GAAP) | 0.58 | 0.58 | |||||||||
Forecasted EPS - comparable basis, excluding Canopy EIE (Non-GAAP) (4)
|
$ | 11.00 | $ | 11.20 | |||||||
| Actual for the Year Ended February 28, 2022 | |||||
| EPS - reported basis (GAAP) | $ | (0.22) | |||
Acquisitions, divestitures, and related costs (1)
|
(0.24) | ||||
Restructuring and other strategic business development costs (2)
|
0.32 | ||||
Other (3)
|
10.32 | ||||
EPS - comparable basis (Non-GAAP) (4)
|
10.20 | ||||
| Comparable basis, Canopy EIE (Non-GAAP) | 0.80 | ||||
EPS - comparable basis, excluding Canopy EIE (Non-GAAP) (4)
|
$ | 10.99 | |||
(1) |
Acquisitions, divestitures, and related costs include: (4)
|
Estimated for the Year Ending February 28, 2023 | Actual for the Year Ended February 28, 2022 | |||||||||||
| Net income tax provision recognized for the reversal of valuation allowances | $ | (0.77) | $ | (0.02) | ||||||||||
| Gain on the remeasurement of our previously held equity method investments | $ | (0.03) | $ | (0.07) | ||||||||||
| Transition services agreements activity | $ | 0.07 | $ | 0.08 | ||||||||||
| My Favorite Neighbor transaction, integration, and other acquisition-related costs | $ | 0.02 | $ | — | ||||||||||
| Net gain on sale of unconsolidated investment | $ | — | $ | (0.25) | ||||||||||
(2) |
For the year ending February 28, 2023, and year ended February 28, 2022, restructuring and other strategic business development costs primarily consist of equity losses from Canopy largely related to costs designed to improve their organizational focus, streamline operations, and align product capability with projected demand. For the year ended February 28, 2022, restructuring and other strategic business development costs were partially offset by a net income tax benefit recognized as a result of an intra-entity transfer of assets. |
|||||||||||||
(3) |
Other includes: (4)
|
Estimated for the Year Ending February 28, 2023 | Actual for the Year Ended February 28, 2022 | |||||||||||
| Impairment of equity method investment | $ | 5.57 | $ | — | ||||||||||
Constellation Brands, Inc. Q3 FY 2023 Earnings Release |
#WORTHREACHINGFOR I 18
|
||||
| Canopy equity (earnings) losses and related activities comparable adjustments | $ | 2.73 | $ | (0.66) | ||||||||||
Net income tax expense recognized for an adjustment to a valuation allowance |
$ | 1.03 | $ | — | ||||||||||
| Unconsolidated investments, other | $ | 0.48 | $ | (0.35) | ||||||||||
| Unrealized net (gain) loss from mark to fair value of our investment in Canopy | $ | 0.20 | $ | 8.33 | ||||||||||
| Costs associated with the Reclassification | $ | 0.13 | $ | — | ||||||||||
| Loss on extinguishment of debt | $ | 0.09 | $ | 0.11 | ||||||||||
| Net loss on change in estimated fair value of contingent liabilities associated with prior period acquisitions | $ | (0.02) | $ | 0.04 | ||||||||||
| Net flow through of reserved inventory | $ | (0.01) | $ | (0.05) | ||||||||||
| Impairment of brewery construction in progress | $ | — | $ | 3.08 | ||||||||||
| Adjustments related to a prior period acquisition | $ | — | $ | 0.08 | ||||||||||
| Net income tax provision recognized as a result of a legislative update in Switzerland | $ | — | $ | 0.06 | ||||||||||
| Property tax settlement | $ | — | $ | (0.04) | ||||||||||
(4) |
May not sum due to rounding as each item is computed independently. The comparable adjustments and comparable basis diluted net income per share are calculated on a fully dilutive basis. | |||||||||||||
|
Free Cash Flow Guidance
Free cash flow, as defined in the reconciliation below, is considered a liquidity measure and is considered to provide useful information to investors about the amount of cash generated, which can then be used, after required debt service and dividend payments, for other general corporate purposes. A limitation of free cash flow is that it does not represent the total increase or decrease in the cash balance for the period. Free cash flow should be considered in addition to, not as a substitute for, or superior to, cash flow from operating activities prepared in accordance with GAAP.
| |||||||||||
| Range for the Year Ending February 28, 2023 |
|||||||||||
| Net cash provided by operating activities (GAAP) | $ | 2,600.0 | $ | 2,800.0 | |||||||
| Purchase of property, plant, and equipment | (1,100.0) | (1,200.0) | |||||||||
| Free cash flow (Non-GAAP) | $ | 1,500.0 | $ | 1,600.0 | |||||||
| Nine Months Ended | |||||||||||
| November 30, 2022 |
November 30, 2021 |
||||||||||
| Net cash provided by operating activities (GAAP) | $ | 2,280.6 | $ | 2,444.1 | |||||||
| Purchase of property, plant, and equipment | (683.8) | (598.7) | |||||||||
| Free cash flow (Non-GAAP) | $ | 1,596.8 | $ | 1,845.4 | |||||||
Constellation Brands, Inc. Q3 FY 2023 Earnings Release |
#WORTHREACHINGFOR I 19
|
||||