EXHIBIT 99.1
Published on June 29, 2018
Exhibit 99.1

First Quarter Results In-line with Company Expectations
Increases FY 2019 Reported Basis EPS Guidance; Affirms FY 2019 Comparable Basis EPS Guidance
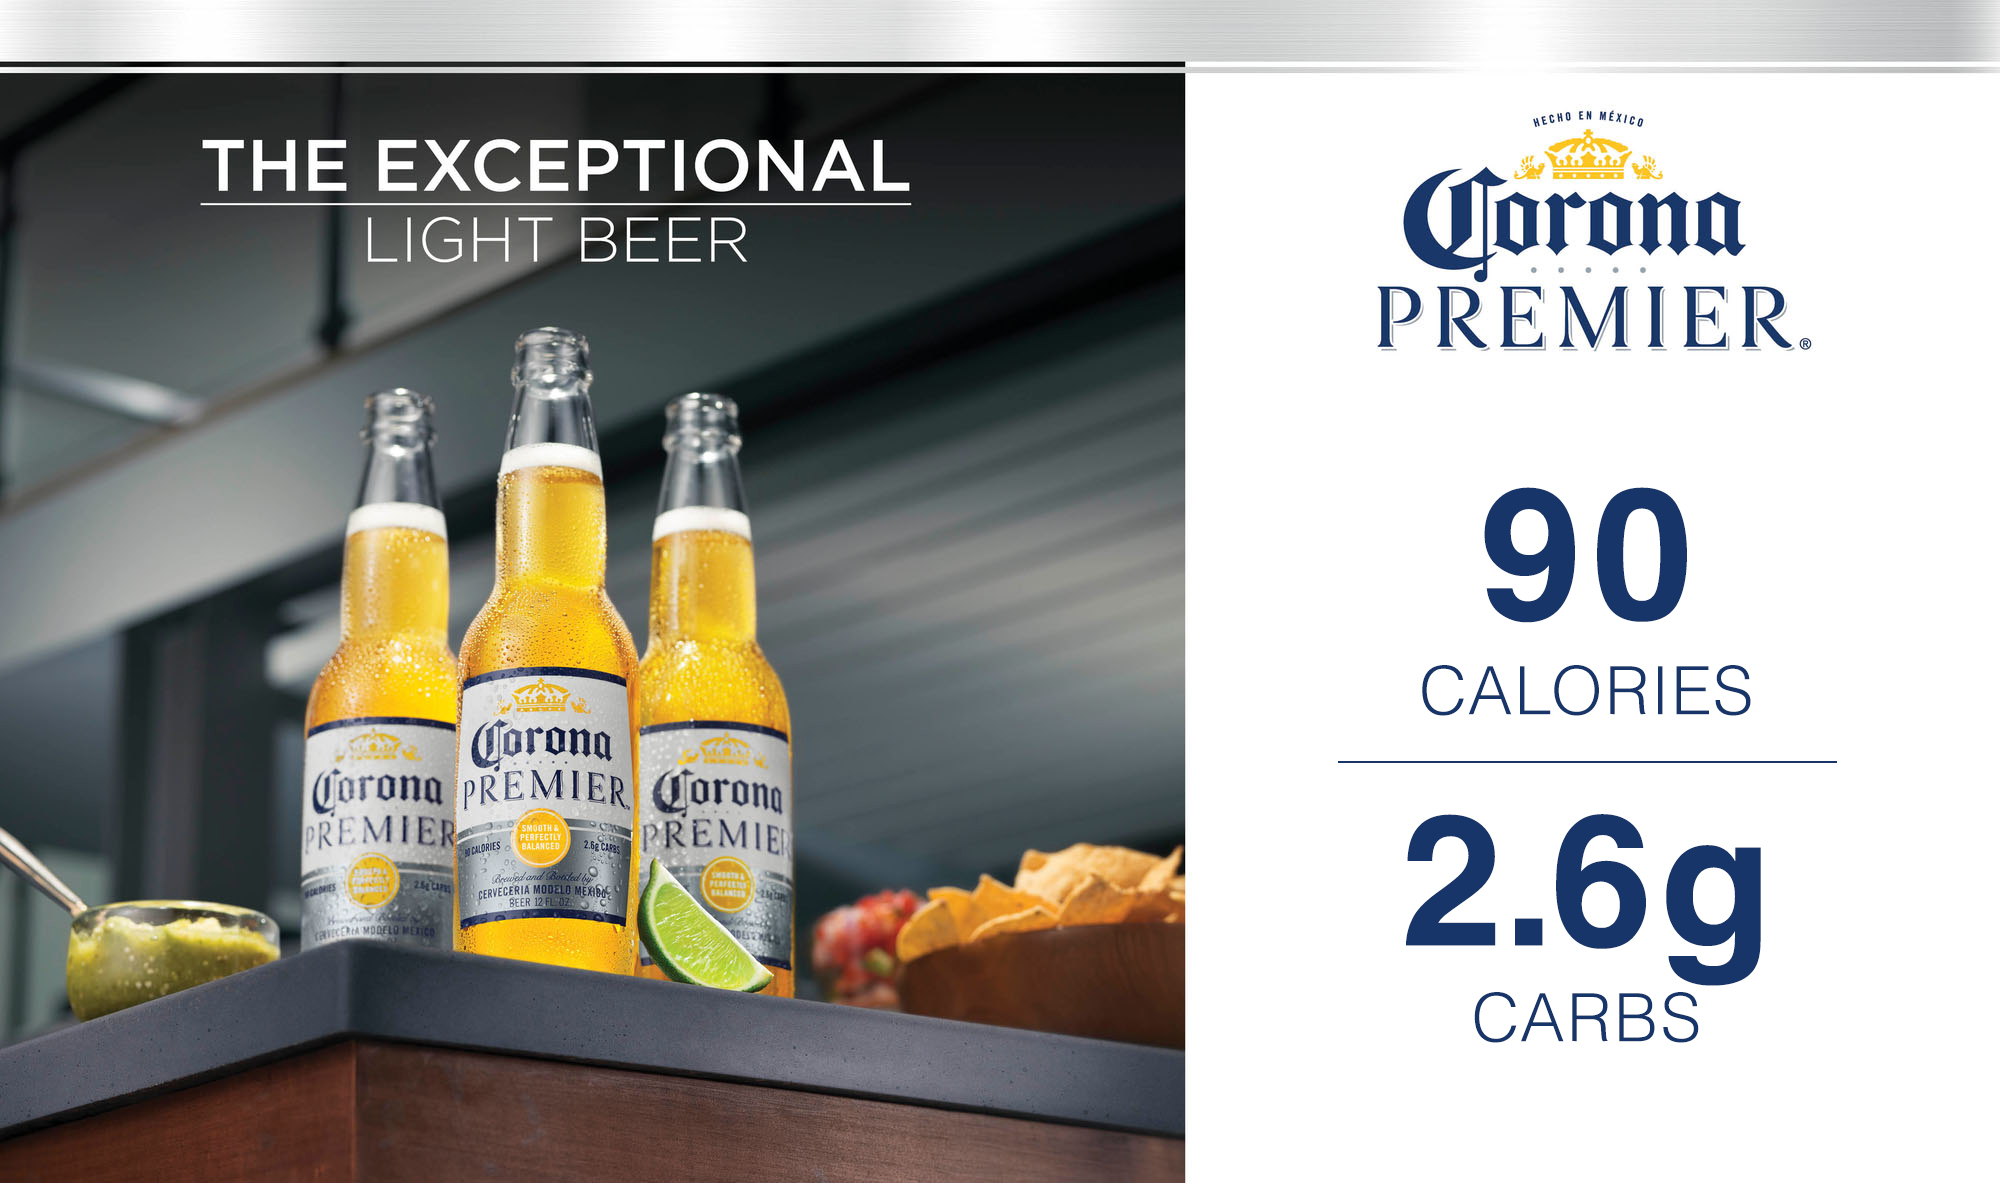
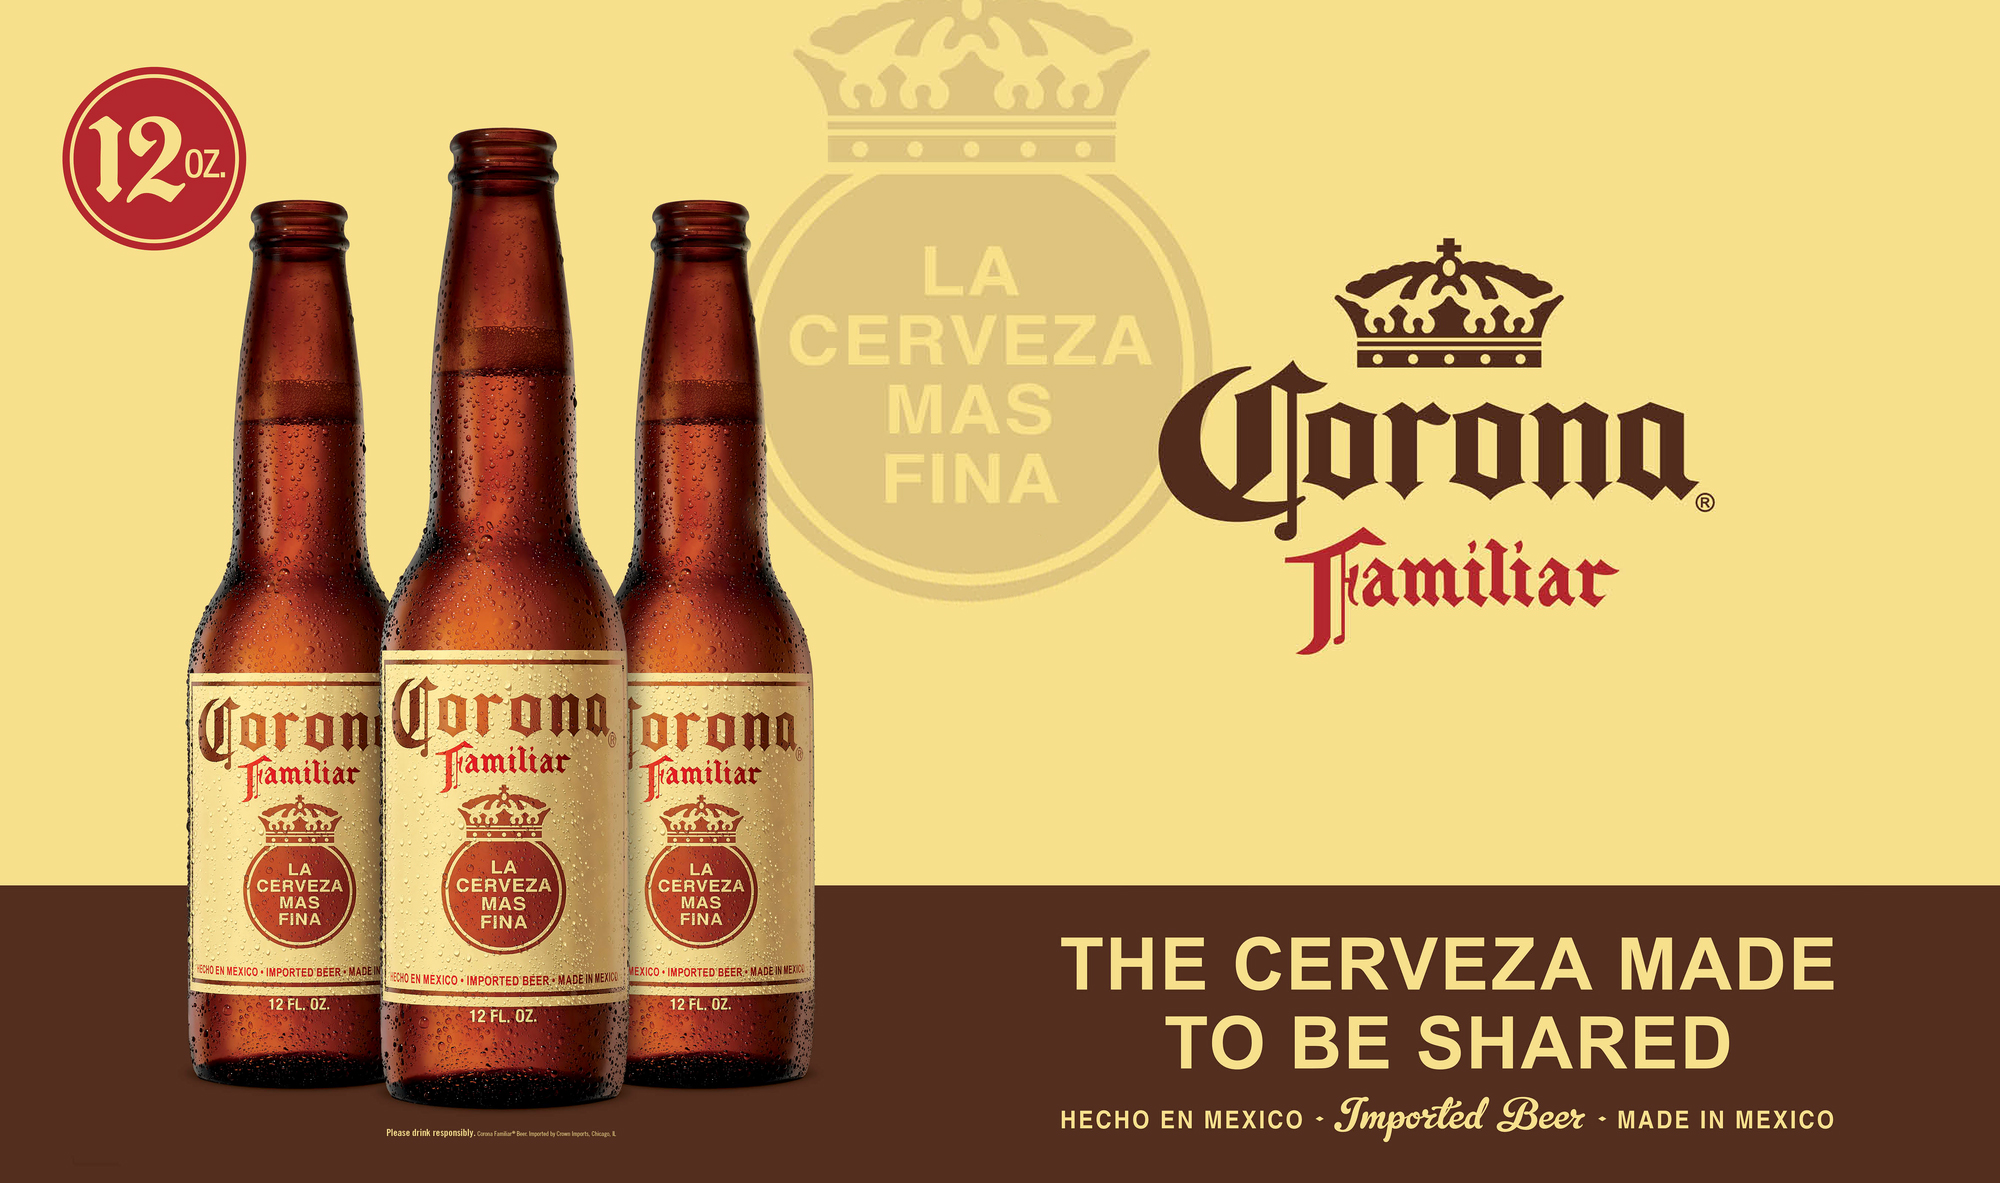
New Corona Premier and Familiar Roll-outs Drive Strong Beer Depletion Growth of 9%
Net Sales |
Operating Income |
Earnings Before Interest & Taxes (EBIT) |
Diluted Net Income Per Share Attributable to CBI (EPS) |
|
First Quarter Fiscal Year 2019 Financial Highlights (1) | In millions, except per share data
| ||||
Reported |
$2,047 |
$625 |
NA |
$3.77 |
% Change |
6% |
11% |
NA |
90% |
Comparable |
$2,047 |
$638 |
$642 |
$2.20 |
% Change |
6% |
(4%) |
(3%) |
(5%) |
Effective March 1, 2018, the company adopted the FASB amended guidance regarding the recognition of revenue from contracts with customers using the retrospective application method. Accordingly, financial information for prior interim and annual periods presented herein has been adjusted to reflect the adoption of this amended guidance.
(1) Definitions of reported and comparable, as well as reconciliations of non-GAAP financial measures, are contained elsewhere in this news release. | NA=Not Applicable
HIGHLIGHTS
• |
Achieves reported basis EPS of $3.77 and comparable basis EPS of $2.20, an increase of 90% and a decrease of 5%, respectively
|
• |
Generates $504 million of operating cash flow and $336 million of free cash flow, an increase of 32% and 104% respectively
|
• |
Increases fiscal 2019 reported basis EPS outlook to $10.93 - $11.23 and affirms comparable basis EPS outlook at $9.40 - $9.70
|
• |
Affirms fiscal 2019 operating cash flow target of approximately $2.45 billion and free cash flow projection of $1.2 - $1.3 billion
|
• |
Recognizes $258 million unrealized gain and $101 million realized gain in reported basis results for increase in fair value of the investments in Canopy Growth Corporation and sale of the Accolade Wine Investment, respectively |
 |
“Our first quarter results are consistent with our expectations for the business and reflect planned investments in innovation for key brands, digital enablement, emerging opportunities, and operational efficiencies. We expect these investments to yield excellent returns well into the future. I am especially pleased with the successful execution and momentum of our new product introductions, including Corona Premier and Familiar, which drove industry-leading depletion growth of 9% for our beer business for the quarter.”
|
|
Rob Sands | ||
Chief Executive Officer | ||
• |
Repurchases 451,000 shares of common stock for $100 million during the quarter
|
• |
Declares quarterly cash dividend |
The Corona Premier and Corona Familiar product launches are off to a strong start, exceeding company expectations as the first 2 major Corona innovations in over 25 years.
 |
 |
1

beer | ||||
Shipment Volume |
Depletion Volume |
Net Sales |
Operating Income |
|
Three Months Ended | In millions; branded product, 24-pack, 12-ounce case equivalents | ||||
May 31, 2018 |
77.9 |
$1,375.1 |
$520.0 |
|
May 31, 2017 |
71.7 |
$1,239.2 |
$497.5 |
|
% Change |
8.6% |
8.9% |
11.0% |
4.5% |
HIGHLIGHTS
• |
The Modelo and Corona brand families drove strong portfolio performance and market share gains with depletion growth of approximately 9%.
|
• |
Operating margin decreased 230 basis points to 37.8% as a benefit from favorable pricing was more than offset by planned marketing investments, higher transportation costs and unfavorable foreign currency; margin targets remain intact. |
• |
Marketing as a percent of net sales increased 110 basis points to 11% primarily due to upfront marketing investments for the Corona Premier and Corona Familiar introductions. The company continues to target fiscal 2019 marketing as a percent of net sales in the range of 9.5% - 10%.
|
|
● The beer business continues to target high-single digit volume growth and 9% - 11% net sales and operating income growth for fiscal 2019.
|
||
● The beer business won the Cinco de Mayo and Memorial Day holidays with leading market share gains in the U.S. beer market. Modelo Especial, Corona Premier and Corona Familiar were “top 5” share gainers in the market for the first quarter.
|
 |
|
wine and spirits | ||||
Shipment Volume |
Depletion Volume |
Net Sales |
Operating Income |
|
Three Months Ended | In millions; branded product, 9-liter case equivalents | ||||
May 31, 2018 |
13.5 |
$672.0 |
$167.8 |
|
May 31, 2017 |
13.9 |
$689.3 |
$201.7 |
|
% Change |
(2.9%) |
(3.6%) |
(2.5%) |
(16.8%) |
HIGHLIGHTS
• |
The wine business gained IRI market share in the first quarter, as marketing investments are paying off and driving strong marketplace performance of higher-priced Focus Brands, including Meiomi and Kim Crawford. Overall depletion performance was muted following strong fourth quarter fiscal 2018 results.
|
• |
Net sales were impacted by the overlap of strong shipment volume in first quarter fiscal 2018 driven by replenishment of Meiomi supply, which was constrained coming out of fourth quarter fiscal 2017.
|
• |
The wine and spirits business continues to target net sales and operating income growth in the 2% - 4% range for fiscal 2019.
|
|
“We remain committed to achieving our guidance targets for the year, as the growth prospects for our business remain solid. The strong operating cash flow we delivered in the first quarter enabled flexibility for venture and growth investments, as well as continued share repurchases and debt repayment.”
|
 |
David Klein | |
|
Executive Vice President
and Chief Financial Officer
| |
● Wine and spirits EBIT declined 15% as expected. Operating margin decreased 430 basis points to 25.0%, reflecting higher COGS driven primarily by increased grape and transportation costs, along with marketing investments for key focus brands and innovation initiatives.
| ||
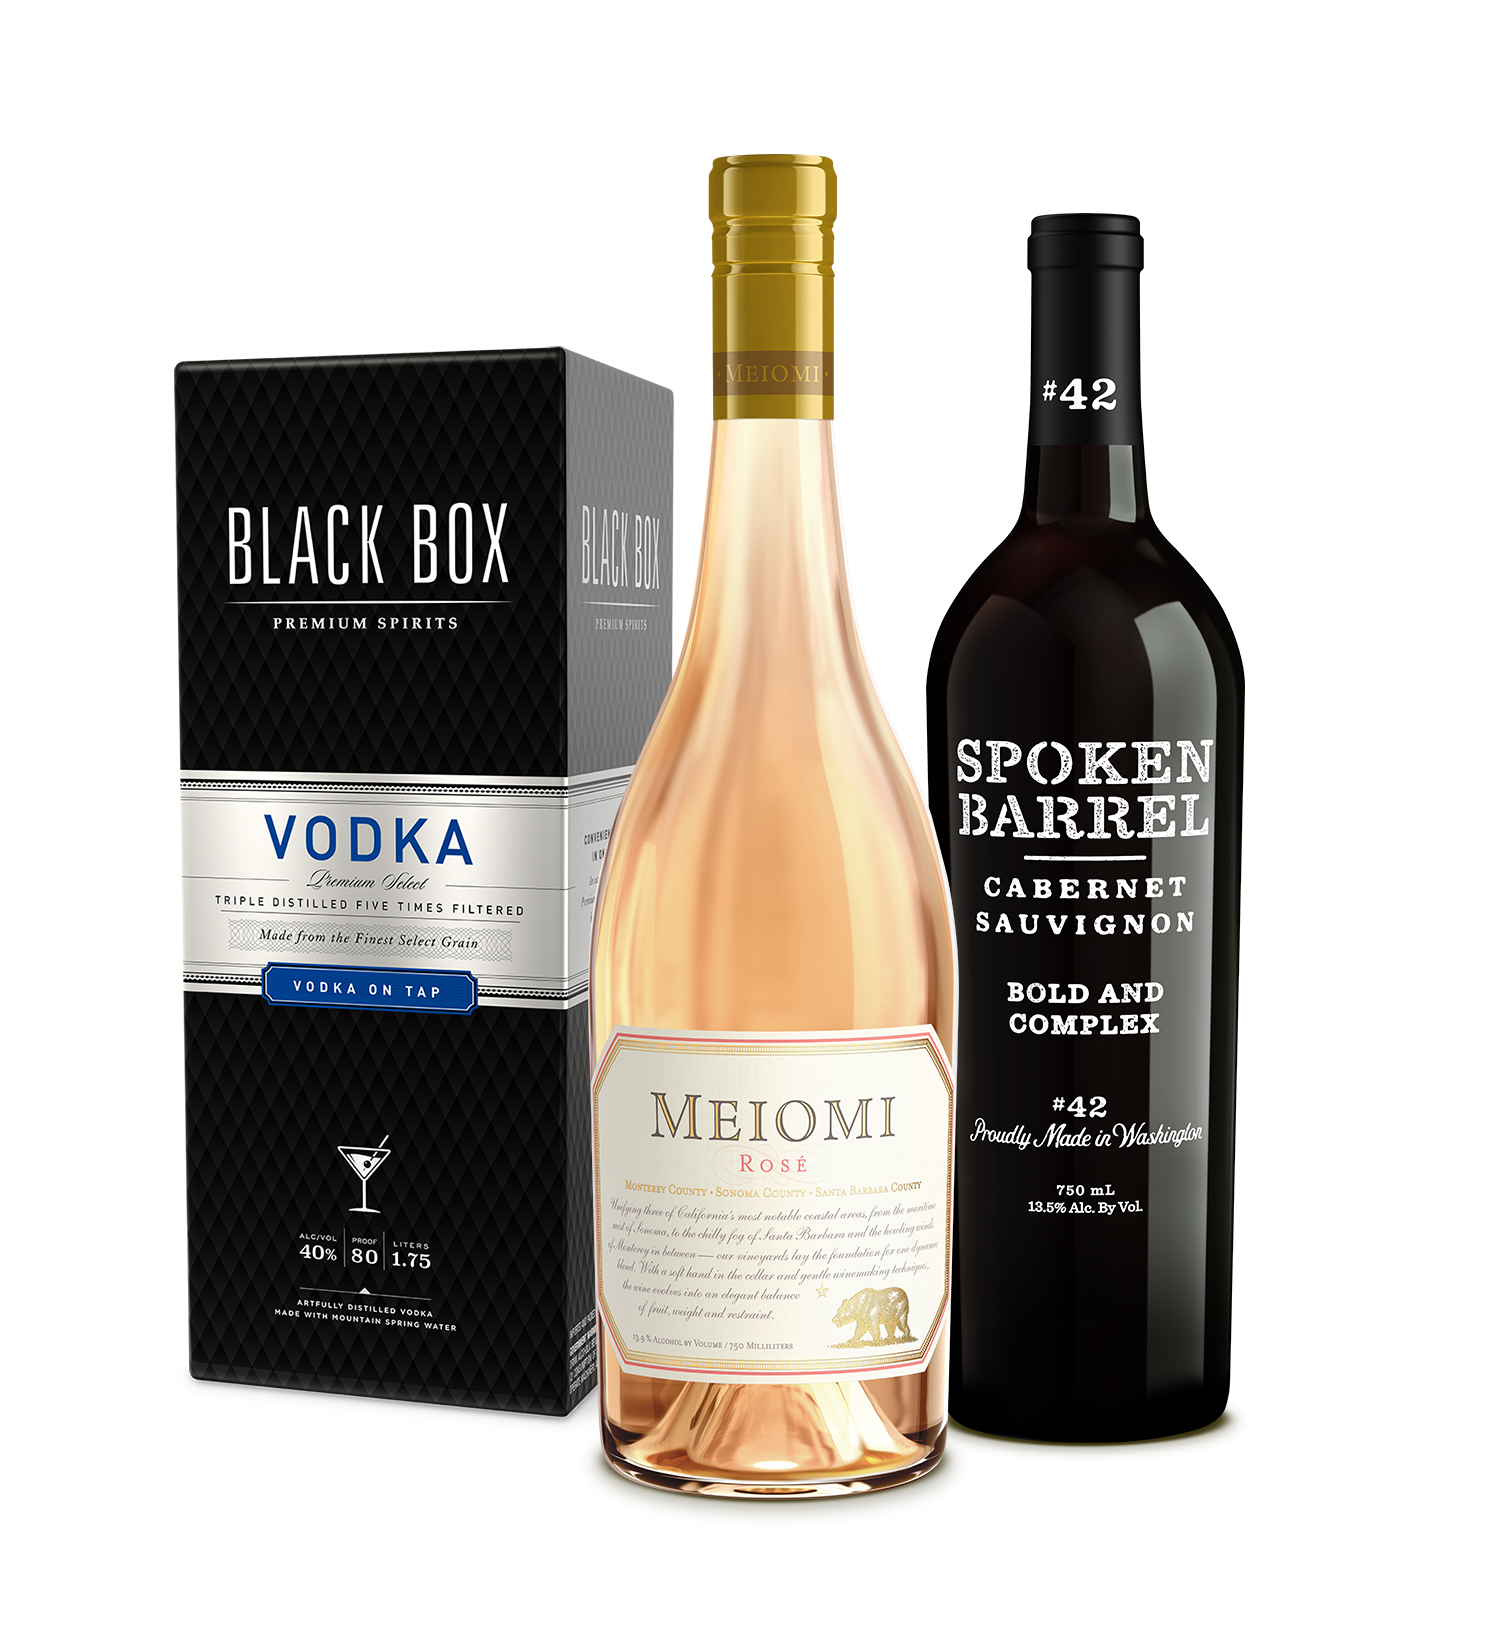 |
● The wine and spirits innovation pipeline is strong and gaining traction with brands like Black Box Spirits, Spoken Barrel and Robert Mondavi Private Selection Rum Barrel-Aged Merlot. The new additions to the Rosé portfolio, including Band of Roses, Kim Crawford and Meiomi, are contributing to growth in the business.
|
|
|
AWARDS + RECOGNITION
|
 |
|
|
Based on its impressive 18 wine category Growth Brands winners, Constellation was named “Wine Supplier of the Year” for the second consecutive year by Beverage Dynamics.
|
||
2
QUARTERLY DIVIDEND
On June 28, 2018, Constellation’s board of directors declared a quarterly cash dividend of $0.74 per share of Class A Common Stock and $0.67 per share of Class B Common Stock, payable on August 24, 2018, to stockholders of record as of the close of business on August 10, 2018.

† A copy of this news release, including the attachments and other financial information that may be discussed during the call, will be available on our website cbrands.com under “Investors/Reporting” prior to the call.
|
OUTLOOK
The table below sets forth management’s current EPS expectations for fiscal 2019 compared to fiscal 2018 actual results, both on a reported basis and a comparable basis.
| |||||||||||
Reported Basis |
Comparable Basis |
||||||||||
FY19 Estimate |
FY18 Actual |
FY19 Estimate |
FY18 Actual |
||||||||
Fiscal Year Ending February 28 |
$10.93 - $11.23 |
$11.47 |
$9.40 - $9.70 |
$8.70 |
|||||||
|
For fiscal 2019, the beer business is targeting net sales and operating income growth to be in the range of 9 - 11 percent. For the wine and spirits business, the company expects net sales and operating income growth to be in the range of 2 - 4 percent.
Fiscal 2019 guidance also includes the following current assumptions:
| |||||||||||
|
● Interest expense: $355 - $365 million
● Tax rate: approximately 19 percent
● Weighted average diluted shares outstanding: approximately 197 million; assumes no additional share repurchases for fiscal 2019
|
● Operating cash flow: $2.35 - $2.55 billion
● Capital expenditures: $1.15 - $1.25 billion, including approximately $900 million targeted for Mexico beer operations expansion activities
● Free cash flow: $1.2 - $1.3 billion
|
||||||||||
|
ABOUT CONSTELLATION BRANDS
Constellation Brands (NYSE: STZ and STZ.B), a Fortune 500® company, is a leading international producer and marketer of beer, wine and spirits with operations in the U.S., Mexico, New Zealand, Italy and Canada. Constellation is the No. 3 beer company in the U.S. with high-end, iconic imported brands such as Corona Extra, Corona Light, Modelo Especial, Modelo Negra and Pacifico. The company’s beer portfolio also includes Ballast Point, one of the most awarded craft brewers in the U.S., and Funky Buddha Brewery. In addition, Constellation is the world leader in premium wine, selling great brands that people love, including Robert Mondavi, Clos du Bois, Kim Crawford, Meiomi, Mark West, Black Box, Ruffino and The Prisoner. The company’s premium spirits brands include SVEDKA Vodka, Casa Noble Tequila and High West Whiskey.
Based in Victor, N.Y., the company believes that industry leadership involves a commitment to brand building, our trade partners, the environment, our investors and to consumers around the world who choose our products when celebrating big moments or enjoying quiet ones. Founded in 1945, Constellation has grown to become a significant player in the beverage alcohol industry with more than 100 brands in its portfolio; about 40 wineries, breweries and distilleries; and approximately 10,000 talented employees. We express our company vision: to elevate life with every glass raised.
To learn more, follow us on Twitter @cbrands and visit www.cbrands.com.
|
MEDIA CONTACTS |
INVESTOR RELATIONS CONTACTS |
Mike McGrew 773-251-4934 | Amy Martin 585-678-7141
|
Patty Yahn-Urlaub 585-678-7483 | Bob Czudak 585-678-7170
|
3
SUPPLEMENTAL INFORMATION
Reported basis (“reported”) are amounts as reported under generally accepted accounting principles. Comparable basis (“comparable”) are amounts which exclude items that affect comparability (“comparable adjustments”), as they are not reflective of core operations of the segments. The company’s measure of segment profitability excludes comparable adjustments, which is consistent with the measure used by management to evaluate results. The company discusses various non-GAAP measures in this news release. Financial statements, as well as supplemental schedules and tables reconciling non-GAAP measures, together with definitions of these measures and the reasons management uses these measures, are included in this news release.
FORWARD-LOOKING STATEMENTS
The statements made under the heading Outlook, and all statements other than statements of historical fact set forth in this news release regarding Constellation Brands’ business strategy, future operations, future financial position, expected effective tax rates and anticipated tax liabilities, estimated revenues, projected costs, estimated diluted EPS, expected cash flow, prospects, plans and objectives of management, manner and timing of share repurchases pursuant to the share repurchase authorization, as well as information concerning expected actions of third parties, are forward-looking statements (collectively, the “Projections”) that involve risks and uncertainties that could cause actual results to differ materially from those set forth in or implied by the Projections.
During the current quarter, Constellation Brands may reiterate the Projections. Prior to the start of the company’s quiet period, which will begin at the close of business on August 31, 2018, the public can continue to rely on the Projections as still being Constellation Brands’ current expectations on the matters covered, unless the company publishes a notice stating otherwise. During Constellation Brands’ “quiet period,” the Projections should not be considered to constitute the company’s expectations and should be considered historical, speaking as of prior to the quiet period only and not subject to update by the company.
The Projections are based on management’s current expectations and, unless otherwise noted, do not take into account the impact of any future acquisition, merger or any other business combination, divestiture, restructuring or other strategic business realignments, financing or share repurchase that may be completed after the date of this release. The Projections should not be construed in any manner as a guarantee that such results will in fact occur.
In addition to the risks and uncertainties of ordinary business operations, the Projections of the company contained in this news release are subject to a number of risks and uncertainties, including:
• |
beer operations expansion, construction and optimization activities, and costs and timing associated with these activities, may vary from management’s current estimates; |
• |
accuracy of supply projections, including those relating to beer operations expansion activities and glass sourcing; |
• |
operating cash flow, free cash flow, effective tax rate and capital expenditures to support long-term growth may vary from management’s current estimates; |
• |
accuracy of projections associated with market opportunities and with previously announced acquisitions, investments, and divestitures; |
• |
exact duration of the share repurchase implementation and the amount, timing, and source of funds for any share repurchases; |
• |
raw material and water supply, production or shipment difficulties could adversely affect the company’s ability to supply its customers; |
• |
general economic, geo-political, domestic, international and regulatory conditions, instability in world financial markets, |
unanticipated environmental liabilities and costs, or enhanced competitive activities;
• |
changes to international trade agreements and tariffs, accounting standards, elections or assertions, tax laws or other governmental rules and regulations, and other factors which could impact the company’s reported financial position, results of operations or effective tax rate, and accuracy of any associated projections; |
• |
changes in interest rates and the inherent unpredictability of currency fluctuations, commodity prices and raw material costs; and |
• |
other factors and uncertainties disclosed in the company’s filings with the Securities and Exchange Commission, including its Annual Report on Form 10-K for the fiscal year ended February 28, 2018, which could cause actual future performance to differ from current expectations. |
4
|
Constellation Brands, Inc. and Subsidiaries
CONDENSED CONSOLIDATED BALANCE SHEETS
(in millions)
(unaudited)
| |||||||
May 31, 2018 |
February 28, 2018 |
||||||
Assets |
|||||||
Current assets: |
|||||||
Cash and cash equivalents |
$ |
210.0 |
$ |
90.3 |
|||
Accounts receivable |
827.9 |
776.2 |
|||||
Inventories |
2,068.4 |
2,084.0 |
|||||
Prepaid expenses and other |
498.5 |
523.5 |
|||||
Total current assets |
3,604.8 |
3,474.0 |
|||||
Property, plant and equipment |
4,815.8 |
4,789.7 |
|||||
Goodwill |
8,050.5 |
8,083.1 |
|||||
Intangible assets |
3,301.6 |
3,304.8 |
|||||
Other assets |
3,324.0 |
887.1 |
|||||
Total assets |
$ |
23,096.7 |
$ |
20,538.7 |
|||
Liabilities and stockholders’ equity |
|||||||
Current liabilities: |
|||||||
Short-term borrowings |
$ |
669.7 |
$ |
746.8 |
|||
Current maturities of long-term debt |
20.9 |
22.3 |
|||||
Accounts payable |
650.3 |
592.2 |
|||||
Other accrued expenses and liabilities |
649.6 |
678.3 |
|||||
Total current liabilities |
1,990.5 |
2,039.6 |
|||||
Long-term debt, less current maturities |
9,416.4 |
9,417.6 |
|||||
Other liabilities |
1,124.0 |
1,089.8 |
|||||
Total liabilities |
12,530.9 |
12,547.0 |
|||||
CBI stockholders’ equity |
10,556.4 |
7,975.1 |
|||||
Noncontrolling interests |
9.4 |
16.6 |
|||||
Total stockholders’ equity |
10,565.8 |
7,991.7 |
|||||
Total liabilities and stockholders’ equity |
$ |
23,096.7 |
$ |
20,538.7 |
|||
5
|
Constellation Brands, Inc. and Subsidiaries
CONSOLIDATED STATEMENTS OF OPERATIONS
(in millions, except per share data)
(unaudited)
| |||||||
Three Months Ended |
|||||||
May 31, 2018 |
May 31, 2017 |
||||||
Sales |
$ |
2,230.0 |
$ |
2,108.3 |
|||
Excise taxes |
(182.9 |
) |
(179.8 |
) |
|||
Net sales |
2,047.1 |
1,928.5 |
|||||
Cost of product sold |
(998.5 |
) |
(940.2 |
) |
|||
Gross profit |
1,048.6 |
988.3 |
|||||
Selling, general and administrative expenses |
(423.2 |
) |
(427.2 |
) |
|||
Operating income |
625.4 |
561.1 |
|||||
Income from unconsolidated investments |
364.4 |
0.4 |
|||||
Interest expense |
(87.8 |
) |
(82.4 |
) |
|||
Loss on extinguishment of debt |
— |
(6.7 |
) |
||||
Income before income taxes |
902.0 |
472.4 |
|||||
Provision for income taxes |
(155.7 |
) |
(71.4 |
) |
|||
Net income |
746.3 |
401.0 |
|||||
Net income attributable to noncontrolling interests |
(2.5 |
) |
(2.5 |
) |
|||
Net income attributable to CBI |
$ |
743.8 |
$ |
398.5 |
|||
Net income per common share attributable to CBI: |
|||||||
Basic – Class A Common Stock |
$ |
3.93 |
$ |
2.07 |
|||
Basic – Class B Convertible Common Stock |
$ |
3.57 |
$ |
1.88 |
|||
Diluted – Class A Common Stock |
$ |
3.77 |
$ |
1.98 |
|||
Diluted – Class B Convertible Common Stock |
$ |
3.48 |
$ |
1.83 |
|||
Weighted average common shares outstanding: |
|||||||
Basic – Class A Common Stock |
168.063 |
171.555 |
|||||
Basic – Class B Convertible Common Stock |
23.326 |
23.344 |
|||||
Diluted – Class A Common Stock |
197.060 |
201.030 |
|||||
Diluted – Class B Convertible Common Stock |
23.326 |
23.344 |
|||||
Cash dividends declared per common share: |
|||||||
Class A Common Stock |
$ |
0.74 |
$ |
0.52 |
|||
Class B Convertible Common Stock |
$ |
0.67 |
$ |
0.47 |
|||
6
|
Constellation Brands, Inc. and Subsidiaries
CONSOLIDATED STATEMENTS OF CASH FLOWS
(in millions)
(unaudited)
| |||||||
Three Months Ended |
|||||||
May 31, 2018 |
May 31, 2017 |
||||||
Cash flows from operating activities |
|||||||
Net income |
$ |
746.3 |
$ |
401.0 |
|||
Adjustments to reconcile net income to net cash provided by operating activities: |
|||||||
Unrealized gain on equity securities |
(258.3 |
) |
— |
||||
Gain on sale of unconsolidated investment |
(101.4 |
) |
— |
||||
Deferred tax provision (benefit) |
116.2 |
(11.2 |
) |
||||
Depreciation |
84.2 |
70.1 |
|||||
Stock-based compensation |
17.3 |
15.1 |
|||||
Loss on extinguishment of debt and amortization of debt issuance costs |
3.0 |
9.8 |
|||||
Impairment and amortization of intangible assets |
1.5 |
88.2 |
|||||
Change in operating assets and liabilities: |
|||||||
Accounts receivable |
(49.3 |
) |
(96.8 |
) |
|||
Inventories |
10.6 |
18.4 |
|||||
Prepaid expenses and other current assets |
(54.1 |
) |
(36.0 |
) |
|||
Accounts payable |
14.9 |
(13.6 |
) |
||||
Deferred revenue |
47.3 |
42.4 |
|||||
Other accrued expenses and liabilities |
(77.7 |
) |
(123.7 |
) |
|||
Other |
3.5 |
17.9 |
|||||
Total adjustments |
(242.3 |
) |
(19.4 |
) |
|||
Net cash provided by operating activities |
504.0 |
381.6 |
|||||
Cash flows from investing activities |
|||||||
Purchases of property, plant and equipment |
(168.2 |
) |
(217.1 |
) |
|||
Proceeds from sale of unconsolidated investment |
110.2 |
— |
|||||
Other investing activities |
4.5 |
(4.2 |
) |
||||
Net cash used in investing activities |
(53.5 |
) |
(221.3 |
) |
|||
Cash flows from financing activities |
|||||||
Dividends paid |
(140.5 |
) |
(100.5 |
) |
|||
Purchases of treasury stock |
(100.0 |
) |
— |
||||
Net proceeds from (repayments of) short-term borrowings |
(77.5 |
) |
381.3 |
||||
Payments of minimum tax withholdings on stock-based payment awards |
(12.9 |
) |
(22.3 |
) |
|||
Principal payments of long-term debt |
(5.9 |
) |
(1,913.4 |
) |
|||
Proceeds from shares issued under equity compensation plans |
7.6 |
16.6 |
|||||
Payments of debt issuance costs |
— |
(11.8 |
) |
||||
Proceeds from issuance of long-term debt |
— |
1,508.5 |
|||||
Net cash used in financing activities |
(329.2 |
) |
(141.6 |
) |
|||
Effect of exchange rate changes on cash and cash equivalents |
(1.6 |
) |
3.0 |
||||
Net increase in cash and cash equivalents |
119.7 |
21.7 |
|||||
Cash and cash equivalents, beginning of period |
90.3 |
177.4 |
|||||
Cash and cash equivalents, end of period |
$ |
210.0 |
$ |
199.1 |
|||
7
|
Constellation Brands, Inc. and Subsidiaries
SUMMARIZED SEGMENT AND INCOME FROM UNCONSOLIDATED INVESTMENTS INFORMATION
(in millions)
(unaudited)
| ||||||||||
Three Months Ended |
||||||||||
May 31, 2018 |
May 31, 2017 |
Percent
Change
|
||||||||
Beer |
||||||||||
Segment net sales |
$ |
1,375.1 |
$ |
1,239.2 |
11 |
% |
||||
Segment gross profit |
$ |
749.4 |
$ |
680.5 |
10 |
% |
||||
% Net sales |
54.5 |
% |
54.9 |
% |
||||||
Segment operating income |
$ |
520.0 |
$ |
497.5 |
5 |
% |
||||
% Net sales |
37.8 |
% |
40.1 |
% |
||||||
Wine and Spirits |
||||||||||
Wine net sales |
$ |
591.8 |
$ |
602.1 |
(2 |
%) |
||||
Spirits net sales |
80.2 |
87.2 |
(8 |
%) |
||||||
Segment net sales |
$ |
672.0 |
$ |
689.3 |
(3 |
%) |
||||
Segment gross profit |
$ |
290.8 |
$ |
315.5 |
(8 |
%) |
||||
% Net sales |
43.3 |
% |
45.8 |
% |
||||||
Segment operating income |
$ |
167.8 |
$ |
201.7 |
(17 |
%) |
||||
% Net sales |
25.0 |
% |
29.3 |
% |
||||||
Segment income from unconsolidated investments |
$ |
4.8 |
$ |
0.2 |
NM |
|||||
Corporate Operations and Other |
||||||||||
Segment operating loss |
$ |
(50.2 |
) |
$ |
(37.4 |
) |
34 |
% |
||
Segment income (loss) from unconsolidated investments |
$ |
(0.1 |
) |
$ |
0.2 |
NM |
||||
Consolidated operating income |
$ |
625.4 |
$ |
561.1 |
||||||
Comparable Adjustments |
12.2 |
100.7 |
||||||||
Comparable operating income |
$ |
637.6 |
$ |
661.8 |
||||||
Consolidated income from unconsolidated investments |
$ |
364.4 |
$ |
0.4 |
||||||
Comparable Adjustments |
(359.7 |
) |
— |
|||||||
Comparable income from unconsolidated investments |
$ |
4.7 |
$ |
0.4 |
||||||
Consolidated EBIT |
$ |
642.3 |
$ |
662.2 |
||||||
NM=Not Meaningful
8
Constellation Brands, Inc. and Subsidiaries
SUPPLEMENTAL SHIPMENT AND DEPLETION INFORMATION
(unaudited)
Three Months Ended |
||||||||
May 31, 2018 |
May 31, 2017 |
Percent
Change
|
||||||
Beer |
||||||||
(in millions, branded product, 24-pack, 12-ounce case equivalents) |
||||||||
Shipment volume |
77.9 |
71.7 |
8.6 |
% |
||||
Depletion volume (1)
|
8.9 |
% |
||||||
Wine and Spirits |
||||||||
(in millions, branded product, 9-liter case equivalents) |
||||||||
Shipment volume |
13.5 |
13.9 |
(2.9 |
%) |
||||
U.S. Domestic shipment volume |
12.5 |
12.9 |
(3.1 |
%) |
||||
U.S. Domestic Focus Brands shipment volume (2)
|
7.8 |
7.7 |
1.3 |
% |
||||
U.S. Domestic depletion volume (1)
|
(3.6 |
%) |
||||||
U.S. Domestic Focus Brands depletion volume (1) (2)
|
0.4 |
% |
||||||
(1) |
Depletions represent distributor shipments of our respective branded products to retail customers, based on third-party data. |
(2) |
U.S. Domestic Focus Brands include the following brands and/or portfolios of brands: 7 Moons, Black Box, Casa Noble, Clos du Bois, Franciscan, High West, Kim Crawford, Mark West, Meiomi, Mount Veeder, Nobilo, Ravage, Robert Mondavi, Ruffino, Schrader, Simi, SVEDKA Vodka, The Dreaming Tree and the Charles Smith and Prisoner portfolios of brands. |
9
Constellation Brands, Inc. and Subsidiaries
RECONCILIATIONS OF GAAP TO NON-GAAP FINANCIAL MEASURES
(in millions, except per share data)
(unaudited)
We report our financial results in accordance with generally accepted accounting principles in the U.S. (“GAAP”). However, non-GAAP financial measures, as defined in the reconciliation tables below, are provided because we use this information in evaluating the results of our core operations and/or internal goal setting. In addition, we believe this information provides investors valuable insight on underlying business trends and results in order to evaluate year-over-year financial performance. See the tables below for supplemental financial data and corresponding reconciliations of these non-GAAP financial measures to GAAP financial measures for the periods presented. Non-GAAP financial measures should be viewed in addition to, and not as an alternative for, our reported results prepared in accordance with GAAP. Please refer to our website at http://www.cbrands.com/investors/reporting for a more detailed description and further discussion of these non-GAAP financial measures.
Three Months Ended May 31, 2018 |
Three Months Ended May 31, 2017 |
Percent
Change -
Reported
Basis
(GAAP)
|
Percent
Change -
Comparable
Basis
(Non-GAAP)
|
||||||||||||||||||||||
|
Reported
Basis
(GAAP)
|
Comparable
Adjustments
|
Comparable
Basis
(Non-GAAP)
|
Reported
Basis
(GAAP)
|
Comparable
Adjustments
|
Comparable
Basis
(Non-GAAP)
|
||||||||||||||||||||
Net sales |
$ |
2,047.1 |
$ |
2,047.1 |
$ |
1,928.5 |
$ |
1,928.5 |
6 |
% |
6 |
% |
|||||||||||||
Cost of product sold |
(998.5 |
) |
$ |
(8.4 |
) |
(940.2 |
) |
$ |
7.7 |
||||||||||||||||
Gross profit |
1,048.6 |
(8.4 |
) |
$ |
1,040.2 |
988.3 |
7.7 |
$ |
996.0 |
6 |
% |
4 |
% |
||||||||||||
Selling, general and administrative expenses |
(423.2 |
) |
20.6 |
(427.2 |
) |
93.0 |
|||||||||||||||||||
Operating income |
625.4 |
12.2 |
$ |
637.6 |
561.1 |
100.7 |
$ |
661.8 |
11 |
% |
(4 |
%) |
|||||||||||||
Income from unconsolidated investments |
364.4 |
(359.7 |
) |
0.4 |
|||||||||||||||||||||
EBIT |
$ |
642.3 |
$ |
662.2 |
NA |
(3 |
%) |
||||||||||||||||||
Interest expense |
(87.8 |
) |
(82.4 |
) |
|||||||||||||||||||||
Loss on extinguishment of debt |
— |
(6.7 |
) |
6.7 |
|||||||||||||||||||||
Income before income taxes |
902.0 |
(347.5 |
) |
$ |
554.5 |
472.4 |
107.4 |
$ |
579.8 |
91 |
% |
(4 |
%) |
||||||||||||
Provision for income taxes (1)
|
(155.7 |
) |
37.0 |
(71.4 |
) |
(39.7 |
) |
||||||||||||||||||
Net income |
746.3 |
(310.5 |
) |
401.0 |
67.7 |
||||||||||||||||||||
Net income attributable to noncontrolling interests |
(2.5 |
) |
(2.5 |
) |
|||||||||||||||||||||
Net income attributable to CBI |
$ |
743.8 |
$ |
(310.5 |
) |
$ |
433.3 |
$ |
398.5 |
$ |
67.7 |
$ |
466.2 |
87 |
% |
(7 |
%) |
||||||||
EPS (2)
|
$ |
3.77 |
$ |
(1.58 |
) |
$ |
2.20 |
$ |
1.98 |
$ |
0.34 |
$ |
2.32 |
90 |
% |
(5 |
%) |
||||||||
Weighted average common shares outstanding – diluted |
197.060 |
197.060 |
201.030 |
201.030 |
|||||||||||||||||||||
Gross margin |
51.2 |
% |
50.8 |
% |
51.2 |
% |
51.6 |
% |
|||||||||||||||||
Operating margin |
30.6 |
% |
31.1 |
% |
29.1 |
% |
34.3 |
% |
|||||||||||||||||
Effective tax rate |
17.3 |
% |
21.4 |
% |
15.1 |
% |
19.2 |
% |
|||||||||||||||||
10
Three Months Ended May 31, 2018 |
Three Months Ended May 31, 2017 |
||||||||||||||||||||||||
Comparable Adjustments |
Acquisitions,
Divestitures
and Related
Costs (3)
|
Restructuring
and Other Strategic Business Development Costs (4)
|
Other (5)
|
Total |
Acquisitions,
Divestitures
and Related
Costs (3)
|
Restructuring and Other Strategic Business Development Costs |
Other (5)
|
Total |
|||||||||||||||||
Cost of product sold |
$ |
(0.6 |
) |
$ |
(3.4 |
) |
$ |
12.4 |
$ |
8.4 |
$ |
(7.0 |
) |
$ |
— |
$ |
(0.7 |
) |
$ |
(7.7 |
) |
||||
Selling, general and administrative expenses |
$ |
— |
$ |
(4.3 |
) |
$ |
(16.3 |
) |
$ |
(20.6 |
) |
$ |
(4.8 |
) |
$ |
(1.4 |
) |
$ |
(86.8 |
) |
$ |
(93.0 |
) |
||
Operating loss |
$ |
(0.6 |
) |
$ |
(7.7 |
) |
$ |
(3.9 |
) |
$ |
(12.2 |
) |
$ |
(11.8 |
) |
$ |
(1.4 |
) |
$ |
(87.5 |
) |
$ |
(100.7 |
) |
|
Income from unconsolidated investments |
$ |
101.4 |
$ |
— |
$ |
258.3 |
$ |
359.7 |
$ |
— |
$ |
— |
$ |
— |
$ |
— |
|||||||||
Loss on extinguishment of debt |
$ |
— |
$ |
— |
$ |
— |
$ |
— |
$ |
— |
$ |
— |
$ |
(6.7 |
) |
$ |
(6.7 |
) |
|||||||
(Provision for) benefit from income taxes (1)
|
$ |
(1.7 |
) |
$ |
1.9 |
$ |
(37.2 |
) |
$ |
(37.0 |
) |
$ |
4.0 |
$ |
0.5 |
$ |
35.2 |
$ |
39.7 |
||||||
Net income (loss) attributable to CBI |
$ |
99.1 |
$ |
(5.8 |
) |
$ |
217.2 |
$ |
310.5 |
$ |
(7.8 |
) |
$ |
(0.9 |
) |
$ |
(59.0 |
) |
$ |
(67.7 |
) |
||||
EPS (2)
|
$ |
0.50 |
$ |
(0.03 |
) |
$ |
1.10 |
$ |
1.58 |
$ |
(0.04 |
) |
$ |
— |
$ |
(0.29 |
) |
$ |
(0.34 |
) |
|||||
(1) |
The effective tax rate applied to each Comparable Adjustment amount is generally based upon the jurisdiction in which the Comparable Adjustment was recognized. |
(2) |
May not sum due to rounding as each item is computed independently. |
(3) |
For the three months ended May 31, 2018, acquisitions, divestitures and related costs consist primarily of a net gain recognized in connection with the sale of our remaining interest in our previously-owned Australian and European business (the “Accolade Wine Investment”). For the three months ended May 31, 2017, acquisitions, divestitures and related costs consist of (i) transaction, integration and other acquisition-related costs recognized primarily in connection with the acquisitions of Prisoner and Obregon, and (ii) costs recognized in connection with the sale of our Canadian wine business and related activities.
|
(4) |
For the three months ended May 31, 2018, restructuring and other strategic business development costs consist primarily of costs recognized in connection with the development of a program specifically intended to identify opportunities for further streamlining of processes and improving capabilities, linking strategy with execution, prioritizing resources and enabling an integrated digital platform.
|
(5) |
For the three months ended May 31, 2018, other consists primarily of an unrealized gain from the mark to fair value of our investments in Canopy Growth Corporation and a net gain from the mark to fair value of undesignated commodity derivative contracts, partially offset by a prior period adjustment for deferred compensation related to certain employment agreements. For the three months ended May 31, 2017, other consists primarily of impairment of certain intangible assets.
|
11
Constellation Brands, Inc. and Subsidiaries
RECONCILIATIONS OF GAAP TO NON-GAAP FINANCIAL MEASURES (continued)
GUIDANCE - EPS
(in millions, except per share data)
(unaudited)
EPS Guidance
|
Range for the Year
Ending February 28, 2019
|
|||||||
Forecasted EPS - reported basis (GAAP) |
$ |
10.93 |
$ |
11.23 |
|||
Acquisitions, divestitures and related costs (1)
|
(0.49 |
) |
(0.49 |
) |
|||
Restructuring and other strategic business development costs (2)
|
0.06 |
0.06 |
|||||
Other (3)
|
(1.10 |
) |
(1.10 |
) |
|||
Forecasted EPS - comparable basis (Non-GAAP) (4)
|
$ |
9.40 |
$ |
9.70 |
|||
|
Actual for the
Year Ended
February 28, 2018
|
|||
EPS - reported basis (GAAP) |
$ |
11.47 |
|
Acquisitions, divestitures and related costs (1)
|
0.10 |
||
Restructuring and other strategic business development costs (2)
|
0.05 |
||
Other (3)
|
(2.92 |
) |
|
EPS - comparable basis (Non-GAAP) (4)
|
$ |
8.70 |
|
(1) |
Includes an estimated ($0.51) EPS for the year ending February 28, 2019, associated with a net gain recognized in connection with the sale of our remaining interest in the Accolade Wine Investment, partially offset by an estimated $0.01 and $0.01 EPS for the year ending February 28, 2019, associated with other acquisition-related costs in connection with the Schrader Cellars wine acquisition and the High West acquisition, respectively. Includes $0.02, $0.02, $0.02, $0.01 and $0.01 EPS for the year ended February 28, 2018, associated primarily with transaction, integration and other acquisition-related costs in connection with the Prisoner acquisition, the Schrader Cellars wine acquisition, the investments in Canopy Growth Corporation, the October 2016 Wine and Spirits Acquisitions and the Obregon brewery acquisition, respectively, and $0.01 EPS for the year ended February 28, 2018, associated with costs in connection with the sale of our Canadian wine business and related activities. (4)
|
(2) |
Includes an estimated $0.06 EPS for the year ending February 28, 2019, and $0.05 EPS for the year ended February 28, 2018, associated primarily with costs recognized in connection with the development of a program specifically intended to identify opportunities for further streamlining of processes and improving capabilities, linking strategy with execution, prioritizing resources and enabling an integrated digital platform. (4)
|
(3) |
Includes an estimated ($1.14) and ($0.05) EPS for the year ending February 28, 2019, associated with an unrealized gain from the mark to fair value of our investments in Canopy Growth Corporation and a net gain from the mark to fair value of undesignated commodity derivative contracts, respectively; partially offset by $0.08 EPS for the the year ending February 28, 2019, associated with a prior period adjustment for deferred compensation related to certain employment agreements. For the year ending February 28, 2019, the unrealized gain from the mark to fair value of our investments in Canopy Growth Corporation and the net gain from the mark to fair value of undesignated commodity derivative contracts reflect the actual amount recognized for the three months ended May 31, 2018, and do not assume any future change in the fair value of these assets. Includes ($1.96), ($1.75), ($0.03), ($0.03) and ($0.02) EPS for the year ended February 28, 2018, associated with an unrealized gain from the mark to fair value of our investments in Canopy Growth Corporation, a net income tax benefit recognized in connection with the TCJ Act, a net gain from the mark to fair value of undesignated commodity derivative contracts, a gain in connection with the reduction in estimated fair value of a contingent liability associated with a prior period acquisition, and a foreign currency translation gain related to business reorganization activities, respectively; partially offset by $0.32, $0.28, $0.21 and $0.06 EPS for the year ended February 28, 2018, associated primarily with loss on extinguishment of debt, impairment of certain intangible assets, loss associated with the restructuring of an agreement with Owens-Illinois and loss on write-down of certain bulk wine inventory as a result of smoke damage sustained during the Fall 2017 California wildfires, respectively. (4)
|
(4) |
May not sum due to rounding as each item is computed independently. |
12
Constellation Brands, Inc. and Subsidiaries
RECONCILIATIONS OF GAAP TO NON-GAAP FINANCIAL MEASURES (continued)
GUIDANCE - FREE CASH FLOW
(in millions)
(unaudited)
Free Cash Flow Guidance
Free cash flow, as defined in the reconciliation below, is considered a liquidity measure and is considered to provide useful information to investors about the amount of cash generated, which can then be used, after required debt service and dividend payments, for other general corporate purposes. A limitation of free cash flow is that it does not represent the total increase or decrease in the cash balance for the period. Free cash flow should be considered in addition to, not as a substitute for, or superior to, cash flow from operating activities prepared in accordance with GAAP.
|
Range for the Year
Ending February 28, 2019
|
|||||||
Net cash provided by operating activities (GAAP) |
$ |
2,350.0 |
$ |
2,550.0 |
|||
Purchases of property, plant and equipment |
(1,150.0 |
) |
(1,250.0 |
) |
|||
Free cash flow (Non-GAAP) |
$ |
1,200.0 |
$ |
1,300.0 |
|||
|
Actual for the
Three Months Ended May 31, 2018 |
Actual for the
Three Months Ended May 31, 2017 |
||||||
Net cash provided by operating activities (GAAP) |
$ |
504.0 |
$ |
381.6 |
|||
Purchases of property, plant and equipment |
(168.2 |
) |
(217.1 |
) |
|||
Free cash flow (Non-GAAP) |
$ |
335.8 |
$ |
164.5 |
|||
13